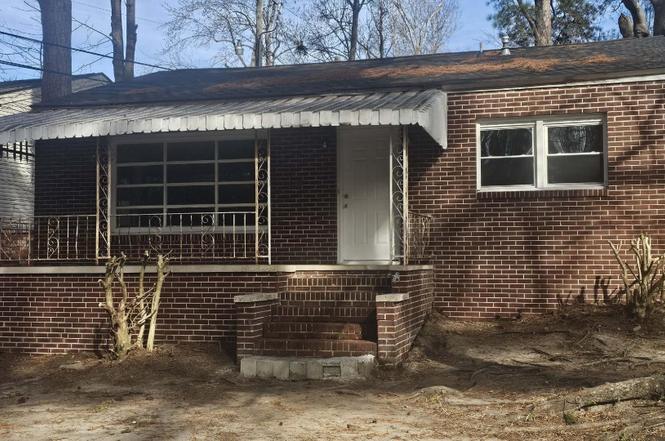
1112 Ashley · Columbia, SC
Flood risk 1/10 · Minimal
- FEMA flood zone
- X (unshaded)
- Chance of flooding over 30 yrs
- 0.0%
- Est. flood insurance / yr
- $507 – $1,088
Fire risk 3/10 · Minor
- Est. fire insurance / yr
- $783 – $1,453
Heat risk 6/10 · Moderate
- Hot days now (above 108°F)
- 7 days/yr
- Hot days in 30 yrs
- 16 days/yr
Wind risk 6/10 · Moderate
- Chance of severe wind over 30 yrs
- 67.0%
Air-quality risk 3/10 · Minor
- Unhealthy air days now
- 2 days/yr
- Unhealthy air days in 30 yrs
- 2 days/yr
Risk factors via First Street. Map © Google.
Why this score? — see what drove the C- grade
The composite is a weighted blend of 9 inputs, each scored 0–100. Each bar is that input's sub-score; the figure is the points it added to the 100-point composite (weight × sub-score).
- Cash flow +21.8/30.0
- ARV discount +7.5/15.0
- DSCR +7.0/10.0
- 1% rule +5.0/10.0
- Livability +3.9/5.0
- Rent growth +3.1/5.0
- Schools +2.6/10.0
- Condition / age +2.5/5.0
- Appreciation +0.0/10.0
$130,000
🖨 Deal sheet 📄 Offer letter ✓ Due diligence
Listing remarks
WELCOME TO THIS NEWLY RENOVATED 2 BEDROOM 1 BATHROOM HOME LOCATED JUST OFF OF NORTH MAIN ST. THIS HOME HAS A KITCHEN WITH BRAND NEW FLOORS, CABINETS, AND COUNTERTOPS. THE BATHROOM WAS ALSO RECENTLY RENOVATED. OTHER UPDATES INCLUDED NEWER ROOF, NEW ENERGY EFFICIENT WINDOWS AND BRAND NEW ELECTRICAL PANEL. THIS HOME IS IDEALLY PRICED FOR A WONDERFUL FIRST TIME HOME OWNER. OR INVESTORS LOOKING FOR A REAL GOOD RENTAL. THIS HOME WAS RENTED PREVIOUSLY RENTED 1300.00 A MONTH. THE SELLER IS WILLING TO GIVE A 5,000 allowance TOWARDS CLOSING OR UPGRADES NEW APPLIANCES CAN BE NEGOTIATED FOR THE RIGHT BUYER. SCHEDULE AND CALL FOR YOUR APT TODAY Disclaimer: CMLS has not reviewed and, therefore, does n
Key facts
- New floors
- Covered front porch
- New counter tops
Tags
Property features AI
Exterior
- Utilities: Public sewer; Public water
- Home design: Single-family property; Located on a 0.24-acre lot
- Construction: Crawlspace foundation
- Exterior features: Brick exterior on all sides above the foundation; Paved road access; Public water
Interior
- Bedrooms: Primary bedroom on the main level
- Bathrooms: One full bathroom
- Heating & cooling: Central heating
- Interior features: Central heating
Neighborhood map
What this means for you Summary
Snapshot
- This is a 2-bed/1.0-bath single-family listed at $130k.
Deal economics
- At list price, monthly cash flow is $202 ($2k/yr) — positive.
- The deal already cash-flows at list — no discount required.
- To meet the 1% rule (rent ≥ 1% of price), the offer needs to be $130k (0.3% below list).
- Recommended offer: $114k (12.0% below list) — sets the bar for market timing.
- Cap rate 8.2% vs local median 5.0% in Columbia — top-decile yield for the area; either an underpriced asset or a hidden risk that comps aren't pricing in. Stress-test before assuming the spread holds.
Location & tenants
- Location reads 78/100 on livability (#18 in SC, #2,436 nationally) — a middle-class / working-renter tenant base. Strengths: amenities A+, commute A+, cost of living A+; Watch: employment D, crime F.
- Richland 01 (urban): math 26% / reading 36% proficiency, ranked #54 of 80 in SC (top 68%) — families likely to look elsewhere, expect single-tenant / working-renter base with shorter leases; 64% free/reduced lunch — lower-income household profile, screen leases tightly.
- Zoned schools: Arden Elementary (math 12% / reading 12%, grade F, #572 of 597 statewide, top 97%, 234 students, 100% FRL); C. A. Johnson High (math 34% / reading 84%, grade C+, #110 of 196 statewide, top 58%, 364 students, 100% FRL) — zoned schools average 100% FRL vs 64% district-wide (36 pts higher); higher-poverty schools than district average — tighter screening recommended.
- Market conditions: Rents rising (+2.5%/yr); 238 active listings in the ZIP; 16 comparable units currently listed for rent nearby; rentals at typical pace (median 14d on market — plan ~3-4 weeks tenant-placement turnaround); 3,472 units permitted in Richland County in 2024 (1,096 in 5+ unit buildings).
- This rent runs 34% of the median local income ($46k/yr) — at the standard rent-burdened threshold; future hikes will face affordability resistance.
Forward outlook
- Local home prices are declining (-3.0%/yr); year-one equity from $899 of loan paydown is wiped out by about $4k of value loss. Plan a longer hold.
- Richland County population projected at +30% by 2050 — long-run rental-demand tailwind backs the buy-and-hold thesis.
Negotiation context
- It's been on market 152 days — a 12% lower offer ($114k) is reasonable based on typical stale-listing flexibility.
- 4 sale attempts since 7y ago with the ask held roughly flat each time — persistent listings suggest the price (not the market) is what's stuck; bring a comps-based counter.
Risks & watch-outs
- Watch-outs: built in 1948 — expect roof / HVAC / electrical / plumbing capex.
- Climate carrying-cost: major wind risk, 67% chance of damaging wind over 30y; extreme-heat days projected 7→16/yr by 2055 (HVAC capex compounding) — expect insurance premiums to compound above CPI over the hold.
Questions for the listing agent
- It's been on market 152 days. Have you received any prior offers? Is the seller open to a 12% concession, seller financing, or rate buy-down credit?
- Built in 1948 — when were the roof, HVAC, electrical panel, plumbing, and water heater last replaced?
- Why hasn't it sold? Are there any deal-killer items the seller is aware of (foundation, flood, title, zoning, code violations)?
- Is there a deadline driving the sale (1031 exchange, divorce, estate, relocation)? That informs how much negotiation room exists.
- Schools are D-rated, which usually means shorter tenancies and higher turnover. Who's the typical renter profile here, and what's been the actual vacancy rate?
- Crime grade is F in this area — have there been break-ins, vandalism, or insurance claims at this property in the last 3 years? What carrier currently insures it and at what premium?
- What's the average days-on-market for RENTAL listings here right now (not sales)? A rising rental-DOM trend means longer vacancies and softer asking-rent achievability than the comps imply.
- What's the recent tenant-quality profile in this submarket — average credit score on applications, eviction rate, late-payment / NSF rate, and stable-employment percentage? A property-management company in the area should have these aggregated.
- How much new for-sale + rental construction is in the pipeline within 1–3 miles? Heavy new supply typically softens prices + rents 12–24 months out; constrained supply supports both.
Investment metrics
- 1% rule
- 1.00% ✗
- Cap rate
- 8.16%
- Cash-on-cash
- 6.67%
- DSCR
- 1.30
- GRM
- 8.4
CMA / ARV
- ARV (on-the-fly)
- $49,538
- Comps found
- 1
Show comp detail 1 sale within ~0.75 mi
| Address | Dist | Beds/Ba | Sqft | Sold | Price | $/sf | Match |
|---|---|---|---|---|---|---|---|
| 5600 Holmes Ave | 0.36mi | 3/1.0 (+1) | 1,200 (+14%) | 24mo | $56,300 | $47 | 36 |
Match score weights: distance 35% · size 25% · config 20% · recency 20%. Top-matched comps best support the ARV.
Projected returns pro-forma
-3.0% appreciation · 2.5% rent growth · sell at horizon
- IRR
- -6.6%
- Equity multiple
- 0.76×
- Total profit
- $-8,853
- Equity at exit
- $19,383
- IRR
- 2.4%
- Equity multiple
- 1.17×
- Total profit
- $6,140
- Equity at exit
- $11,240
Cash invested: $36,400 (down + closing). Projections, not guarantees.
Landlord ↔ Tenant lean methodology
- Overall (STATE)
- 90 Strongly Landlord-Friendly
- State South Carolina
- 90 Strongly Landlord-Friendly · R+6
- County
- — inherits STATE
- City
- — inherits STATE
ZIP-level market 29203
- Home prices YoY
- -31.6%
- Rents YoY
- 2.5%
- Active inventory
- 238
- Price-to-rent
- 8.4×
Monthly cashflow live
- Estimated rent
- $1,296 high interval (Pro) →
- Mortgage (P&I)
- −$682
- Tax from tax record
- −$86 /mo · $1,029/yr
- Insurance
- −$54
- HOA
- −$0
- Vacancy / Maint / Mgmt
- −$272
- Net cashflow
- $202
Break-even live
UW: 25.0% down · 7.5% · 30yr · 1.5% tax · 5.0% vac · 8.0% maint · 8.0% mgmt
Financing live
Cash to close
- Down payment
- $32,500
- Closing costs
- $3,900
- Reserves months
- —
- Total cash needed
- —
Loan-product check · same deal, 3 products live
Conventional
25% down · 7.5% · 30yr
- Down + closing
- —
- Monthly P&I
- —
- Monthly cashflow
- —
- DSCR
- —
- Eligible?
- —
Personal DTI + credit; lowest rate.
DSCR
20% down · 8.5% · 30yr
- Down + closing
- —
- Monthly P&I
- —
- Monthly cashflow
- —
- DSCR
- —
- Eligible?
- —
No personal income docs; deal must DSCR.
Hard money
10% down · 12.0% · 12mo
- Down + closing
- —
- Monthly P&I
- —
- Monthly cashflow
- —
- DSCR
- —
- Eligible?
- —
Short-term bridge; refi at stabilization.
Rent comps 16 comps
| Address | Beds | Baths | Sqft | Rent | $/sqft | DOM | Units | Dist |
|---|---|---|---|---|---|---|---|---|
| 1506 Charlton St Columbia, SC | 3.0 | 2.0 | 1491 | $1,500 | $1.01 | 23d | 1 | 0.56mi |
| 1063 Prescott Rd Columbia, SC | 2.0 | 1.5 | 1210 | $1,200 | $0.99 | 14d | 1 | 0.70mi |
| 5779 Ames Rd Unit 13B Columbia, SC | 2.0 | 1.0 | 895 | $1,000 | $1.12 | 11d | 1 | 0.85mi |
| 5779 Ames Rd Columbia, SC | 2.0 | 1.0 | 895 | $1,000 | $1.12 | 14d | 1 | 0.85mi |
| 2308 Manse St Columbia, SC | 3.0 | 1.0 | 999 | $1,300 | $1.30 | 14d | 1 | 0.99mi |
| 5229 Woodbrier St Unit 504 Columbia, SC | 3.0 | 2.5 | 1360 | $1,500 | $1.10 | 23d | 1 | 1.10mi |
| 3015 English Ave Columbia, SC | 2.0 | 1.0 | 981 | $1,250 | $1.27 | 11d | 1 | 1.15mi |
| 5867 Ames Rd Columbia, SC | 3.0 | 1.0 | 802 | $1,200 | $1.50 | 14d | 1 | 1.16mi |
| 2928 English Ave Unit NA Columbia, SC | 3.0 | 1.0 | 1320 | $1,590 | $1.20 | 11d | 1 | 1.24mi |
| 3540 White St Columbia, SC | 2.0 | 1.0 | 725 | $1,300 | $1.79 | 23d | 1 | 1.26mi |
| 3145 Bronx Rd Columbia, SC | 3.0 | 1.5 | 1207 | $1,511 | $1.25 | 23d | 1 | 1.29mi |
| 1319 Hendrix St Columbia, SC | 2.0 | 1.0 | 900 | $1,050 | $1.17 | 23d | 1 | 1.33mi |
| 606 Muller Ave Columbia, SC | 2.0 | 1.0 | 1240 | $1,349 | $1.09 | 11d | 1 | 1.38mi |
| 3700 West Ave Columbia, SC | 1.0–2.0 | 1.0 | 750 | $850 | $1.13 | 14d | 1 | 1.40mi |
| 3500 Grand St Columbia, SC | 3.0 | 2.0 | 1300 | $2,000 | $1.54 | 14d | 1 | 1.42mi |
| 3419 Piedmont Ave Columbia, SC | 3.0 | 1.0 | 1100 | $1,195 | $1.09 | 23d | 1 | 1.47mi |
Listing history 22 events
-
2026-06-18days on market $130,000 Active 152 DOM
-
2026-06-17days on market $130,000 Active 151 DOM
-
2026-06-16days on market $130,000 Active 150 DOM
-
2026-06-15days on market $130,000 Active 149 DOM
-
2026-06-14days on market $130,000 Active 147 DOM
-
2026-06-10days on market $130,000 Active 144 DOM
-
2026-06-09days on market $130,000 Active 143 DOM
-
2026-06-08days on market $130,000 Active 142 DOM
-
2026-06-07days on market $130,000 Active 141 DOM
-
2026-06-03days on market $130,000 Active 137 DOM
-
2026-06-03days on market $130,000 Active 136 DOM
-
2026-06-01days on market $130,000 Active 135 DOM
-
2026-05-31days on market $130,000 Active 134 DOM
-
2026-04-11price $130,000
-
2026-01-17$135,000 Active
-
2019-11-03historical
-
2019-09-12status Active
-
2019-09-09historical
-
2019-08-24price $38,000
-
2019-08-23status Active
-
2019-08-02historical
-
2019-08-01$25,000 Active
ⓘ Source: listings_history table (triggers on properties + properties_extension) + one-shot
backfill from property_details.listing_events for pre-trigger history.
Tax reassessment forecast SC · Resets to sale price
- Current annual tax
- $1,029 · $86/mo
- Projected year-2 tax
- $1,029 · $86/mo
- Expected delta
- $0/yr ($0/mo · 0.0%)
ⓘ Screening estimate from a state-policy table — verify with the county assessor before closing.
Climate risk First Street
- Flood 1/10 Low FEMA zone X (unshaded) · 0% chance over 30 yrs
- Wildfire 3/10 Moderate
- Heat 6/10 Major 7 d/yr ≥108°F today · 16 d/yr by 30 yrs out
- Wind 6/10 Major 67% chance of damaging wind over 30 yrs
- Air quality 3/10 Moderate 2 unhealthy d/yr today · 2 by 30 yrs out
Nearby sold comps map
Loading sold comps map…
Walkable amenities ~0.75 mi
Loading nearby amenities…
Taxation est. · year 1
- Rental income
- $15,555
- − Mortgage interest
- −$7,282
- − Property taxes
- −$1,029
- − Insurance
- −$650
- − Repairs & maintenance
- −$1,244
- − Management
- −$1,244
- − Depreciation
- −$3,782
- Taxable income
- $323
- Est. tax owed @ 24.0%
- −$78
- After-tax cash flow
- $2,351/yr
For passive investors: Depreciation is non-cash, so a rental often shows a tax loss while cash-flowing — sheltering income. Rental losses are passive: they offset passive income freely, and up to $25,000/yr can offset ordinary (W-2) income if you actively participate and your MAGI is under $100k (phasing out to $0 by $150k); unused losses carry forward. On sale, claimed depreciation is recaptured at up to 25%, and gains may owe capital-gains tax (a 1031 exchange can defer both). Figures are a year-1 estimate at your 24.0% rate — not tax advice; consult a CPA.
Schools (NCES district)
- District
- Richland 01
- NCES district ID
- 4503360
- Math proficiency
- 26% ▼ -7.00%
- Reading proficiency
- 36% ▼ -5.00%
- Median HH income
- $38,931
- Composite
- 25.94/100
- National rank
- #7335
- State rank
- #54 of 80 in SC
Livability — Columbia
- Score
- 78/100
- State rank
- #18
- US rank
- #2436
Category grades
Schools grade is shown separately in the Schools card above.
Census & demographics
- Census place
- Columbia, SC
- County
- Richland County · 389,530 people
- City population
- 335,994
- Metro
- Columbia, SC
- Population (ZIP)
- 40,653
- Household income
- $46,054
- Rent vs Own
- Severe rent burden
- 1980.0
Population outlook (Richland County) Hauer SSP2
- Today (2025)
- 459,667 people
- By 2030
- 487,524 · +6.1%
- By 2040
- 542,035 · +17.9%
- By 2050
- 595,371 · +29.5%
- By 2075
- 732,998 · +59.5%
- By 2100
- 820,415 · +78.5%
Race, ethnicity, and origin ACS 2023
- Neighborhood character
- Predominantly Black (80%)
- Race & ethnicity
- Black 80% White 13% Hispanic / Latino 5% Two or more races 2%
- Common ancestry
- Serbian 1%
- Foreign-born
- 3% · Canada
- Languages at home
- 93% English-only · Spanish 5%
Political lean MEDSL · Richland
- 2024 margin
- Solid D (+34.6) · D 66.4% · R 31.8% · Other 1.8%
- 2008→2024 swing
- +5.7pp toward D · 2008: 28.9pp · 2024: 34.6pp
- All cycles
- 2024: D+34.6 2020: D+38.3 2016: D+32.9 2012: D+33.3 2008: D+28.9
Not yet ingested
- Civics
- —
Market trends
- HPI YoY
- ▼ -77.52%
- Current HPI
- 168.2114
- Rent YoY
- ▲ 2.50%
- Metro
- Columbia, SC
- State GDP YoY
- ▲ 4.51%
- F500 in state
- 2
Industry mix (Fortune 500 HQ in SC)
| Industry | F500 HQs | Revenue |
|---|---|---|
| Packaging | 1 | $7B |
|
||
Price history
+420.0% since first listed9 events — show timeline
- 2026-04-11 Price Changed $130,000 Consolidated MLS
- 2026-01-17 Listed $135,000 Consolidated MLS
- 2019-11-03 Delisted — Consolidated MLS
- 2019-09-12 Relisted — Consolidated MLS
- 2019-09-09 Delisted — Consolidated MLS
- 2019-08-24 Price Changed $38,000 Consolidated MLS
- 2019-08-23 Relisted — Consolidated MLS
- 2019-08-02 Delisted — Consolidated MLS
- 2019-08-01 Listed $25,000 Consolidated MLS
Property tax history
-2.4%/yrLatest (2025): $1,029 · +2.1% YoY. Source: county tax records.
Cash-flow waterfall
monthlySold comps — $/sqft
last 12 mo · ≤1 miLoading sold comps…