4405 S Calle Viveza · Fort Mohave, AZ
Flood risk 1/10 · Minimal
- FEMA flood zone
- X (shaded)
- Chance of flooding over 30 yrs
- 0.0%
- Est. flood insurance / yr
- $507 – $1,088
Fire risk 5/10 · Moderate
- Est. fire insurance / yr
- $610 – $1,132
Heat risk 9/10 · Severe
- Hot days now (above 115°F)
- 7 days/yr
- Hot days in 30 yrs
- 15 days/yr
Wind risk 1/10 · Minimal
- Chance of severe wind over 30 yrs
- —
Air-quality risk 1/10 · Minimal
- Unhealthy air days now
- 0 days/yr
- Unhealthy air days in 30 yrs
- 0 days/yr
Risk factors via First Street. Map © Google.
Why this score? — see what drove the C- grade
The composite is a weighted blend of 9 inputs, each scored 0–100. Each bar is that input's sub-score; the figure is the points it added to the 100-point composite (weight × sub-score).
- Cash flow +22.2/30.0
- ARV discount +7.5/15.0
- DSCR +7.1/10.0
- 1% rule +5.9/10.0
- Livability +3.2/5.0
- Rent growth +2.5/5.0
- Condition / age +2.5/5.0
- Schools +1.3/10.0
- Appreciation +0.0/10.0
$124,900
🖨 Deal sheet (PDF) 📄 Offer letter ✓ Due diligence
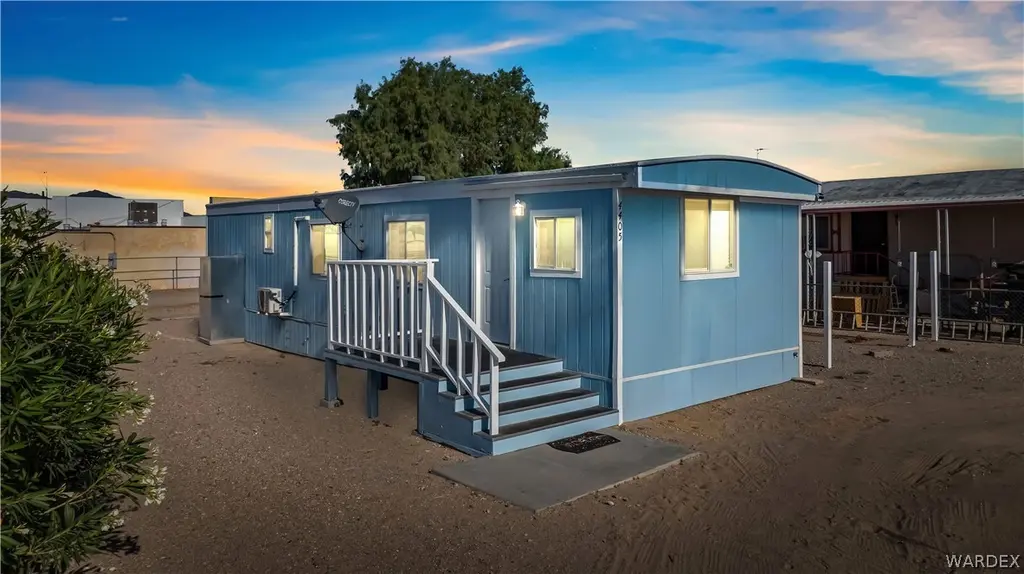
Listing remarks
Centrally located in the heart of Fort Mohave, this charming home is perfect for first-time homebuyers, a weekend getaway, or savvy investors. This freshly remodeled property features stainless steel appliances, granite countertops, and stylish vinyl flooring throughout. The home is equipped with two mini-split units, and all appliances—including the refrigerator, washer, and dryer—are just two years old. Enjoy ample parking with the potential to add a carport, garage, or additional fencing for added privacy. The community offers low HOA fees and access to a pool and clubhouse, all while being conveniently located near boat launches, shopping, restaurants, medical plazas, and th
Key facts
- 6,098 sq ft lot
- Community pool
- Built 1984
Property features AI
Finance
- Other: Zoned RMH (Residential Mobile Homes)
- HOA & community: Homeowners association with annual fee (about $97/year); Community clubhouse
Exterior
- Parking: RV access/parking; Paved road access
- Security: Leased security system
- Utilities: Electricity available; Septic tank
- Home design: Manufactured home (single wide); Faces east; Frame construction
- Construction: Shingle roof
- Exterior features: Balcony; Chain link backyard fence; Community pool
Interior
- Kitchen: Dishwasher; Electric oven; Electric range; Garbage disposal; Microwave; Refrigerator; Water heater
- Flooring: Vinyl
- Bathrooms: 1 full bathroom
- Heating & cooling: Ductless heating and cooling; Central heating; Central air; Electric heating/cooling; Multiple ductless units
- Interior features: Ceiling fans; Granite counters; Open floor plan; Window coverings
- Laundry & utility: Washer and dryer included; Electric dryer hookup inside
Neighborhood map
What this means for you Summary
Snapshot
- This is a 2-bed/1.0-bath land listed at $125k.
Deal economics
- At list price, monthly cash flow is $204 ($2k/yr) — positive.
- The deal already cash-flows at list — no discount required.
- Meets the 1% rule at list price ($1k rent vs $125k).
- Cap rate 8.2% vs local median 4.2% in Fort Mohave — top-decile yield for the area; either an underpriced asset or a hidden risk that comps aren't pricing in. Stress-test before assuming the spread holds.
Location & tenants
- Location reads 65/100 on livability (#88 in AZ) — a middle-class / working-renter tenant base. Strengths: cost of living A+, housing A+; Watch: employment C-, health & safety C-, crime D+.
- Colorado River Union High School District (4381) (town): math 13% / reading 17% proficiency, ranked #213 of 249 in AZ (top 86%) — low school quality limits family demand, transient renter base, plan for 1-2y turnover.
- Market conditions: 376 active listings in the ZIP; 2,543 units permitted in Mohave County in 2024 (33 in 5+ unit buildings).
Forward outlook
- Local home prices are declining (-3.0%/yr); year-one equity from $864 of loan paydown is wiped out by about $4k of value loss. Plan a longer hold.
- Mohave County population projected to shrink 6% by 2050 — rents likely to lag national; underwrite the cash flow, not the appreciation.
Negotiation context
- Only 3 days on market — expect competitive offers; lowballing is unlikely to land.
- 6 sale attempts since 4y ago with the ask held roughly flat each time — persistent listings suggest the price (not the market) is what's stuck; bring a comps-based counter.
Risks & watch-outs
- Climate carrying-cost: moderate wildfire risk; extreme-heat days projected 7→15/yr by 2055 (HVAC capex compounding) — expect insurance premiums to compound above CPI over the hold.
Questions for the listing agent
- What does the HOA fee cover, when was the last increase, and are there any pending special assessments or reserve-fund shortfalls?
- Is there a deadline driving the sale (1031 exchange, divorce, estate, relocation)? That informs how much negotiation room exists.
- Schools are F-rated, which usually means shorter tenancies and higher turnover. Who's the typical renter profile here, and what's been the actual vacancy rate?
- Crime grade is D in this area — have there been break-ins, vandalism, or insurance claims at this property in the last 3 years? What carrier currently insures it and at what premium?
- What's the average days-on-market for RENTAL listings here right now (not sales)? A rising rental-DOM trend means longer vacancies and softer asking-rent achievability than the comps imply.
- What's the recent tenant-quality profile in this submarket — average credit score on applications, eviction rate, late-payment / NSF rate, and stable-employment percentage? A property-management company in the area should have these aggregated.
- How much new for-sale + rental construction is in the pipeline within 1–3 miles? Heavy new supply typically softens prices + rents 12–24 months out; constrained supply supports both.
Investment metrics
- 1% rule
- 1.09% ✓
- Cap rate
- 8.25%
- Cash-on-cash
- 6.98%
- DSCR
- 1.31
- GRM
- 7.7
CMA / ARV
No comps found within radius.
Projected returns pro-forma
-3.0% appreciation · 3.0% rent growth · sell at horizon
- IRR
- -5.6%
- Equity multiple
- 0.79×
- Total profit
- $-7,252
- Equity at exit
- $18,623
- IRR
- 4.1%
- Equity multiple
- 1.30×
- Total profit
- $10,478
- Equity at exit
- $10,799
Cash invested: $34,972 (down + closing). Projections, not guarantees.
Landlord ↔ Tenant lean methodology
- Overall (STATE)
- 87 Strongly Landlord-Friendly
- State Arizona
- 87 Strongly Landlord-Friendly · R+3
- County
- — inherits STATE
- City
- — inherits STATE
ZIP-level market 86426
- Home prices YoY
- -5.2%
- Active inventory
- 376
- Price-to-rent
- 7.7×
Monthly cashflow live
- Estimated rent
- $1,360 medium interval (Pro) →
- Mortgage (P&I)
- −$655
- Tax est. 1.5%
- −$156 /mo · $1,874/yr
- Insurance
- −$52
- HOA
- −$8
- Vacancy / Maint / Mgmt
- −$286
- Net cashflow
- $204
Break-even live
Sensitivity live
| Price | -10% $290 | -5% $247 | +0% $204 | +5% $160 | +10% $117 |
|---|---|---|---|---|---|
| Rent | -10% $96 | -5% $150 | +0% $204 | +5% $257 | +10% $311 |
| Rate | -1.0pp $266 | -0.5pp $235 | base $204 | +0.5pp $171 | +1.0pp $138 |
UW: 25.0% down · 7.5% · 30yr · 1.5% tax · 5.0% vac · 8.0% maint · 8.0% mgmt
Financing live
Cash to close
- Down payment
- $31,225
- Closing costs
- $3,747
- Reserves months
- —
- Total cash needed
- —
Loan-product check · same deal, 3 products live
Conventional
25% down · 7.5% · 30yr
- Down + closing
- —
- Monthly P&I
- —
- Monthly cashflow
- —
- DSCR
- —
- Eligible?
- —
Personal DTI + credit; lowest rate.
DSCR
20% down · 8.5% · 30yr
- Down + closing
- —
- Monthly P&I
- —
- Monthly cashflow
- —
- DSCR
- —
- Eligible?
- —
No personal income docs; deal must DSCR.
Hard money
10% down · 12.0% · 12mo
- Down + closing
- —
- Monthly P&I
- —
- Monthly cashflow
- —
- DSCR
- —
- Eligible?
- —
Short-term bridge; refi at stabilization.
HOA detail
- Monthly dues
- $8 · $96/yr
- Likely covers
- pool
Listing history 4 events
-
2026-06-16days on market $124,900 Active 3 DOM
-
2026-06-15days on market $124,900 Active 2 DOM
-
2026-06-14remarks 687-char remark
-
2026-06-14$124,900 Active 1 DOM
ⓘ Source: listings_history table (triggers on properties + properties_extension) + one-shot
backfill from property_details.listing_events for pre-trigger history.
Climate risk First Street
- Flood 1/10 Low FEMA zone X (shaded) · 0% chance over 30 yrs
- Wildfire 5/10 Major
- Heat 9/10 Extreme 7 d/yr ≥115°F today · 15 d/yr by 30 yrs out
- Wind 1/10 Low
- Air quality 1/10 Low 0 unhealthy d/yr today · 0 by 30 yrs out
Nearby sold comps map
Loading sold comps map…
Walkable amenities ~0.75 mi
Loading nearby amenities…
Taxation est. · year 1
- Rental income
- $16,324
- − Mortgage interest
- −$6,996
- − Property taxes
- −$1,874
- − Insurance
- −$624
- − Repairs & maintenance
- −$1,306
- − Management
- −$1,306
- − HOA
- −$96
- − Depreciation
- −$3,633
- Taxable income
- $488
- Est. tax owed @ 24.0%
- −$117
- After-tax cash flow
- $2,325/yr
For passive investors: Depreciation is non-cash, so a rental often shows a tax loss while cash-flowing — sheltering income. Rental losses are passive: they offset passive income freely, and up to $25,000/yr can offset ordinary (W-2) income if you actively participate and your MAGI is under $100k (phasing out to $0 by $150k); unused losses carry forward. On sale, claimed depreciation is recaptured at up to 25%, and gains may owe capital-gains tax (a 1031 exchange can defer both). Figures are a year-1 estimate at your 24.0% rate — not tax advice; consult a CPA.
Schools (NCES district)
- District
- Colorado River Union High School District (4381)
- NCES district ID
- 0400082
- Math proficiency
- 13% ▼ -17.00%
- Reading proficiency
- 17% ▼ -18.00%
- Median HH income
- $39,132
- Composite
- 12.72/100
- National rank
- #9603
- State rank
- #213 of 249 in AZ
Livability — Fort Mohave
- Score
- 65/100
- State rank
- #88
- US rank
- #13539
Category grades
Schools grade is shown separately in the Schools card above.
Census & demographics
- Census place
- Fort Mohave, AZ
- County
- Mohave County · 181,906 people
- City population
- 15,467
- Metro
- Lake Havasu City-Kingman, AZ
- Population (ZIP)
- 15,467
- Household income
- $64,551
- Rent vs Own
- Severe rent burden
- 207.0
Population outlook (Mohave County) Hauer SSP2
- Today (2025)
- 209,184 people
- By 2030
- 209,674 · +0.2%
- By 2040
- 205,897 · -1.6%
- By 2050
- 196,810 · -5.9%
- By 2075
- 169,454 · -19.0%
- By 2100
- 136,630 · -34.7%
Race, ethnicity, and origin ACS 2023
- Neighborhood character
- Predominantly White (73%)
- Race & ethnicity
- White 73% Hispanic / Latino 18% Two or more races 8% Asian 4%
- Hispanic origin (detail)
- Mexican 14%
- Common ancestry
- Lithuanian 3% Romanian 2% Italian 1%
- Foreign-born
- 7% · Canada
- Languages at home
- 88% English-only · Spanish 7% Tagalog/Filipino 2% Other Asian/Pacific 1%
Political lean MEDSL · Mohave
- 2024 margin
- Solid R (+55.8) · D 21.8% · R 77.6%
- 2008→2024 swing
- -22.9pp toward R · 2008: -32.9pp · 2024: -55.8pp
- All cycles
- 2024: R+55.8 2020: R+51.3 2016: R+51.5 2012: R+42.6 2008: R+32.9
Not yet ingested
- Civics
- —
Market trends
- HPI YoY
- ▼ -15.22%
- Current HPI
- 278.7975
- Rent YoY
- —
- Metro
- Lake Havasu City-Kingman, AZ
- State GDP YoY
- ▲ 4.54%
- F500 in state
- 20
Industry mix (Fortune 500 HQ in AZ)
| Industry | F500 HQs | Revenue |
|---|---|---|
| Technology | 2 | $13B |
|
||
| Mining / Metals | 1 | $23B |
|
||
| Environmental Services | 1 | $16B |
|
||
| Metals / Steel | 1 | $14B |
|
||
| Technology Distribution | 1 | $9B |
|
||
| Homebuilding | 1 | $8B |
|
||
Price history
+78.4% since first listed14 events — show timeline
- 2026-06-13 Listed $124,900 WARDEX
- 2025-09-07 Price Changed $155,000 WARDEX
- 2025-08-21 Listed $165,000 WARDEX
- 2025-06-21 Price Changed $175,900 WARDEX
- 2025-05-23 Relisted — WARDEX
- 2025-05-23 Price Changed $184,900 WARDEX
- 2025-04-17 Listed $189,000 WARDEX
- 2024-08-12 Sold (Public Records) $145,000 Public Records
- 2024-08-12 Sold (MLS) $145,000 WARDEX
- 2024-07-10 Pending — WARDEX
- 2024-05-21 Listed $149,900 WARDEX
- 2022-03-23 Sold (Public Records) $49,000 Public Records
- 2022-03-23 Sold (MLS) $49,000 WARDEX
- 2022-01-14 Listed $70,000 WARDEX
Property tax history
+2.4%/yrLatest (2025): $124 · -6.4% YoY. Source: county tax records.
Cash-flow waterfall
monthlySold comps — $/sqft
last 12 mo · ≤1 miLoading sold comps…