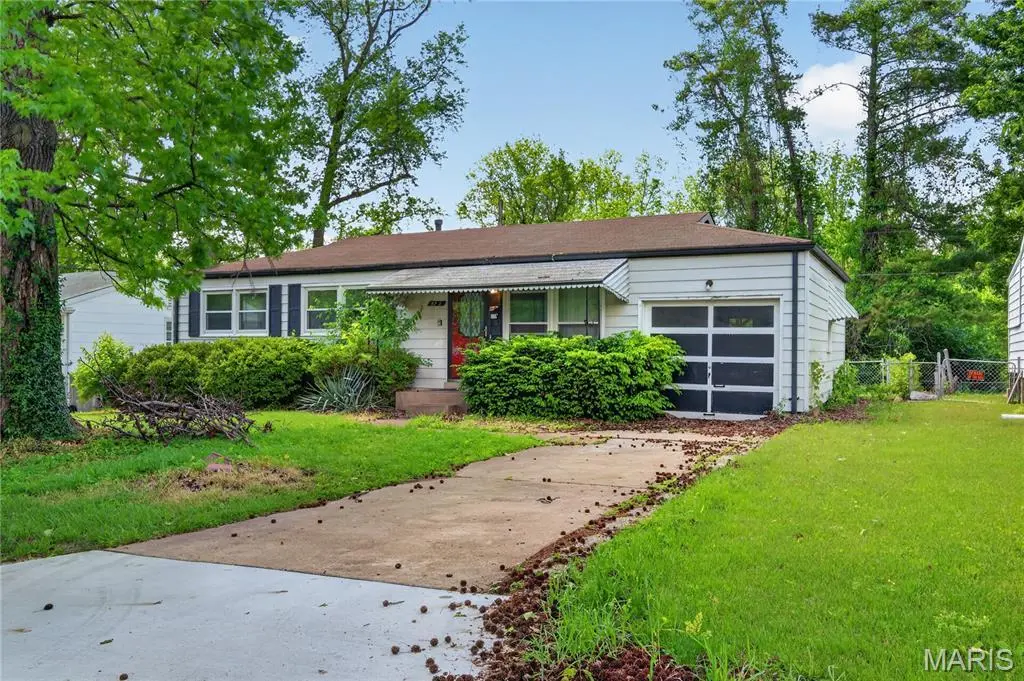
9713 Calumet Dr · Bellefontaine Neighbors, MO
Flood risk 1/10 · Minimal
- FEMA flood zone
- X (unshaded)
- Chance of flooding over 30 yrs
- 0.0%
- Est. flood insurance / yr
- $473 – $860
Fire risk 1/10 · Minimal
- Est. fire insurance / yr
- $1,054 – $1,958
Heat risk 5/10 · Moderate
- Hot days now (above 107°F)
- 7 days/yr
- Hot days in 30 yrs
- 21 days/yr
Wind risk 2/10 · Minimal
- Chance of severe wind over 30 yrs
- 1.0%
Air-quality risk 4/10 · Minor
- Unhealthy air days now
- 5 days/yr
- Unhealthy air days in 30 yrs
- 6 days/yr
Risk factors via First Street. Map © Google.
Why this score? — see what drove the B grade
The composite is a weighted blend of 9 inputs, each scored 0–100. Each bar is that input's sub-score; the figure is the points it added to the 100-point composite (weight × sub-score).
- Cash flow +30.0/30.0
- ARV discount +15.0/15.0
- 1% rule +10.0/10.0
- DSCR +10.0/10.0
- Rent growth +4.1/5.0
- Livability +2.9/5.0
- Condition / age +2.5/5.0
- Schools +0.4/10.0
- Appreciation +0.0/10.0
$74,900
🖨 Deal sheet (PDF) 📄 Offer letter ✓ Due diligence
Listing remarks
Welcome to this well-maintained home in Bellefontaine Neighbors offering comfort, functionality, and value. This property features a bright living area with ample natural light, an efficient layout, and a spacious kitchen with plenty of cabinet storage. Generous bedroom sizes provide flexibility for families, guests, or a home office. The lower level offers additional space ideal for storage or future finishing. Enjoy a sizable yard perfect for outdoor gatherings, gardening, or relaxing evenings. Conveniently located near major highways, shopping, and local amenities, this home provides easy access to the greater St. Louis area while maintaining a quiet neighborhood feel. A great opportunit
Key facts
- Sizable yard
- Ample natural light
- Bright living area
Tags
Property features AI
Finance
- Other: Living area reported as 912 (public records)
- Financial info: Lease not considered
Exterior
- Parking: Attached 1-car garage (1 total parking space)
- Utilities: Public water; Public sewer; Electric service (other)
- Home design: Single-family residence; One story; Private ownership
- Construction: Vinyl siding; Composition roof; Built on slab foundation
- Exterior features: Level lot; No patio or porch
Interior
- Kitchen: Other appliances
- Bedrooms: 2 bedrooms (both on the main level)
- Bathrooms: 1 full bathroom (on the main level)
- Heating & cooling: Central air conditioning (electric)
- Interior features: Partially finished basement; Other heating system
- Laundry & utility: Slab foundation
Neighborhood map
What this means for you Summary
Snapshot
- This is a 2-bed/1.0-bath single-family listed at $75k.
Deal economics
- At list price, monthly cash flow is $416 ($5k/yr) — positive.
- The deal already cash-flows at list — no discount required.
- Meets the 1% rule at list price ($1k rent vs $75k).
- Recommended offer: $73k (3.0% below list) — sets the bar for market timing.
- Cap rate 13.0% vs local median 9.6% in Bellefontaine Neighbors — top-decile yield for the area; either an underpriced asset or a hidden risk that comps aren't pricing in. Stress-test before assuming the spread holds.
Location & tenants
- Location reads 58/100 on livability (#592 in MO) — a working-class tenant base; expect higher turnover. Strengths: cost of living A+, housing B+; Watch: employment D+, crime F, amenities F.
- Riverview Gardens (suburban): math 2% / reading 9% proficiency, ranked #324 of 324 in MO (top 100%) — low school quality limits family demand, transient renter base, plan for 1-2y turnover; 90% free/reduced lunch — lower-income household profile, screen leases tightly.
- Zoned schools: Gibson Elem. (math 0% / reading 7%, grade F, #1,097 of 1,115 statewide, top 98%, 429 students, 99% FRL); Riverview Gardens Sr. High (math 2% / reading 18%, grade F, #501 of 521 statewide, top 97%, 1,331 students, 100% FRL).
- Market conditions: Rents rising fast (+6.6%/yr); 204 active listings in the ZIP; 40 comparable units currently listed for rent nearby; rentals at typical pace (median 26d on market — plan ~3-4 weeks tenant-placement turnaround); 40% of comp listings sitting > 30 days — soft ceiling on asking rent; lower-income renter base — watch delinquency; 920 units permitted in St. Louis County in 2024 (250 in 5+ unit buildings).
- This rent runs 33% of the median local income ($43k/yr) — at the standard rent-burdened threshold; future hikes will face affordability resistance.
Forward outlook
- Local home prices are declining (-3.0%/yr); year-one equity from $518 of loan paydown is wiped out by about $2k of value loss. Plan a longer hold.
- At projected returns (-3.0% appreciation + 6.6% rent growth), your $21k cash investment doubles in ~5 years — after that, you're playing with house money.
Negotiation context
- It's been on market 52 days — a 3% lower offer ($73k) is reasonable based on typical stale-listing flexibility.
Risks & watch-outs
- Watch-outs: built in 1956 — expect roof / HVAC / electrical / plumbing capex.
- Climate carrying-cost: extreme-heat days projected 7→21/yr by 2055 (HVAC capex compounding) — expect insurance premiums to compound above CPI over the hold.
Questions for the listing agent
- It's been on market 52 days. Have you received any prior offers? Is the seller open to a 3% concession, seller financing, or rate buy-down credit?
- Built in 1956 — when were the roof, HVAC, electrical panel, plumbing, and water heater last replaced?
- Is there a deadline driving the sale (1031 exchange, divorce, estate, relocation)? That informs how much negotiation room exists.
- Schools are F-rated, which usually means shorter tenancies and higher turnover. Who's the typical renter profile here, and what's been the actual vacancy rate?
- Crime grade is F in this area — have there been break-ins, vandalism, or insurance claims at this property in the last 3 years? What carrier currently insures it and at what premium?
- What's the average days-on-market for RENTAL listings here right now (not sales)? A rising rental-DOM trend means longer vacancies and softer asking-rent achievability than the comps imply.
- What's the recent tenant-quality profile in this submarket — average credit score on applications, eviction rate, late-payment / NSF rate, and stable-employment percentage? A property-management company in the area should have these aggregated.
- How much new for-sale + rental construction is in the pipeline within 1–3 miles? Heavy new supply typically softens prices + rents 12–24 months out; constrained supply supports both.
Investment metrics
- 1% rule
- 1.62% ✓
- Cap rate
- 12.96%
- Cash-on-cash
- 23.80%
- DSCR
- 2.06
- GRM
- 5.2
CMA / ARV
- ARV (median comp)
- $90,290
- List price
- $74,900
- Delta
- -17.04%
- Verdict
- UNDERPRICED
- Comps
- 20 within 1.0 mi
Show comp detail 12 sales within ~0.75 mi
| Address | Dist | Beds/Ba | Sqft | Sold | Price | $/sf | Match |
|---|---|---|---|---|---|---|---|
| 614 Ludlow Dr | 0.09mi | 3/1.0 (+1) | 960 (+5%) | 5mo | $109,900 | $114 | 78 |
| 9737 Calumet Dr | 0.07mi | 3/2.0 (+1) | 840 (-8%) | 3mo | $149,500 | $178 | 72 |
| 10066 Dorothy Ave | 0.66mi | 2/1.0 | 916 (+0%) | 2mo | $99,900 | $109 | 67 |
| 817 Lebon Dr | 0.69mi | 2/1.0 | 884 (-3%) | 2mo | $93,000 | $105 | 62 |
| 700 Chambers Rd | 0.48mi | 3/1.0 (+1) | 960 (+5%) | 5mo | $114,500 | $119 | 60 |
| 810 Teurville Dr | 0.68mi | 3/1.0 (+1) | 904 (-1%) | 7mo | $70,000 | $77 | 56 |
| 10045 Dorothy Ave | 0.61mi | 3/1.0 (+1) | 864 (-5%) | 6mo | $99,900 | $116 | 53 |
| 375 Adrian Dr | 0.52mi | 3/1.0 (+1) | 1,008 (+10%) | 6mo | $110,000 | $109 | 48 |
| 5 Forest Home Ct | 0.68mi | 3/1.0 (+1) | 975 (+7%) | 5mo | $149,900 | $154 | 48 |
| 339 Midridge Dr | 0.59mi | 2/1.0 | 798 (-12%) | 7mo | $40,000 | $50 | 46 |
| 10071 Diamond Dr | 0.73mi | 2/1.0 | 1,008 (+10%) | 5mo | $64,900 | $64 | 45 |
| 534 Alcove Ave | 0.73mi | 3/1.0 (+1) | 996 (+9%) | 3mo | $104,200 | $105 | 43 |
Match score weights: distance 35% · size 25% · config 20% · recency 20%. Top-matched comps best support the ARV.
Projected returns pro-forma
-3.0% appreciation · 6.59% rent growth · sell at horizon
- IRR
- 21.1%
- Equity multiple
- 1.90×
- Total profit
- $18,922
- Equity at exit
- $11,168
- IRR
- 31.6%
- Equity multiple
- 4.37×
- Total profit
- $70,754
- Equity at exit
- $6,476
Cash invested: $20,972 (down + closing). Projections, not guarantees.
Landlord ↔ Tenant lean methodology
- Overall (STATE)
- 81 Strongly Landlord-Friendly
- State Missouri
- 81 Strongly Landlord-Friendly · R+10
- County
- — inherits STATE
- City
- — inherits STATE
ZIP-level market 63137
- Rents YoY
- 6.6%
- Active inventory
- 204
- Price-to-rent
- 5.2×
Monthly cashflow live
- Estimated rent
- $1,211 high interval (Pro) →
- Mortgage (P&I)
- −$393
- Tax from tax record
- −$117 /mo · $1,405/yr
- Insurance
- −$31
- HOA
- −$0
- Lot rent
- −$0
- Vacancy / Maint / Mgmt
- −$254
- Net cashflow
- $416
Break-even live
Sensitivity live
| Price | -10% $458 | -5% $437 | +0% $416 | +5% $395 | +10% $374 |
|---|---|---|---|---|---|
| Rent | -10% $320 | -5% $368 | +0% $416 | +5% $464 | +10% $512 |
| Rate | -1.0pp $454 | -0.5pp $435 | base $416 | +0.5pp $397 | +1.0pp $377 |
UW: 25.0% down · 7.5% · 30yr · 1.5% tax · 5.0% vac · 8.0% maint · 8.0% mgmt
Financing live
Cash to close
- Down payment
- $18,725
- Closing costs
- $2,247
- Reserves months
- —
- Total cash needed
- —
Loan-product check · same deal, 3 products live
Conventional
25% down · 7.5% · 30yr
- Down + closing
- —
- Monthly P&I
- —
- Monthly cashflow
- —
- DSCR
- —
- Eligible?
- —
Personal DTI + credit; lowest rate.
DSCR
20% down · 8.5% · 30yr
- Down + closing
- —
- Monthly P&I
- —
- Monthly cashflow
- —
- DSCR
- —
- Eligible?
- —
No personal income docs; deal must DSCR.
Hard money
10% down · 12.0% · 12mo
- Down + closing
- —
- Monthly P&I
- —
- Monthly cashflow
- —
- DSCR
- —
- Eligible?
- —
Short-term bridge; refi at stabilization.
Rent comps 40 comps
| Address | Beds | Baths | Sqft | Rent | $/sqft | DOM | Units | Dist |
|---|---|---|---|---|---|---|---|---|
| 623 Ludlow Dr Saint Louis, MO | 2.0 | 1.0 | 840 | $1,199 | $1.43 | 26d | 1 | 0.06mi |
| 9811 Lilac Dr Unit I St. Louis, MO | 2.0 | 1.0 | 705 | $799 | $1.13 | 46d | 1 | 0.19mi |
| 9805 Lilac Dr Saint Louis, MO | 1.0 | 1.0 | 575 | $720 | $1.25 | 46d | 1 | 0.21mi |
| 460 Bluff Dr Saint Louis, MO | 3.0 | 1.0 | 1002 | $1,300 | $1.30 | 46d | 1 | 0.30mi |
| 9924 Gloucester Dr Saint Louis, MO | 3.0 | 2.0 | 992 | $1,565 | $1.58 | 13d | 1 | 0.32mi |
| 435 Adrian Dr Saint Louis, MO | 3.0 | 1.0 | 1100 | $950 | $0.86 | 22d | 1 | 0.36mi |
| 9943 Lilac Dr Saint Louis, MO | 2.0 | 1.0 | 1086 | $1,000 | $0.92 | 46d | 1 | 0.39mi |
| 9640 Diamond Dr Saint Louis, MO | 1.0–2.0 | 1.0 | 625 | $800 | $1.28 | 17d | 3 | 0.48mi |
| 9746 Diamond Dr Saint Louis, MO | 3.0 | 2.0 | 910 | $1,275 | $1.40 | 46d | 1 | 0.49mi |
| 344 Midridge Dr Saint Louis, MO | 2.0 | 1.0 | 810 | $1,053 | $1.30 | 46d | 1 | 0.54mi |
| 10027 Lilac Ave Saint Louis, MO | 3.0 | 1.0 | 1008 | $1,225 | $1.22 | 1d | 1 | 0.57mi |
| 10066 Dorothy Ave Saint Louis, MO | 2.0 | 1.0 | 916 | $1,225 | $1.34 | 24d | 1 | 0.63mi |
| 1130 Forest Home Dr Saint Louis, MO | 3.0 | 1.0 | 1025 | $1,275 | $1.24 | 46d | 1 | 0.65mi |
| 255 Chambers Rd St. Louis, MO | 2.0 | 1.0 | 700 | $850 | $1.21 | 46d | 1 | 0.70mi |
| 10201 Gourock Dr Saint Louis, MO | 3.0 | 1.0 | 886 | $1,275 | $1.44 | 1d | 1 | 0.75mi |
| 10201 Gourock Dr Saint Louis, MO | 3.0 | 1.0 | 886 | $1,275 | $1.44 | 46d | 1 | 0.75mi |
| 515 Topaz Ave Saint Louis, MO | 3.0 | 2.0 | 912 | $1,245 | $1.37 | 1d | 1 | 0.78mi |
| 10019 Northgate Dr Saint Louis, MO | 3.0 | 1.0 | 991 | $1,150 | $1.16 | 24d | 1 | 0.84mi |
| 10213 Durness Dr Saint Louis, MO | 2.0 | 1.0 | 932 | $1,225 | $1.31 | 46d | 1 | 0.85mi |
| 10063 Northgate Dr Saint Louis, MO | 2.0 | 1.0 | 1054 | $1,200 | $1.14 | 46d | 1 | 0.90mi |
| 10327 Renfrew Dr Saint Louis, MO | 3.0 | 1.0 | 844 | $1,199 | $1.42 | 46d | 1 | 0.92mi |
| 10203 Trio Ln Saint Louis, MO | 3.0 | 1.0 | 912 | $1,435 | $1.57 | 18d | 1 | 0.94mi |
| 10401 Hobkirk Dr Saint Louis, MO | 3.0 | 1.0 | 1050 | $1,500 | $1.43 | 19d | 1 | 0.95mi |
| 1255 Bosworth Dr Saint Louis, MO | 3.0 | 1.0 | 1071 | $1,575 | $1.47 | 13d | 1 | 0.96mi |
| 10309 Galloway Dr Saint Louis, MO | 3.0 | 1.0 | 892 | $1,270 | $1.42 | 1d | 1 | 0.96mi |
| 416 Crawford Rd Saint Louis, MO | 3.0 | 1.0 | 844 | $1,350 | $1.60 | 1d | 1 | 0.98mi |
| 849 River Trail Ct #102 St. Louis, MO | 1.0 | 1.0 | 700 | $825 | $1.18 | 26d | 1 | 0.99mi |
| 849 River Trail Ct Apt 201 St. Louis, MO | 1.0 | 1.0 | 700 | $825 | $1.18 | 46d | 1 | 0.99mi |
| 10200 Tappan Dr Saint Louis, MO | 3.0 | 1.0 | 912 | $1,375 | $1.51 | 1d | 1 | 0.99mi |
| 10200 Tappan Dr Saint Louis, MO | 3.0 | 1.0 | 912 | $1,450 | $1.59 | 18d | 1 | 0.99mi |
| 815 Bella Ln Saint Louis, MO | 3.0 | 1.0 | 864 | $1,275 | $1.48 | 46d | 1 | 1.02mi |
| 960 Raford Ct St. Louis, MO | 2.0 | 1.0 | 750 | $950 | $1.27 | 26d | 1 | 1.04mi |
| 345 Caithness Rd Saint Louis, MO | 3.0 | 1.0 | 854 | $1,195 | $1.40 | 1d | 1 | 1.10mi |
| 743 Shepley Dr Saint Louis, MO | 3.0 | 1.0 | 932 | $1,025 | $1.10 | 10d | 1 | 1.10mi |
| 743 Shepley Dr Saint Louis, MO | 3.0 | 1.0 | 932 | $1,025 | $1.10 | 1d | 1 | 1.10mi |
| 437 Lancashire Rd Saint Louis, MO | 3.0 | 1.0 | 1082 | $1,395 | $1.29 | 46d | 1 | 1.11mi |
| 325 Caithness Rd Saint Louis, MO | 3.0 | 1.0 | 854 | $1,425 | $1.67 | 1d | 1 | 1.13mi |
| 325 Caithness Rd Saint Louis, MO | 3.0 | 1.0 | 854 | $1,425 | $1.67 | 14d | 1 | 1.13mi |
| 325 Caithness Rd Saint Louis, MO | 3.0 | 1.0 | 854 | $1,540 | $1.80 | 46d | 1 | 1.13mi |
| 317 Cameron Rd Saint Louis, MO | 3.0 | 1.0 | 854 | $1,350 | $1.58 | 26d | 1 | 1.13mi |
Listing history 20 events
-
2026-06-22days on market $74,900 Active 52 DOM
-
2026-06-21days on market $74,900 Active 51 DOM
-
2026-06-18days on market $74,900 Active 48 DOM
-
2026-06-17days on market $74,900 Active 47 DOM
-
2026-06-16days on market $74,900 Active 46 DOM
-
2026-06-15days on market $74,900 Active 45 DOM
-
2026-06-13days on market $74,900 Active 43 DOM
-
2026-06-13days on market $74,900 Active 42 DOM
-
2026-06-09days on market $74,900 Active 39 DOM
-
2026-06-08days on market $74,900 Active 38 DOM
-
2026-06-07days on market $74,900 Active 37 DOM
-
2026-06-05days on market $74,900 Active 34 DOM
-
2026-06-03days on market $74,900 Active 33 DOM
-
2026-06-02days on market $74,900 Active 32 DOM
-
2026-06-01days on market $74,900 Active 31 DOM
-
2026-05-31days on market $74,900 Active 30 DOM
-
2026-05-01$74,900 Active 769-char remark
-
2022-10-04soldstatus $3,087,952
-
2000-02-16soldstatus $69,900
-
1991-04-30soldstatus $60,500
ⓘ Source: listings_history table (triggers on properties + properties_extension) + one-shot
backfill from property_details.listing_events for pre-trigger history.
Tax reassessment forecast MO · Resets to sale price
- Current annual tax
- $1,405 · $117/mo
- Projected year-2 tax
- $1,405 · $117/mo
- Expected delta
- $0/yr ($0/mo · 0.0%)
ⓘ Screening estimate from a state-policy table — verify with the county assessor before closing.
Climate risk First Street
- Flood 1/10 Low FEMA zone X (unshaded) · 0% chance over 30 yrs
- Wildfire 1/10 Low
- Heat 5/10 Major 7 d/yr ≥107°F today · 21 d/yr by 30 yrs out
- Wind 2/10 Low 100% chance of damaging wind over 30 yrs
- Air quality 4/10 Moderate 5 unhealthy d/yr today · 6 by 30 yrs out
Nearby sold comps map
Loading sold comps map…
Walkable amenities ~0.75 mi
Loading nearby amenities…
Taxation est. · year 1
- Rental income
- $14,537
- − Mortgage interest
- −$4,196
- − Property taxes
- −$1,405
- − Insurance
- −$374
- − Repairs & maintenance
- −$1,163
- − Management
- −$1,163
- − Depreciation
- −$2,179
- Taxable income
- $4,057
- Est. tax owed @ 24.0%
- −$974
- After-tax cash flow
- $4,018/yr
For passive investors: Depreciation is non-cash, so a rental often shows a tax loss while cash-flowing — sheltering income. Rental losses are passive: they offset passive income freely, and up to $25,000/yr can offset ordinary (W-2) income if you actively participate and your MAGI is under $100k (phasing out to $0 by $150k); unused losses carry forward. On sale, claimed depreciation is recaptured at up to 25%, and gains may owe capital-gains tax (a 1031 exchange can defer both). Figures are a year-1 estimate at your 24.0% rate — not tax advice; consult a CPA.
Schools (NCES district)
- District
- Riverview Gardens
- NCES district ID
- 2926670
- Math proficiency
- 2% ▼ -6.00%
- Reading proficiency
- 9% ▼ -6.00%
- Median HH income
- $32,759
- Composite
- 4.22/100
- National rank
- #10058
- State rank
- #324 of 324 in MO
Livability — Bellefontaine Neighbors
- Score
- 58/100
- State rank
- #592
- US rank
- #20944
Category grades
Schools grade is shown separately in the Schools card above.
Census & demographics
- Census place
- Bellefontaine Neighbors, MO
- County
- Saint Louis County · 888,823 people
- City population
- 19,684
- Metro
- St. Louis, MO-IL
- Population (ZIP)
- 19,684
- Household income
- $43,422
- Rent vs Own
- Severe rent burden
- 1863.0
Population outlook (St. Louis County) Hauer SSP2
- Today (2025)
- 1,025,227 people
- By 2030
- 1,028,023 · +0.3%
- By 2040
- 1,020,940 · -0.4%
- By 2050
- 1,007,280 · -1.8%
- By 2075
- 987,277 · -3.7%
- By 2100
- 921,984 · -10.1%
Race, ethnicity, and origin ACS 2023
- Neighborhood character
- Predominantly Black (82%)
- Race & ethnicity
- Black 82% White 13% Two or more races 3%
- Common ancestry
- Romanian 1% Lithuanian 1% Italian 1%
- Foreign-born
- 1%
Political lean MEDSL · St. Louis
- 2024 margin
- Strong D (+23.4) · D 60.8% · R 37.4% · Other 1.7%
- 2008→2024 swing
- +3.5pp toward D · 2008: 19.9pp · 2024: 23.4pp
- All cycles
- 2024: D+23.4 2020: D+24.0 2016: D+16.2 2012: D+13.7 2008: D+19.9
Not yet ingested
- Civics
- —
Market trends
- HPI YoY
- ▼ -96.70%
- Current HPI
- 130.6765
- Rent YoY
- ▲ 6.59%
- Metro
- St. Louis, MO-IL
- State GDP YoY
- ▲ 1.84%
- F500 in state
- 20
Industry mix (Fortune 500 HQ in MO)
| Industry | F500 HQs | Revenue |
|---|---|---|
| Healthcare | 1 | $163B |
|
||
| Insurance | 1 | $21B |
|
||
| Industrial Technology | 1 | $17B |
|
||
| Retail | 1 | $16B |
|
||
| Industrial Distribution | 1 | $10B |
|
||
| Utilities | 1 | $9B |
|
||
Price history
+23.8% since first listed4 events — show timeline
- 2026-05-01 Listed $74,900 MARIS as Distributed by MLS Grid
- 2022-10-04 Sold (Public Records) $3,087,952 Public Records
- 2000-02-16 Sold (Public Records) $69,900 Public Records
- 1991-04-30 Sold (Public Records) $60,500 Public Records
Property tax history
+6.6%/yrLatest (2022): $1,405 · +0.9% YoY. Source: county tax records.
Cash-flow waterfall
monthlySold comps — $/sqft
last 12 mo · ≤1 miLoading sold comps…