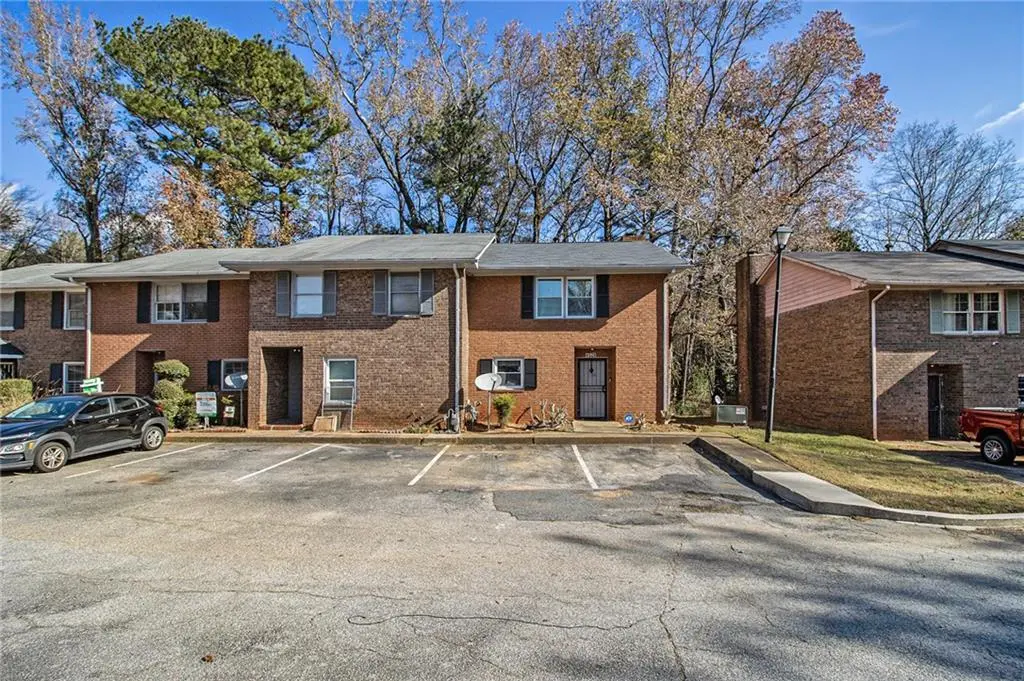
4526 Golf Vista Cir · Stonecrest, GA
Flood risk 1/10 · Minimal
- FEMA flood zone
- X (unshaded)
- Chance of flooding over 30 yrs
- 0.0%
- Est. flood insurance / yr
- $507 – $1,088
Fire risk 1/10 · Minimal
- Est. fire insurance / yr
- $963 – $1,789
Heat risk 6/10 · Moderate
- Hot days now (above 105°F)
- 7 days/yr
- Hot days in 30 yrs
- 17 days/yr
Wind risk 6/10 · Moderate
- Chance of severe wind over 30 yrs
- 27.0%
Air-quality risk 5/10 · Moderate
- Unhealthy air days now
- 7 days/yr
- Unhealthy air days in 30 yrs
- 10 days/yr
Risk factors via First Street. Map © Google.
Why this score? — see what drove the C+ grade
The composite is a weighted blend of 9 inputs, each scored 0–100. Each bar is that input's sub-score; the figure is the points it added to the 100-point composite (weight × sub-score).
- Cash flow +28.1/30.0
- DSCR +10.0/10.0
- ARV discount +8.9/15.0
- 1% rule +7.4/10.0
- Rent growth +2.7/5.0
- Livability +2.5/5.0
- Condition / age +2.5/5.0
- Schools +2.1/10.0
- Appreciation +0.0/10.0
$115,000
🖨 Deal sheet 📄 Offer letter ✓ Due diligence
Listing remarks MLS
Discover this cozy 2-bedroom, 1-bath townhome featuring a warm and inviting atmosphere. Recent updates include a new roof, HVAC system, flooring, carpeting, storm doors, and windows, ensuring peace of mind and energy efficiency. The kitchen boasts stained cabinets and an eat-in area in the family room, perfect for casual meals. Relax in the family room, highlighted by a stylish brick accent wall. Both bedrooms are generously sized, with the primary suite offering private access to a balcony overlooking the backyard. Conveniently located near Snapfinger and Wesley Chapel, with easy access to all major interstates, this home is a perfect blend of comfort and convenience!
Key facts
- Eat-in area
- Brick accent wall
- Stained cabinets
Tags
Neighborhood map
What this means for you Summary
Snapshot
- This is a 1-bed/1.5-bath townhouse listed at $115k.
Deal economics
- At list price, monthly cash flow is $361 ($4k/yr) — positive.
- The deal already cash-flows at list — no discount required.
- Meets the 1% rule at list price ($1k rent vs $115k).
- Recommended offer: $105k (9.0% below list) — sets the bar for market timing.
- Cap rate 10.1% vs local median 5.1% in Stonecrest — top-decile yield for the area; either an underpriced asset or a hidden risk that comps aren't pricing in. Stress-test before assuming the spread holds.
Location & tenants
- Location reads: area grade C — affects rentability + tenant quality, not the cash-flow math above.
- Dekalb County (suburban): math 19% / reading 28% proficiency, ranked #125 of 174 in GA (top 72%) — low school quality limits family demand, transient renter base, plan for 1-2y turnover; 68% free/reduced lunch — lower-income household profile, screen leases tightly.
- Market conditions: Rents flat; 180 active listings in the ZIP; 6 comparable units currently listed for rent nearby; rentals at typical pace (median 24d on market — plan ~3-4 weeks tenant-placement turnaround); 1,240 units permitted in DeKalb County in 2024 (385 in 5+ unit buildings).
Forward outlook
- Local home prices are declining (-3.0%/yr); year-one equity from $795 of loan paydown is wiped out by about $3k of value loss. Plan a longer hold.
- DeKalb County population projected at +28% by 2050 — long-run rental-demand tailwind backs the buy-and-hold thesis.
Negotiation context
- It's been on market 99 days — a 9% lower offer ($105k) is reasonable based on typical stale-listing flexibility.
- 7 sale attempts since 2y ago with the ask held roughly flat each time — persistent listings suggest the price (not the market) is what's stuck; bring a comps-based counter.
- Current owner paid $95k; 21% above their basis — modest negotiation headroom, anchor on the comps not their cost.
Risks & watch-outs
- Climate carrying-cost: major wind risk, 27% chance of damaging wind over 30y; extreme-heat days projected 7→17/yr by 2055 (HVAC capex compounding) — expect insurance premiums to compound above CPI over the hold.
Questions for the listing agent
- It's been on market 99 days. Have you received any prior offers? Is the seller open to a 9% concession, seller financing, or rate buy-down credit?
- What does the HOA fee cover, when was the last increase, and are there any pending special assessments or reserve-fund shortfalls?
- Why hasn't it sold? Are there any deal-killer items the seller is aware of (foundation, flood, title, zoning, code violations)?
- Is there a deadline driving the sale (1031 exchange, divorce, estate, relocation)? That informs how much negotiation room exists.
- What's the average days-on-market for RENTAL listings here right now (not sales)? A rising rental-DOM trend means longer vacancies and softer asking-rent achievability than the comps imply.
- What's the recent tenant-quality profile in this submarket — average credit score on applications, eviction rate, late-payment / NSF rate, and stable-employment percentage? A property-management company in the area should have these aggregated.
- How much new for-sale + rental construction is in the pipeline within 1–3 miles? Heavy new supply typically softens prices + rents 12–24 months out; constrained supply supports both.
Investment metrics
- 1% rule
- 1.24% ✓
- Cap rate
- 10.06%
- Cash-on-cash
- 13.45%
- DSCR
- 1.60
- GRM
- 6.7
CMA / ARV
- ARV (median comp)
- $118,688
- List price
- $115,000
- Delta
- -3.11%
- Verdict
- FAIR
- Comps
- 20 within 1.0 mi
Show comp detail 3 sales within ~0.75 mi
| Address | Dist | Beds/Ba | Sqft | Sold | Price | $/sf | Match |
|---|---|---|---|---|---|---|---|
| 4421 Golf Vista Cir | 0.12mi | 2/1.5 (+1) | 1,268 (0%) | 0mo | $99,000 | $78 | 89 |
| 4485 Golf Vista Cir | 0.08mi | 2/1.5 (+1) | 1,271 (+0%) | 11mo | $101,600 | $80 | 82 |
| 4522 Golf Vista Cir #4522 | 0.01mi | 2/2.5 (+1) | 1,268 (0%) | 19mo | $95,000 | $75 | 75 |
Match score weights: distance 35% · size 25% · config 20% · recency 20%. Top-matched comps best support the ARV.
Projected returns pro-forma
-3.0% appreciation · 0.87% rent growth · sell at horizon
- IRR
- 1.1%
- Equity multiple
- 1.04×
- Total profit
- $1,361
- Equity at exit
- $17,147
- IRR
- 8.6%
- Equity multiple
- 1.59×
- Total profit
- $19,038
- Equity at exit
- $9,943
Cash invested: $32,200 (down + closing). Projections, not guarantees.
Landlord ↔ Tenant lean methodology
- Overall (STATE)
- 90 Strongly Landlord-Friendly
- State Georgia
- 90 Strongly Landlord-Friendly · R+3
- County
- — inherits STATE
- City
- — inherits STATE
ZIP-level market 30035
- Home prices YoY
- -33.8%
- Rents YoY
- 0.9%
- Active inventory
- 180
- Price-to-rent
- 6.7×
Monthly cashflow live
- Estimated rent
- $1,424 high interval (Pro) →
- Mortgage (P&I)
- −$603
- Tax from tax record
- −$53 /mo · $640/yr
- Insurance
- −$48
- HOA
- −$60
- Vacancy / Maint / Mgmt
- −$299
- Net cashflow
- $361
Break-even live
UW: 25.0% down · 7.5% · 30yr · 1.5% tax · 5.0% vac · 8.0% maint · 8.0% mgmt
Financing live
Cash to close
- Down payment
- $28,750
- Closing costs
- $3,450
- Reserves months
- —
- Total cash needed
- —
Loan-product check · same deal, 3 products live
Conventional
25% down · 7.5% · 30yr
- Down + closing
- —
- Monthly P&I
- —
- Monthly cashflow
- —
- DSCR
- —
- Eligible?
- —
Personal DTI + credit; lowest rate.
DSCR
20% down · 8.5% · 30yr
- Down + closing
- —
- Monthly P&I
- —
- Monthly cashflow
- —
- DSCR
- —
- Eligible?
- —
No personal income docs; deal must DSCR.
Hard money
10% down · 12.0% · 12mo
- Down + closing
- —
- Monthly P&I
- —
- Monthly cashflow
- —
- DSCR
- —
- Eligible?
- —
Short-term bridge; refi at stabilization.
Rent comps 6 comps
| Address | Beds | Baths | Sqft | Rent | $/sqft | DOM | Units | Dist |
|---|---|---|---|---|---|---|---|---|
| 10 Friendly Hills Dr Decatur, GA | 2.0 | 2.0 | 994 | $1,534 | $1.54 | 24d | 1 | 0.18mi |
| 4336 Pleasant Point Dr Decatur, GA | 1.0–3.0 | 1.0–2.0 | 1010 | $941 | $0.93 | 1d | 4 | 0.35mi |
| 4225 Wingfoot Ct Decatur, GA | 2.0 | 2.0 | 1120 | $1,600 | $1.43 | 24d | 1 | 0.95mi |
| 4946 Snapfinger Woods Dr Decatur, GA | 1.0–2.0 | 1.0–2.5 | 965 | $913 | $0.95 | 1d | 18 | 1.05mi |
| 4010 Emerald Lake Dr Decatur, GA | 2.0 | 2.0 | 1177 | $1,500 | $1.27 | 43d | 1 | 1.32mi |
| 3122 Northchester Pl Lithonia, GA | 1.0 | 1.0 | 1281 | $1,350 | $1.05 | 43d | 1 | 1.37mi |
HOA detail
- Monthly dues
- $60 · $720/yr
Listing history 31 events
-
2026-06-18days on market $115,000 Active 99 DOM
-
2026-06-17days on market $115,000 Active 98 DOM
-
2026-06-16days on market $115,000 Active 97 DOM
-
2026-06-15days on market $115,000 Active 96 DOM
-
2026-06-13days on market $115,000 Active 94 DOM
-
2026-06-09days on market $115,000 Active 90 DOM
-
2026-06-08days on market $115,000 Active 89 DOM
-
2026-06-07days on market $115,000 Active 88 DOM
-
2026-06-04days on market $115,000 Active 85 DOM
-
2026-06-03days on market $115,000 Active 84 DOM
-
2026-06-02days on market $115,000 Active 83 DOM
-
2026-06-01days on market $115,000 Active 82 DOM
-
2026-05-31days on market $115,000 Active 81 DOM
-
2026-03-10$115,000 New 677-char remark
Show marketing remark (679 chars)
Discover this cozy 2-bedroom, 1.5 bath townhome featuring a warm and inviting atmosphere. Recent updates include a new roof, HVAC system, flooring, carpeting, storm doors, and windows, ensuring peace of mind and energy efficiency. The kitchen boasts stained cabinets and an eat-in area in the family room, perfect for casual meals. Relax in the family room, highlighted by a stylish brick accent wall. Both bedrooms are generously sized, with the primary suite offering private access to a balcony overlooking the backyard. Conveniently located near Snapfinger and Wesley Chapel, with easy access to all major interstates, this home is a perfect blend of comfort and convenience!
-
2026-03-10$115,000 Active 679-char remark
Show marketing remark (679 chars)
Discover this cozy 2-bedroom, 1.5 bath townhome featuring a warm and inviting atmosphere. Recent updates include a new roof, HVAC system, flooring, carpeting, storm doors, and windows, ensuring peace of mind and energy efficiency. The kitchen boasts stained cabinets and an eat-in area in the family room, perfect for casual meals. Relax in the family room, highlighted by a stylish brick accent wall. Both bedrooms are generously sized, with the primary suite offering private access to a balcony overlooking the backyard. Conveniently located near Snapfinger and Wesley Chapel, with easy access to all major interstates, this home is a perfect blend of comfort and convenience!
-
2025-05-12historical
-
2025-05-12historical
-
2025-04-15status Active
-
2025-04-15price $175,000
-
2025-04-15price $175,000
-
2025-03-26status New
-
2025-02-27historical
-
2025-02-24$180,000 New
-
2025-02-24$180,000 Active
-
2024-04-25soldstatus $95,000
-
2024-04-25soldstatus $113,000
-
2024-04-22soldstatus $113,000 Sold
-
2024-03-07price $119,900
-
2024-02-16$125,000 New
-
2022-07-05soldstatus $85,000
-
1992-09-25soldstatus $30,000
ⓘ Source: listings_history table (triggers on properties + properties_extension) + one-shot
backfill from property_details.listing_events for pre-trigger history.
Tax reassessment forecast GA · Resets to sale price
- Current annual tax
- $640 · $53/mo
- Projected year-2 tax
- $1,058 · $88/mo
- Expected delta
- +$418/yr (+$35/mo · 65.3%)
ⓘ Screening estimate from a state-policy table — verify with the county assessor before closing.
Climate risk First Street
- Flood 1/10 Low FEMA zone X (unshaded) · 0% chance over 30 yrs
- Wildfire 1/10 Low
- Heat 6/10 Major 7 d/yr ≥105°F today · 17 d/yr by 30 yrs out
- Wind 6/10 Major 27% chance of damaging wind over 30 yrs
- Air quality 5/10 Major 7 unhealthy d/yr today · 10 by 30 yrs out
Nearby sold comps map
Loading sold comps map…
Walkable amenities ~0.75 mi
Loading nearby amenities…
Taxation est. · year 1
- Rental income
- $17,091
- − Mortgage interest
- −$6,442
- − Property taxes
- −$640
- − Insurance
- −$575
- − Repairs & maintenance
- −$1,367
- − Management
- −$1,367
- − HOA
- −$720
- − Depreciation
- −$3,345
- Taxable income
- $2,634
- Est. tax owed @ 24.0%
- −$632
- After-tax cash flow
- $3,698/yr
For passive investors: Depreciation is non-cash, so a rental often shows a tax loss while cash-flowing — sheltering income. Rental losses are passive: they offset passive income freely, and up to $25,000/yr can offset ordinary (W-2) income if you actively participate and your MAGI is under $100k (phasing out to $0 by $150k); unused losses carry forward. On sale, claimed depreciation is recaptured at up to 25%, and gains may owe capital-gains tax (a 1031 exchange can defer both). Figures are a year-1 estimate at your 24.0% rate — not tax advice; consult a CPA.
Schools (NCES district)
- District
- Dekalb County
- NCES district ID
- 1301740
- Math proficiency
- 19% ▼ -12.00%
- Reading proficiency
- 28% ▼ -7.00%
- Median HH income
- $51,448
- Composite
- 20.92/100
- National rank
- #8482
- State rank
- #125 of 174 in GA
Livability — Stonecrest
No livability data for this city. (Only ~50 U.S. cities are tracked.)
Census & demographics
- County
- Dekalb County · 782,738 people
- City population
- 106,165
- Metro
- Atlanta-Sandy Springs-Alpharetta, GA
- Population (ZIP)
- 21,569
- Household income
- $66,799
- Rent vs Own
- Severe rent burden
- 1304.0
Population outlook (DeKalb County) Hauer SSP2
- Today (2025)
- 839,977 people
- By 2030
- 891,768 · +6.2%
- By 2040
- 988,894 · +17.7%
- By 2050
- 1,074,583 · +27.9%
- By 2075
- 1,245,026 · +48.2%
- By 2100
- 1,303,135 · +55.1%
Race, ethnicity, and origin ACS 2023
- Neighborhood character
- Predominantly Black (91%)
- Race & ethnicity
- Black 91% White 4% Hispanic / Latino 4% Two or more races 3%
- Common ancestry
- Italian 1% Swiss 0%
- Foreign-born
- 12% · Canada, Jamaica
- Languages at home
- 86% English-only · Spanish 4% French/Haitian/Cajun 2%
Political lean MEDSL · DeKalb
- 2024 margin
- Solid D (+64.8) · D 81.9% · R 17.1% · Other 1.0%
- 2008→2024 swing
- +6.1pp toward D · 2008: 58.6pp · 2024: 64.8pp
- All cycles
- 2024: D+64.8 2020: D+67.4 2016: D+64.8 2012: D+56.8 2008: D+58.6
Not yet ingested
- Civics
- —
Market trends
- HPI YoY
- ▼ -111.60%
- Current HPI
- 218.8323
- Rent YoY
- ▲ 0.87%
- Metro
- Atlanta-Sandy Springs-Alpharetta, GA
- State GDP YoY
- ▲ 2.66%
- F500 in state
- 28
Industry mix (Fortune 500 HQ in GA)
| Industry | F500 HQs | Revenue |
|---|---|---|
| Paper / Packaging | 2 | $29B |
|
||
| Retail | 1 | $160B |
|
||
| Transportation / Logistics | 1 | $91B |
|
||
| Airlines | 1 | $62B |
|
||
| Consumer Goods | 1 | $47B |
|
||
| Utilities | 1 | $25B |
|
||
Price history
+283.3% since first listed18 events — show timeline
- 2026-03-10 Listed $115,000 FMLS
- 2026-03-10 Listed $115,000 GAMLS
- 2025-05-12 Listing Removed — FMLS
- 2025-05-12 Listing Removed — GAMLS
- 2025-04-15 Relisted — FMLS
- 2025-04-15 Price Changed $175,000 GAMLS
- 2025-04-15 Price Changed $175,000 FMLS
- 2025-03-26 Relisted — GAMLS
- 2025-02-27 Listing Removed — GAMLS
- 2025-02-24 Listed $180,000 FMLS
- 2025-02-24 Listed $180,000 GAMLS
- 2024-04-25 Sold (Public Records) $113,000 Public Records
- 2024-04-25 Sold (Public Records) $95,000 Public Records
- 2024-04-22 Sold (MLS) $113,000 GAMLS
- 2024-03-07 Price Changed $119,900 GAMLS
- 2024-02-16 Listed $125,000 GAMLS
- 2022-07-05 Sold (Public Records) $85,000 Public Records
- 1992-09-25 Sold (Public Records) $30,000 Public Records
Property tax history
-4.5%/yrLatest (2025): $640 · -66.8% YoY. Source: county tax records.
Cash-flow waterfall
monthlySold comps — $/sqft
last 12 mo · ≤1 miLoading sold comps…