 🏷️ Likely Rental
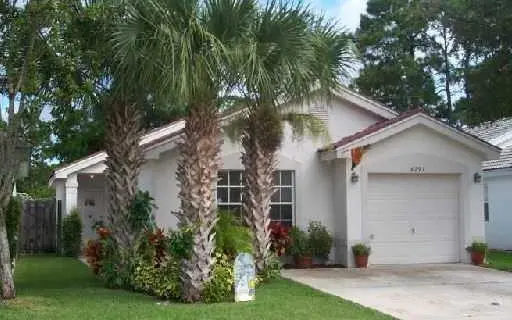
8293 Bermuda Sound Way · Boynton Beach, FL
Flood risk 1/10 · Minimal
- FEMA flood zone
- X (unshaded)
- Chance of flooding over 30 yrs
- 0.0%
- Est. flood insurance / yr
- $507 – $1,088
Fire risk 1/10 · Minimal
- Est. fire insurance / yr
- $947 – $1,759
Heat risk 9/10 · Severe
- Hot days now (above 106°F)
- 6 days/yr
- Hot days in 30 yrs
- 22 days/yr
Wind risk 10/10 · Severe
- Chance of severe wind over 30 yrs
- 99.0%
Air-quality risk 2/10 · Minimal
- Unhealthy air days now
- 0 days/yr
- Unhealthy air days in 30 yrs
- 2 days/yr
Risk factors via First Street. Map © Google.
Why this score? — see what drove the D+ grade
The composite is a weighted blend of 9 inputs, each scored 0–100. Each bar is that input's sub-score; the figure is the points it added to the 100-point composite (weight × sub-score).
- Cash flow +15.0/30.0
- ARV discount +7.5/15.0
- 1% rule +5.0/10.0
- DSCR +5.0/10.0
- Schools +4.3/10.0
- Livability +3.6/5.0
- Condition / age +2.5/5.0
- Rent growth +2.4/5.0
- Appreciation +0.0/10.0
$5,000
🖨 Deal sheet (PDF) 📄 Offer letter ✓ Due diligence
Listing remarks MLS
GORGEOUS IMMACULATE HOME WITH BRAND NEW TILE, GORGEOUS NEW CARPET, CUSTOM PAINT, VAULTED CEILINGS, SPILT BEDROOM PLAN, ALARM SYS, WOOD BLINDS, ABOVE GROUND POOL, BEAUTIFUL CANOPY AND SWING SET IN YARD STAYS. * * SEE MULITUDE OF PICTURES ATTACHED * *
Key facts
- Garage
- Built 1996
- Listed 5 days
Property features AI
Finance
- Other: Directions: I-95 to Gateway, west to Lawrence, north to Nautica Entrance, left at Bermuda, right
Exterior
- Parking: Attached or detached garage with 1 parking space
- Home design: Residential property; Single-story
- Exterior features: Residential zoning; Lot approximately 0.11 acre
Interior
- Bathrooms: 2 full bathrooms
- Interior features: One-story layout
Neighborhood map
What this means for you Summary
Snapshot
- This is a 3-bed/2.0-bath single-family listed at $5k.
Deal economics
- At list price, monthly cash flow is $2k ($25k/yr) — positive.
- The deal already cash-flows at list — no discount required.
- Meets the 1% rule at list price ($3k rent vs $5k).
- Cap rate 507.7% vs local median 4.3% in Boynton Beach — top-decile yield for the area; either an underpriced asset or a hidden risk that comps aren't pricing in. Stress-test before assuming the spread holds.
Location & tenants
- Location reads 72/100 on livability (#351 in FL) — a middle-class / working-renter tenant base. Strengths: housing A+, health & safety B+, cost of living B; Watch: amenities D+, crime D-, commute F.
- Palm Beach (suburban): math 46% / reading 53% proficiency, ranked #34 of 73 in FL (top 47%) — families likely to look elsewhere, expect single-tenant / working-renter base with shorter leases.
- Market conditions: Rents soft (-0.6%/yr); 457 active listings in the ZIP; 32 comparable units currently listed for rent nearby; rentals at typical pace (median 21d on market — plan ~3-4 weeks tenant-placement turnaround); solid renter incomes; 3,974 units permitted in Palm Beach County in 2024 (1,012 in 5+ unit buildings).
- This rent runs 43% of the median local income ($76k/yr) — at the standard rent-burdened threshold; future hikes will face affordability resistance.
Forward outlook
- Local home prices are declining (-3.0%/yr); year-one equity from $35 of loan paydown is wiped out by about $150 of value loss. Plan a longer hold.
- Palm Beach County population projected at +30% by 2050 — long-run rental-demand tailwind backs the buy-and-hold thesis.
- At projected returns (-3.0% appreciation + 0.0% rent growth), your $1k cash investment doubles in ~1 year — after that, you're playing with house money.
Negotiation context
- Only 5 days on market — expect competitive offers; lowballing is unlikely to land.
- 2 sale attempts since 24y ago with the ask held roughly flat each time — persistent listings suggest the price (not the market) is what's stuck; bring a comps-based counter.
Risks & watch-outs
- Climate carrying-cost: severe wind risk, 99% chance of damaging wind over 30y; extreme-heat days projected 6→22/yr by 2055 (HVAC capex compounding) — expect insurance premiums to compound above CPI over the hold.
Questions for the listing agent
- Is there a deadline driving the sale (1031 exchange, divorce, estate, relocation)? That informs how much negotiation room exists.
- Crime grade is D in this area — have there been break-ins, vandalism, or insurance claims at this property in the last 3 years? What carrier currently insures it and at what premium?
- The area grade is low — what's the realistic commute time and amenity access for the typical tenant pool here? Any planned neighborhood developments (good or bad) we should know about?
- What's the average days-on-market for RENTAL listings here right now (not sales)? A rising rental-DOM trend means longer vacancies and softer asking-rent achievability than the comps imply.
- What's the recent tenant-quality profile in this submarket — average credit score on applications, eviction rate, late-payment / NSF rate, and stable-employment percentage? A property-management company in the area should have these aggregated.
- How much new for-sale + rental construction is in the pipeline within 1–3 miles? Heavy new supply typically softens prices + rents 12–24 months out; constrained supply supports both.
Investment metrics
- 1% rule
- 53.77% ✓
- Cap rate
- 507.70%
- Cash-on-cash
- 1790.73%
- DSCR
- 80.68
- GRM
- 0.2
CMA / ARV
- ARV (on-the-fly)
- $432,015
- Comps found
- 1
Show comp detail 1 sale within ~0.75 mi
| Address | Dist | Beds/Ba | Sqft | Sold | Price | $/sf | Match |
|---|---|---|---|---|---|---|---|
| 4853 Purdue Dr | 0.47mi | 3/2.0 | 1,354 (+9%) | 3mo | $470,000 | $347 | 61 |
Match score weights: distance 35% · size 25% · config 20% · recency 20%. Top-matched comps best support the ARV.
Projected returns pro-forma
-3.0% appreciation · 0.0% rent growth · sell at horizon
- IRR
- —
- Equity multiple
- 89.87×
- Total profit
- $124,414
- Equity at exit
- $746
- IRR
- —
- Equity multiple
- 179.14×
- Total profit
- $249,393
- Equity at exit
- $432
Cash invested: $1,400 (down + closing). Projections, not guarantees.
Landlord ↔ Tenant lean methodology
- Overall (STATE)
- 87 Strongly Landlord-Friendly
- State Florida
- 87 Strongly Landlord-Friendly · R+3
- County
- — inherits STATE
- City
- — inherits STATE
ZIP-level market 33436
- Home prices YoY
- -26.0%
- Rents YoY
- -0.6%
- Active inventory
- 457
- Price-to-rent
- 0.2×
Monthly cashflow live
- Estimated rent
- $2,688 high interval (Pro) →
- Mortgage (P&I)
- −$26
- Tax est. 1.5%
- −$6 /mo · $75/yr
- Insurance
- −$2
- HOA
- −$0
- Vacancy / Maint / Mgmt
- −$565
- Net cashflow
- $2,089
Break-even live
Sensitivity live
| Price | -10% $2,093 | -5% $2,091 | +0% $2,089 | +5% $2,087 | +10% $2,086 |
|---|---|---|---|---|---|
| Rent | -10% $1,877 | -5% $1,983 | +0% $2,089 | +5% $2,195 | +10% $2,302 |
| Rate | -1.0pp $2,092 | -0.5pp $2,090 | base $2,089 | +0.5pp $2,088 | +1.0pp $2,087 |
UW: 25.0% down · 7.5% · 30yr · 1.5% tax · 5.0% vac · 8.0% maint · 8.0% mgmt
Financing live
Cash to close
- Down payment
- $1,250
- Closing costs
- $150
- Reserves months
- —
- Total cash needed
- —
Loan-product check · same deal, 3 products live
Conventional
25% down · 7.5% · 30yr
- Down + closing
- —
- Monthly P&I
- —
- Monthly cashflow
- —
- DSCR
- —
- Eligible?
- —
Personal DTI + credit; lowest rate.
DSCR
20% down · 8.5% · 30yr
- Down + closing
- —
- Monthly P&I
- —
- Monthly cashflow
- —
- DSCR
- —
- Eligible?
- —
No personal income docs; deal must DSCR.
Hard money
10% down · 12.0% · 12mo
- Down + closing
- —
- Monthly P&I
- —
- Monthly cashflow
- —
- DSCR
- —
- Eligible?
- —
Short-term bridge; refi at stabilization.
Rent comps 32 comps
| Address | Beds | Baths | Sqft | Rent | $/sqft | DOM | Units | Dist |
|---|---|---|---|---|---|---|---|---|
| 8949 Oak St Boynton Beach, FL | 2.0 | 2.0 | 1040 | $1,300 | $1.25 | 25d | 1 | 0.60mi |
| 4220 Grove Park Ln Unit 1 Boynton Beach, FL | 3.0 | 2.0 | 1406 | $3,600 | $2.56 | 25d | 1 | 0.74mi |
| 4220 Grove Park Ln Unit 1 Boynton Beach, FL | 3.0 | 2.0 | 1406 | $3,400 | $2.42 | 5d | 1 | 0.74mi |
| 7705 Forest Green Ln Boynton Beach, FL | 2.0 | 2.0 | 1379 | $3,200 | $2.32 | 19d | 1 | 0.76mi |
| 7705 Forest Green Ln Boynton Beach, FL | 3.0 | 2.0 | 1379 | $3,200 | $2.32 | 25d | 1 | 0.76mi |
| 3930 Max Pl Boynton Beach, FL | 2.0 | 2.0 | 1250 | $2,370 | $1.90 | 0d | 1 | 0.82mi |
| 5072 Arbor Glen Cir Lake Worth, FL | 3.0 | 2.0 | 1232 | $3,300 | $2.68 | 16d | 1 | 0.85mi |
| 4259 Wood Ride Unit E Boynton Beach, FL | 2.0 | 2.0 | 1240 | $2,350 | $1.90 | 9d | 1 | 0.89mi |
| 3500 Sandpiper Dr Boynton Beach, FL | 1.0–2.0 | 1.0–2.0 | 1147 | $2,579 | $2.25 | 23d | 22 | 0.94mi |
| 1239 Sussex St Boynton Beach, FL | 3.0 | 2.0 | 1436 | $3,100 | $2.16 | 25d | 1 | 0.94mi |
| 1239 Sussex St Boynton Beach, FL | 3.0 | 2.0 | 1436 | $3,100 | $2.16 | 21d | 1 | 0.94mi |
| 920 Sun Acres Ln Boynton Beach, FL | 2.0 | 2.0 | 1352 | $2,200 | $1.63 | 25d | 1 | 0.95mi |
| 3736 Coelebs Ave Boynton Beach, FL | 3.0 | 2.0 | 1232 | $3,000 | $2.44 | 25d | 1 | 1.00mi |
| 7398 Willow Springs Cir E Boynton Beach, FL | 3.0 | 2.0 | 1390 | $2,811 | $2.02 | 0d | 1 | 1.16mi |
| 5537 Pebble Brook Ln Boynton Beach, FL | 3.0 | 2.0 | 1166 | $2,825 | $2.42 | 16d | 1 | 1.17mi |
| 9498 S Military Trl #5 Boynton Beach, FL | 3.0 | 2.5 | 1317 | $2,900 | $2.20 | 25d | 1 | 1.19mi |
| 1515 Arezzo Cir Boynton Beach, FL | 2.0 | 2.5 | 1286 | $2,750 | $2.14 | 25d | 1 | 1.19mi |
| 107 Buttonwood Ln Unit 107 Boynton Beach, FL | 2.0 | 2.5 | 1264 | $2,600 | $2.06 | 25d | 1 | 1.26mi |
| 7132 Colony Club Dr Lake Worth, FL | 1.0–3.0 | 1.0–2.0 | 1087 | $2,919 | $2.69 | 0d | 15 | 1.30mi |
| 220 Savannah Lakes Dr Boynton Beach, FL | 2.0 | 2.0 | 1098 | $2,365 | $2.15 | 4d | 1 | 1.34mi |
| 4101 Mahogany Dr Boynton Beach, FL | 1.0–2.0 | 1.0–2.0 | 950 | $2,159 | $2.27 | 0d | 12 | 1.35mi |
| 2313 N Congress Ave #18 Boynton Beach, FL | 2.0 | 1.0 | 758 | $1,950 | $2.57 | 16d | 1 | 1.36mi |
| 2305 N Congress Ave #18 Boynton Beach, FL | 3.0 | 2.0 | 1217 | $2,600 | $2.14 | 16d | 1 | 1.36mi |
| 2303 N Congress Ave #15 Boynton Beach, FL | 2.0 | 1.0 | 925 | $1,950 | $2.11 | 25d | 1 | 1.36mi |
| 2317 N Congress Ave #24 Boynton Beach, FL | 2.0 | 1.0 | 902 | $2,300 | $2.55 | 6d | 1 | 1.39mi |
| 2307 N Congress Ave #24 Boynton Beach, FL | 2.0 | 1.0 | 902 | $1,700 | $1.88 | 4d | 1 | 1.40mi |
| 5373 Mirror Lakes Blvd Boynton Beach, FL | 3.0 | 2.0 | 1310 | $2,100 | $1.60 | 25d | 1 | 1.41mi |
| 4725 Via Bari Lake Worth, FL | 1.0–3.0 | 1.0–2.0 | 1150 | $2,829 | $2.46 | 4d | 10 | 1.41mi |
| 5155 Europa Dr Unit J Boynton Beach, FL | 3.0 | 2.0 | 1333 | $2,750 | $2.06 | 25d | 1 | 1.41mi |
| 2319 N Congress Ave #28 Boynton Beach, FL | 2.0 | 2.0 | 1172 | $1,945 | $1.66 | 9d | 1 | 1.42mi |
| 2301 N Congress Ave #25 Boynton Beach, FL | 2.0 | 1.0 | 758 | $2,000 | $2.64 | 25d | 1 | 1.42mi |
| 3561 Oberon Ave Boynton Beach, FL | 3.0 | 2.0 | 1248 | $2,850 | $2.28 | 22d | 1 | 1.43mi |
Listing history 6 events
-
2026-05-21$5,000 Active
-
2002-11-18soldstatus $165,000
-
2002-11-06soldstatus $165,000 253-char remark
Show marketing remark (253 chars)
GORGEOUS IMMACULATE HOME WITH BRAND NEW TILE, GORGEOUS NEW CARPET, CUSTOM PAINT, VAULTED CEILINGS, SPILT BEDROOM PLAN, ALARM SYS, WOOD BLINDS, ABOVE GROUND POOL, BEAUTIFUL CANOPY AND SWING SET IN YARD STAYS. * * SEE MULITUDE OF PICTURES ATTACHED * *
-
2002-10-26historical 253-char remark
Show marketing remark (253 chars)
GORGEOUS IMMACULATE HOME WITH BRAND NEW TILE, GORGEOUS NEW CARPET, CUSTOM PAINT, VAULTED CEILINGS, SPILT BEDROOM PLAN, ALARM SYS, WOOD BLINDS, ABOVE GROUND POOL, BEAUTIFUL CANOPY AND SWING SET IN YARD STAYS. * * SEE MULITUDE OF PICTURES ATTACHED * *
-
2002-10-15$169,000 253-char remark
Show marketing remark (253 chars)
GORGEOUS IMMACULATE HOME WITH BRAND NEW TILE, GORGEOUS NEW CARPET, CUSTOM PAINT, VAULTED CEILINGS, SPILT BEDROOM PLAN, ALARM SYS, WOOD BLINDS, ABOVE GROUND POOL, BEAUTIFUL CANOPY AND SWING SET IN YARD STAYS. * * SEE MULITUDE OF PICTURES ATTACHED * *
-
1999-11-18soldstatus $115,000
ⓘ Source: listings_history table (triggers on properties + properties_extension) + one-shot
backfill from property_details.listing_events for pre-trigger history.
Climate risk First Street
- Flood 1/10 Low FEMA zone X (unshaded) · 0% chance over 30 yrs
- Wildfire 1/10 Low
- Heat 9/10 Extreme 6 d/yr ≥106°F today · 22 d/yr by 30 yrs out
- Wind 10/10 Extreme 99% chance of damaging wind over 30 yrs
- Air quality 2/10 Low 0 unhealthy d/yr today · 2 by 30 yrs out
Nearby sold comps map
Loading sold comps map…
Walkable amenities ~0.75 mi
Loading nearby amenities…
Taxation est. · year 1
- Rental income
- $32,259
- − Mortgage interest
- −$280
- − Property taxes
- −$75
- − Insurance
- −$25
- − Repairs & maintenance
- −$2,581
- − Management
- −$2,581
- − Depreciation
- −$145
- Taxable income
- $26,572
- Est. tax owed @ 24.0%
- −$6,377
- After-tax cash flow
- $18,693/yr
For passive investors: Depreciation is non-cash, so a rental often shows a tax loss while cash-flowing — sheltering income. Rental losses are passive: they offset passive income freely, and up to $25,000/yr can offset ordinary (W-2) income if you actively participate and your MAGI is under $100k (phasing out to $0 by $150k); unused losses carry forward. On sale, claimed depreciation is recaptured at up to 25%, and gains may owe capital-gains tax (a 1031 exchange can defer both). Figures are a year-1 estimate at your 24.0% rate — not tax advice; consult a CPA.
Schools (NCES district)
- District
- Palm Beach
- NCES district ID
- 1201500
- Math proficiency
- 46% ▼ -16.00%
- Reading proficiency
- 53% ▼ -4.00%
- Median HH income
- $53,943
- Composite
- 42.72/100
- National rank
- #3160
- State rank
- #34 of 73 in FL
Livability — Boynton Beach
- Score
- 72/100
- State rank
- #351
- US rank
- #6098
Category grades
Schools grade is shown separately in the Schools card above.
Census & demographics
- Census place
- Boynton Beach, FL
- County
- Palm Beach County · 1,438,312 people
- City population
- 148,060
- Metro
- Miami-Fort Lauderdale-Pompano Beach, FL
- Population (ZIP)
- 48,743
- Household income
- $75,789
- Rent vs Own
- Severe rent burden
- 1813.0
Population outlook (Palm Beach County) Hauer SSP2
- Today (2025)
- 1,637,487 people
- By 2030
- 1,743,255 · +6.5%
- By 2040
- 1,948,712 · +19.0%
- By 2050
- 2,132,979 · +30.3%
- By 2075
- 2,530,027 · +54.5%
- By 2100
- 2,706,979 · +65.3%
Race, ethnicity, and origin ACS 2023
- Neighborhood character
- Diverse neighborhood (Simpson 0.64)
- Race & ethnicity
- White 52% Black 24% Hispanic / Latino 19% Two or more races 10% Asian 2%
- Hispanic origin (detail)
- Mexican 2% Puerto Rican 4% Cuban 3% Dominican 1%
- Common ancestry
- Hispanic 12% Romanian 3% Scotch-Irish 2%
- Foreign-born
- 27% · Canada, Jamaica, Vietnam
- Languages at home
- 64% English-only · Spanish 14% French/Haitian/Cajun 13% Other Indo-European 2%
Political lean MEDSL · Palm Beach
- 2024 margin
- Toss-up / Even · D 50.0% · R 49.2%
- 2008→2024 swing
- -22.1pp toward R · 2008: 22.9pp · 2024: 0.8pp
- All cycles
- 2024: D+0.8 2020: D+12.8 2016: D+15.3 2012: D+17.0 2008: D+22.9
Not yet ingested
- Civics
- —
Market trends
- HPI YoY
- ▼ -109.59%
- Current HPI
- 311.7742
- Rent YoY
- ▼ -0.57%
- Metro
- Miami-Fort Lauderdale-Pompano Beach, FL
- State GDP YoY
- ▲ 3.28%
- F500 in state
- 36
Industry mix (Fortune 500 HQ in FL)
| Industry | F500 HQs | Revenue |
|---|---|---|
| Industrial Technology | 2 | $29B |
|
||
| Insurance | 2 | $17B |
|
||
| Retail | 1 | $60B |
|
||
| Technology Distribution | 1 | $58B |
|
||
| Homebuilding | 1 | $35B |
|
||
| Technology Manufacturing | 1 | $35B |
|
||
Price history
-95.7% since first listed6 events — show timeline
- 2026-05-21 Listed $5,000 NFMLS
- 2002-11-18 Sold (Public Records) $165,000 Public Records
- 2002-11-06 Sold (MLS) $165,000 Beaches MLS
- 2002-10-26 Listing Removed — Beaches MLS
- 2002-10-15 Listed $169,000 Beaches MLS
- 1999-11-18 Sold (Public Records) $115,000 Public Records
Property tax history
+9.1%/yrLatest (2025): $7,057 · +7.9% YoY. Source: county tax records.
Cash-flow waterfall
monthlySold comps — $/sqft
last 12 mo · ≤1 miLoading sold comps…