402 Trout St · Logan, NM
Flood risk No data
- FEMA flood zone
- —
- Chance of flooding over 30 yrs
- —
- Est. flood insurance / yr
- —
Fire risk No data
- Est. fire insurance / yr
- —
Heat risk No data
- Hot days now (above threshold)
- —
- Hot days in 30 yrs
- —
Wind risk No data
- Chance of severe wind over 30 yrs
- —
Air-quality risk No data
- Unhealthy air days now
- —
- Unhealthy air days in 30 yrs
- —
Risk factors via First Street. Map © Google.
Why this score? — see what drove the B grade
The composite is a weighted blend of 9 inputs, each scored 0–100. Each bar is that input's sub-score; the figure is the points it added to the 100-point composite (weight × sub-score).
- Cash flow +30.0/30.0
- 1% rule +10.0/10.0
- DSCR +10.0/10.0
- ARV discount +7.5/15.0
- Appreciation +6.2/10.0
- Schools +3.2/10.0
- Livability +3.0/5.0
- Rent growth +2.5/5.0
- Condition / age +2.5/5.0
$44,900
🖨 Deal sheet 📄 Offer letter ✓ Due diligence
Listing remarks
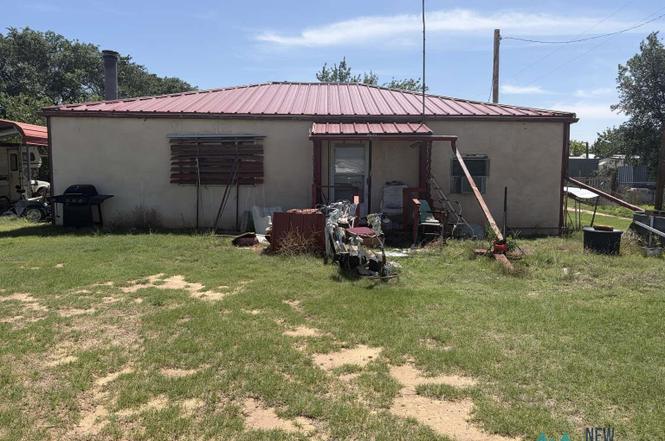
Unlock the potential of this 2-bedroom, 1-bath home situated on a generous lot in Logan, NM. Whether you're looking for your next fix-and-flip project, rental investment, or affordable getaway property near Ute Lake, this property offers a great opportunity to add value and build equity. Featuring approximately 896 square feet of living space on a 0.26-acre lot, the home is ready for your vision and improvements. Conveniently located close to local amenities and outdoor recreation. Property is being sold AS IS. Don't miss this chance to invest in a growing recreational area with strong upside potential!
Key facts
- Built 1980
- Listed 2 days
Property features AI
Finance
- Financial info: Annual property tax approximately $220
Exterior
- Parking: No garage
- Home design: Single-family residential property
- Exterior features: Located at 402 Trout St, Logan, NM
Interior
- Bathrooms: One full bathroom
- Heating & cooling: No heating system
- Interior features: No central heating
Neighborhood map
What this means for you Summary
Snapshot
- This is a 2-bed/1.0-bath single-family listed at $45k.
Deal economics
- At list price, monthly cash flow is $514 ($6k/yr) — positive.
- The deal already cash-flows at list — no discount required.
- Meets the 1% rule at list price ($996 rent vs $45k).
Location & tenants
- Location reads 59/100 on livability (#134 in NM) — a working-class tenant base; expect higher turnover. Strengths: cost of living A+, health & safety A+, crime A; Watch: amenities F, commute F, employment F.
- Logan Municipal Schools (rural): math 24% / reading 47% proficiency, ranked #20 of 95 in NM (top 21%) — families likely to look elsewhere, expect single-tenant / working-renter base with shorter leases.
- Market conditions: 28 active listings in the ZIP.
Forward outlook
- In year one you build about $1k of equity ($310 loan paydown + $1k appreciation (2.5% local appreciation)).
- Quay County population projected at -35% by 2050 — secular population decline; favor cash flow + early exit over multi-decade hold.
- At projected returns (2.5% appreciation + 3.0% rent growth), your $13k cash investment doubles in ~2 years — after that, you're playing with house money.
Negotiation context
- Only 3 days on market — expect competitive offers; lowballing is unlikely to land.
Questions for the listing agent
- Is there a deadline driving the sale (1031 exchange, divorce, estate, relocation)? That informs how much negotiation room exists.
- What's the average days-on-market for RENTAL listings here right now (not sales)? A rising rental-DOM trend means longer vacancies and softer asking-rent achievability than the comps imply.
- What's the recent tenant-quality profile in this submarket — average credit score on applications, eviction rate, late-payment / NSF rate, and stable-employment percentage? A property-management company in the area should have these aggregated.
- How much new for-sale + rental construction is in the pipeline within 1–3 miles? Heavy new supply typically softens prices + rents 12–24 months out; constrained supply supports both.
Investment metrics
- 1% rule
- 2.22% ✓
- Cap rate
- 20.03%
- Cash-on-cash
- 49.07%
- DSCR
- 3.18
- GRM
- 3.8
CMA / ARV
No comps found within radius.
Projected returns pro-forma
2.45% appreciation · 3.0% rent growth · sell at horizon
- IRR
- 53.5%
- Equity multiple
- 3.93×
- Total profit
- $36,842
- Equity at exit
- $18,804
- IRR
- 53.7%
- Equity multiple
- 7.91×
- Total profit
- $86,918
- Equity at exit
- $27,946
Cash invested: $12,572 (down + closing). Projections, not guarantees.
Landlord ↔ Tenant lean methodology
- Overall (STATE)
- 55 Moderately Landlord-Leaning
- State New Mexico
- 55 Moderately Landlord-Leaning · D+3
- County
- — inherits STATE
- City
- — inherits STATE
ZIP-level market 88426
- Home prices YoY
- 1.9%
- Active inventory
- 28
- Price-to-rent
- 3.8×
Monthly cashflow live
- Estimated rent
- $996 medium interval (Pro) →
- Mortgage (P&I)
- −$235
- Tax from tax record
- −$18 /mo · $220/yr
- Insurance
- −$19
- HOA
- −$0
- Vacancy / Maint / Mgmt
- −$209
- Net cashflow
- $514
Break-even live
UW: 25.0% down · 7.5% · 30yr · 1.5% tax · 5.0% vac · 8.0% maint · 8.0% mgmt
Financing live
Cash to close
- Down payment
- $11,225
- Closing costs
- $1,347
- Reserves months
- —
- Total cash needed
- —
Loan-product check · same deal, 3 products live
Conventional
25% down · 7.5% · 30yr
- Down + closing
- —
- Monthly P&I
- —
- Monthly cashflow
- —
- DSCR
- —
- Eligible?
- —
Personal DTI + credit; lowest rate.
DSCR
20% down · 8.5% · 30yr
- Down + closing
- —
- Monthly P&I
- —
- Monthly cashflow
- —
- DSCR
- —
- Eligible?
- —
No personal income docs; deal must DSCR.
Hard money
10% down · 12.0% · 12mo
- Down + closing
- —
- Monthly P&I
- —
- Monthly cashflow
- —
- DSCR
- —
- Eligible?
- —
Short-term bridge; refi at stabilization.
Listing history 4 events
-
2026-06-18days on market $44,900 Active 3 DOM
-
2026-06-17days on market $44,900 Active 2 DOM
-
2026-06-16remarks 610-char remark
-
2026-06-16$44,900 Active 1 DOM
ⓘ Source: listings_history table (triggers on properties + properties_extension) + one-shot
backfill from property_details.listing_events for pre-trigger history.
Tax reassessment forecast NM · Resets to sale price
- Current annual tax
- $220 · $18/mo
- Projected year-2 tax
- $359 · $30/mo
- Expected delta
- +$139/yr (+$12/mo · 62.9%)
ⓘ Screening estimate from a state-policy table — verify with the county assessor before closing.
Nearby sold comps map
Loading sold comps map…
Walkable amenities ~0.75 mi
Loading nearby amenities…
Taxation est. · year 1
- Rental income
- $11,949
- − Mortgage interest
- −$2,515
- − Property taxes
- −$220
- − Insurance
- −$224
- − Repairs & maintenance
- −$956
- − Management
- −$956
- − Depreciation
- −$1,306
- Taxable income
- $5,771
- Est. tax owed @ 24.0%
- −$1,385
- After-tax cash flow
- $4,784/yr
For passive investors: Depreciation is non-cash, so a rental often shows a tax loss while cash-flowing — sheltering income. Rental losses are passive: they offset passive income freely, and up to $25,000/yr can offset ordinary (W-2) income if you actively participate and your MAGI is under $100k (phasing out to $0 by $150k); unused losses carry forward. On sale, claimed depreciation is recaptured at up to 25%, and gains may owe capital-gains tax (a 1031 exchange can defer both). Figures are a year-1 estimate at your 24.0% rate — not tax advice; consult a CPA.
Schools (NCES district)
- District
- Logan Municipal Schools
- NCES district ID
- 3501590
- Math proficiency
- 24% —
- Reading proficiency
- 47% —
- Median HH income
- $35,864
- Composite
- 31.98/100
- National rank
- #11025
- State rank
- #20 of 95 in NM
Livability — Logan
- Score
- 59/100
- State rank
- #134
- US rank
- #20476
Category grades
Schools grade is shown separately in the Schools card above.
Census & demographics
- Census place
- Logan, NM
- Population (ZIP)
- 997
Population outlook (Quay County) Hauer SSP2
- Today (2025)
- 7,255 people
- By 2030
- 6,656 · -8.3%
- By 2040
- 5,560 · -23.4%
- By 2050
- 4,702 · -35.2%
- By 2075
- 3,404 · -53.1%
- By 2100
- 2,593 · -64.3%
Race, ethnicity, and origin ACS 2023
- Neighborhood character
- Predominantly White (78%)
- Race & ethnicity
- White 78% Hispanic / Latino 21% Two or more races 3%
- Hispanic origin (detail)
- Mexican 15%
- Common ancestry
- Romanian 2% Slovak 2% Serbian 1%
- Foreign-born
- 1%
- Languages at home
- 82% English-only · Spanish 18%
Political lean MEDSL · Quay
- 2024 margin
- Solid R (+40.9) · D 28.5% · R 69.4% · Other 2.1%
- 2008→2024 swing
- -20.4pp toward R · 2008: -20.5pp · 2024: -40.9pp
- All cycles
- 2024: R+40.9 2020: R+37.8 2016: R+33.6 2012: R+22.0 2008: R+20.5
Not yet ingested
- Civics
- —
Market trends
- HPI YoY
- ▲ 2.45%
- Current HPI
- 134.4989
- Rent YoY
- —
- Metro
- —
- State GDP YoY
- —
- F500 in state
- 0
Price history
1 event — show timeline
- 2026-06-16 Listed $44,900 NMMLS
Property tax history
+3.5%/yrLatest (2025): $220 · +1.8% YoY. Source: county tax records.
Cash-flow waterfall
monthlySold comps — $/sqft
last 12 mo · ≤1 miLoading sold comps…