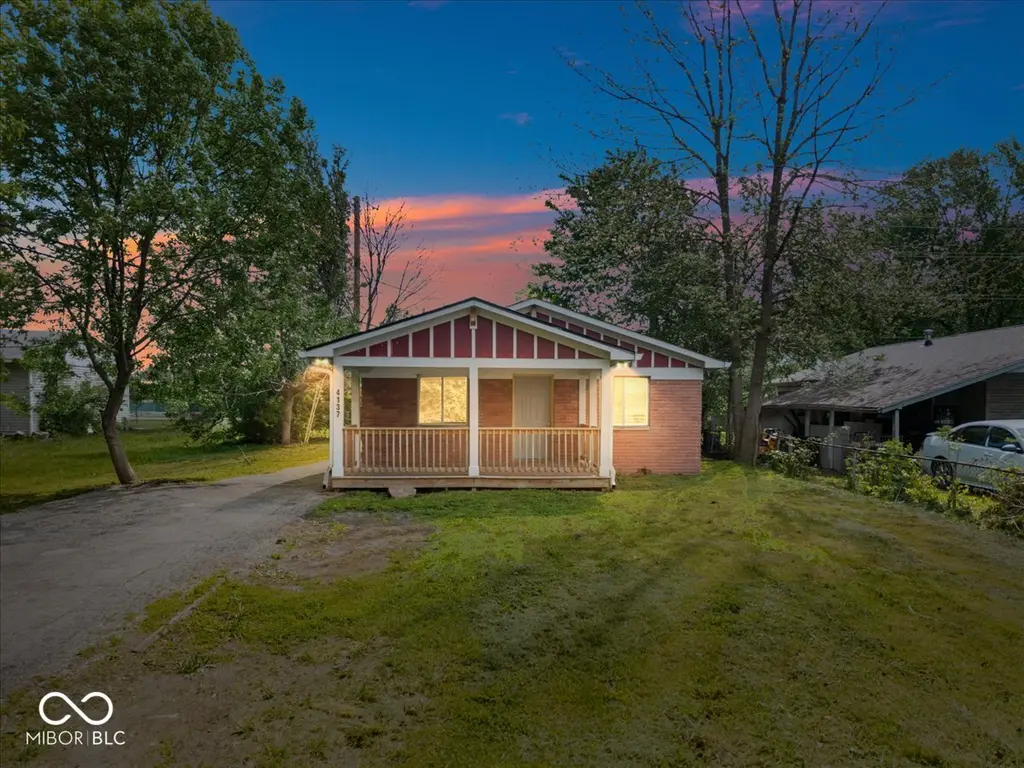
4137 Kenneth Ave · Indianapolis city (balance), IN
Flood risk 1/10 · Minimal
- FEMA flood zone
- X (unshaded)
- Chance of flooding over 30 yrs
- 0.0%
- Est. flood insurance / yr
- $507 – $1,088
Fire risk 1/10 · Minimal
- Est. fire insurance / yr
- $717 – $1,331
Heat risk 3/10 · Minor
- Hot days now (above 101°F)
- 7 days/yr
- Hot days in 30 yrs
- 18 days/yr
Wind risk 2/10 · Minimal
- Chance of severe wind over 30 yrs
- 0.0%
Air-quality risk 3/10 · Minor
- Unhealthy air days now
- 3 days/yr
- Unhealthy air days in 30 yrs
- 4 days/yr
Risk factors via First Street. Map © Google.
Why this score? — see what drove the D grade
The composite is a weighted blend of 9 inputs, each scored 0–100. Each bar is that input's sub-score; the figure is the points it added to the 100-point composite (weight × sub-score).
- Cash flow +14.4/30.0
- ARV discount +8.0/15.0
- DSCR +4.4/10.0
- 1% rule +4.2/10.0
- Rent growth +4.2/5.0
- Livability +2.5/5.0
- Condition / age +2.5/5.0
- Schools +1.4/10.0
- Appreciation +0.0/10.0
$139,900
🖨 Deal sheet (PDF) 📄 Offer letter ✓ Due diligence
Listing remarks MLS
Embrace the potential of this 3-bedroom, 1-bath home in the Devington neighborhood of Indianapolis 46226. With your personal touch, you can transform this residence into a true gem. The interior offers a living area, a functional kitchen, and three cozy bedrooms awaiting your creative updates. This property boasts a generous yard, inviting you to create your own outdoor oasis. Nestled in the Devington community, you'll enjoy proximity to the scenic Devington Park, local schools, and convenient shopping.
Key facts
- Front porch
- Functional layout
- Open flow
Tags
Property features AI
Finance
- Other: Property type: Residential; Lot under 1/4 acre
Exterior
- Utilities: Public water; Municipal sewer connected; Solid waste service available
- Home design: Single-family residence; One story
- Construction: Vinyl with brick and brick exterior; Crawl space foundation
- Exterior features: Storage shed
Interior
- Kitchen: Refrigerator; Electric oven; Microwave; Range hood; Microwave hood
- Bedrooms: Three bedrooms on the main level
- Bathrooms: One full bathroom; One half bathroom
- Heating & cooling: Forced air heating (natural gas); Central air conditioning
- Interior features: Eat-in kitchen; Has a view
- Laundry & utility: Dedicated laundry room; Washer; Dryer
Neighborhood map
What this means for you Summary
Snapshot
- This is a 3-bed/1.5-bath single-family listed at $140k.
Deal economics
- At list price, monthly cash flow is $28 ($335/yr) — positive.
- The deal already cash-flows at list — no discount required.
- To meet the 1% rule (rent ≥ 1% of price), the offer needs to be $129k (8.0% below list).
- Recommended offer: $129k (8.0% below list) — sets the bar for 1% rule.
- Cap rate 6.5% vs local median 4.4% in Indianapolis city (balance) — top-decile yield for the area; either an underpriced asset or a hidden risk that comps aren't pricing in. Stress-test before assuming the spread holds.
Location & tenants
- Location reads: area grade D — affects rentability + tenant quality, not the cash-flow math above.
- Indianapolis Public Schools (urban): math 14% / reading 20% proficiency, ranked #286 of 301 in IN (top 95%) — low school quality limits family demand, transient renter base, plan for 1-2y turnover; 77% free/reduced lunch — lower-income household profile, screen leases tightly.
- Market conditions: Rents rising fast (+6.8%/yr); 151 active listings in the ZIP; 40 comparable units currently listed for rent nearby; rentals at typical pace (median 25d on market — plan ~3-4 weeks tenant-placement turnaround); 48% of comp listings sitting > 30 days — soft ceiling on asking rent; 1,906 units permitted in Marion County in 2024 (621 in 5+ unit buildings).
- This rent runs 31% of the median local income ($50k/yr) — at the standard rent-burdened threshold; future hikes will face affordability resistance.
Forward outlook
- Local home prices are declining (-3.0%/yr); year-one equity from $967 of loan paydown is wiped out by about $4k of value loss. Plan a longer hold.
- Marion County population projected at +18% by 2050 — long-run rental-demand tailwind backs the buy-and-hold thesis.
Negotiation context
- It's been on market 28 days — a 2% lower offer ($138k) is reasonable based on typical stale-listing flexibility.
- 9 sale attempts since 25y ago; this cycle's ask has dropped $15k (10%) from the opening price — seller is motivated, your offer sets the floor, not the list.
- Current owner paid $95k; 47% above their basis — modest negotiation headroom, anchor on the comps not their cost.
Questions for the listing agent
- Built in 1965 — when were the roof, HVAC, electrical panel, plumbing, and water heater last replaced?
- Is there a deadline driving the sale (1031 exchange, divorce, estate, relocation)? That informs how much negotiation room exists.
- The area grade is low — what's the realistic commute time and amenity access for the typical tenant pool here? Any planned neighborhood developments (good or bad) we should know about?
- What's the average days-on-market for RENTAL listings here right now (not sales)? A rising rental-DOM trend means longer vacancies and softer asking-rent achievability than the comps imply.
- What's the recent tenant-quality profile in this submarket — average credit score on applications, eviction rate, late-payment / NSF rate, and stable-employment percentage? A property-management company in the area should have these aggregated.
- How much new for-sale + rental construction is in the pipeline within 1–3 miles? Heavy new supply typically softens prices + rents 12–24 months out; constrained supply supports both.
Investment metrics
- 1% rule
- 0.92% ✗
- Cap rate
- 6.53%
- Cash-on-cash
- 0.85%
- DSCR
- 1.04
- GRM
- 9.1
CMA / ARV
- ARV (on-the-fly)
- $141,480
- Comps found
- 12
Show comp detail 12 sales within ~0.75 mi
| Address | Dist | Beds/Ba | Sqft | Sold | Price | $/sf | Match |
|---|---|---|---|---|---|---|---|
| 4012 N Elizabeth St | 0.28mi | 3/1.0 | 1,074 (-1%) | 6mo | $166,000 | $155 | 80 |
| 4214 N Edmondson Ave | 0.20mi | 3/2.0 | 1,116 (+3%) | 7mo | $155,000 | $139 | 77 |
| 3944 N Elizabeth St | 0.33mi | 3/1.0 | 1,053 (-2%) | 2mo | $118,000 | $112 | 77 |
| 4011 N Kitley Ave | 0.40mi | 3/1.0 | 1,152 (+7%) | 2mo | $107,050 | $93 | 67 |
| 4144 N Edmondson Ave | 0.16mi | 3/2.0 | 1,233 (+14%) | 8mo | $200,000 | $162 | 60 |
| 4443 N Kenyon Dr | 0.60mi | 3/1.0 | 1,160 (+7%) | 1mo | $133,000 | $115 | 57 |
| 6401 E 44th Pl | 0.56mi | 3/1.0 | 1,180 (+9%) | 0mo | $155,000 | $131 | 56 |
| 3910 N Irwin Ave | 0.39mi | 3/2.0 | 1,230 (+14%) | 2mo | $135,000 | $110 | 55 |
| 3808 Elmhurst Dr | 0.48mi | 3/1.0 | 994 (-8%) | 10mo | $104,000 | $105 | 54 |
| 4502 N Kitley Ave | 0.61mi | 3/1.5 | 1,160 (+7%) | 7mo | $135,000 | $116 | 53 |
| 3811 N Sheridan Ave | 0.71mi | 3/1.0 | 1,142 (+6%) | 4mo | $185,000 | $162 | 51 |
| 3945 N Ridgeview Dr | 0.54mi | 3/2.0 | 1,176 (+9%) | 9mo | $177,900 | $151 | 50 |
Match score weights: distance 35% · size 25% · config 20% · recency 20%. Top-matched comps best support the ARV.
Projected returns pro-forma
-3.0% appreciation · 6.76% rent growth · sell at horizon
- IRR
- -10.7%
- Equity multiple
- 0.60×
- Total profit
- $-15,808
- Equity at exit
- $20,860
- IRR
- 3.3%
- Equity multiple
- 1.28×
- Total profit
- $11,059
- Equity at exit
- $12,096
Cash invested: $39,172 (down + closing). Projections, not guarantees.
Landlord ↔ Tenant lean methodology
- Overall (STATE)
- 90 Strongly Landlord-Friendly
- State Indiana
- 90 Strongly Landlord-Friendly · R+11
- County
- — inherits STATE
- City
- — inherits STATE
ZIP-level market 46226
- Rents YoY
- 6.8%
- Active inventory
- 151
- Price-to-rent
- 9.1×
Monthly cashflow live
- Estimated rent
- $1,287 high interval (Pro) →
- Mortgage (P&I)
- −$734
- Tax from tax record
- −$197 /mo · $2,362/yr
- Insurance
- −$58
- HOA
- −$0
- Vacancy / Maint / Mgmt
- −$270
- Net cashflow
- $28
Break-even live
Sensitivity live
| Price | -10% $107 | -5% $67 | +0% $28 | +5% $-12 | +10% $-51 |
|---|---|---|---|---|---|
| Rent | -10% $-74 | -5% $-23 | +0% $28 | +5% $79 | +10% $130 |
| Rate | -1.0pp $98 | -0.5pp $63 | base $28 | +0.5pp $-8 | +1.0pp $-45 |
UW: 25.0% down · 7.5% · 30yr · 1.5% tax · 5.0% vac · 8.0% maint · 8.0% mgmt
Financing live
Cash to close
- Down payment
- $34,975
- Closing costs
- $4,197
- Reserves months
- —
- Total cash needed
- —
Loan-product check · same deal, 3 products live
Conventional
25% down · 7.5% · 30yr
- Down + closing
- —
- Monthly P&I
- —
- Monthly cashflow
- —
- DSCR
- —
- Eligible?
- —
Personal DTI + credit; lowest rate.
DSCR
20% down · 8.5% · 30yr
- Down + closing
- —
- Monthly P&I
- —
- Monthly cashflow
- —
- DSCR
- —
- Eligible?
- —
No personal income docs; deal must DSCR.
Hard money
10% down · 12.0% · 12mo
- Down + closing
- —
- Monthly P&I
- —
- Monthly cashflow
- —
- DSCR
- —
- Eligible?
- —
Short-term bridge; refi at stabilization.
Rent comps 40 comps
| Address | Beds | Baths | Sqft | Rent | $/sqft | DOM | Units | Dist |
|---|---|---|---|---|---|---|---|---|
| 3900 N Shadeland Ave Indianapolis, IN | 1.0–2.0 | 1.0 | 1070 | $1,075 | $1.00 | 3d | 6 | 0.19mi |
| 4307 N Edmondson Ave Indianapolis, IN | 3.0 | 1.0 | 900 | $1,299 | $1.44 | 2d | 1 | 0.28mi |
| 3775 Allerton Pl Indianapolis, IN | 1.0–4.0 | 2.0 | 1068 | $1,617 | $1.51 | 14d | 1 | 0.57mi |
| 6563 E 46th St Indianapolis, IN | 3.0 | 1.5 | 1185 | $1,250 | $1.05 | 5d | 1 | 0.69mi |
| 4511 N Kenmore Rd Indianapolis, IN | 4.0 | 2.0 | 1200 | $2,095 | $1.75 | 5d | 1 | 0.77mi |
| 7171 Twin Oaks Dr Indianapolis, IN | 3.0 | 1.0–1.5 | 801 | $1,399 | $1.75 | 24d | 9 | 0.78mi |
| 4411 Park Forest Ct Indianapolis, IN | 2.0 | 1.0 | 928 | $1,180 | $1.27 | 44d | 1 | 0.80mi |
| 4404 Park Forest Ct Indianapolis, IN | 2.0 | 1.0 | 928 | $1,180 | $1.27 | 22d | 2 | 0.82mi |
| 4437 Park Forest Ct Indianapolis, IN | 2.0 | 1.0 | 928 | $1,180 | $1.27 | 44d | 1 | 0.83mi |
| 4445 Park Forest Ct Indianapolis, IN | 2.0 | 1.0 | 928 | $1,180 | $1.27 | 3d | 1 | 0.84mi |
| 4430 Park Forest Ct Indianapolis, IN | 2.0 | 1.0 | 928 | $1,180 | $1.27 | 44d | 1 | 0.85mi |
| 4521 Park Forest Ct Indianapolis, IN | 2.0 | 1.0 | 700 | $1,180 | $1.69 | 4d | 1 | 0.85mi |
| 4438 Park Forest Ct Indianapolis, IN | 2.0 | 1.0 | 928 | $1,180 | $1.27 | 44d | 1 | 0.86mi |
| 7531 Penway St Indianapolis, IN | 3.0 | 1.5 | 1237 | $1,551 | $1.25 | 8d | 1 | 0.89mi |
| 3912 N Webster Ave Indianapolis, IN | 4.0 | 1.0 | 1274 | $1,350 | $1.06 | 22d | 1 | 0.89mi |
| 4504 Park Forest Ct Indianapolis, IN | 2.0 | 1.0 | 928 | $1,180 | $1.27 | 3d | 1 | 0.89mi |
| 4537 Park Forest Ct Indianapolis, IN | 2.0 | 1.0 | 928 | $1,180 | $1.27 | 44d | 1 | 0.90mi |
| 4545 Park Forest Ct Indianapolis, IN | 2.0 | 1.0 | 928 | $1,180 | $1.27 | 44d | 1 | 0.91mi |
| 4405 Park Forest Ct Indianapolis, IN | 2.0 | 1.0 | 928 | $1,180 | $1.27 | 24d | 1 | 0.92mi |
| 4839 N Kenmore Rd Indianapolis, IN | 3.0 | 2.0 | 1215 | $1,533 | $1.26 | 22d | 1 | 0.97mi |
| 4555 N Arlington Ave Indianapolis, IN | 1.0–3.0 | 1.0–1.5 | 880 | $1,379 | $1.57 | 4d | 30 | 1.03mi |
| 7975 Red Mill Dr Indianapolis, IN | 2.0 | 1.0 | 576 | $975 | $1.69 | 44d | 1 | 1.04mi |
| 7925 Crossbridge Dr Indianapolis, IN | 2.0 | 2.0 | 1072 | $1,200 | $1.12 | 44d | 1 | 1.10mi |
| 3836 Priscilla Ave Indianapolis, IN | 3.0 | 1.5 | 1040 | $1,275 | $1.23 | 2d | 1 | 1.16mi |
| 5865 E 46th St Indianapolis, IN | 3.0 | 2.0 | 1400 | $1,500 | $1.07 | 44d | 1 | 1.19mi |
| 6118 Dickson Rd Apt 3 Indianapolis, IN | 2.0 | 1.0 | 750 | $950 | $1.27 | 44d | 1 | 1.23mi |
| 6049 Dickson Rd Apt 4 Indianapolis, IN | 2.0 | 1.0 | 750 | $950 | $1.27 | 44d | 1 | 1.24mi |
| 6108 Dickson Rd Unit 3 Indianapolis, IN | 2.0 | 1.0 | 750 | $900 | $1.20 | 44d | 1 | 1.24mi |
| 6048 Dickson Rd #3 Indianapolis, IN | 2.0 | 1.0 | 725 | $900 | $1.24 | 44d | 1 | 1.27mi |
| 6111 Laurel Hall Dr #1 Indianapolis, IN | 2.0 | 1.0 | 725 | $950 | $1.31 | 24d | 1 | 1.28mi |
| 6111 Laurel Hall Dr #3 Indianapolis, IN | 2.0 | 1.0 | 725 | $950 | $1.31 | 44d | 1 | 1.28mi |
| 6015 Dickson Rd #1 Indianapolis, IN | 2.0 | 1.0 | 825 | $950 | $1.15 | 44d | 1 | 1.28mi |
| 6005 Dickson Rd Unit 4 Indianapolis, IN | 2.0 | 1.0 | 873 | $725 | $0.83 | 44d | 1 | 1.29mi |
| 5602 Glencoe St Indianapolis, IN | 3.0 | 1.0 | 1000 | $1,749 | $1.75 | 18d | 1 | 1.29mi |
| 6051 Laurel Hall Dr Apt 4 Indianapolis, IN | 2.0 | 1.0 | 750 | $950 | $1.27 | 44d | 1 | 1.30mi |
| 3718 N Audubon Rd Indianapolis, IN | 3.0 | 1.0 | 875 | $1,300 | $1.49 | 24d | 1 | 1.33mi |
| 3513 Roseway Dr Indianapolis, IN | 3.0 | 2.0 | 1216 | $1,600 | $1.32 | 18d | 1 | 1.33mi |
| 6028 Laurel Hall Dr #3 Indianapolis, IN | 2.0 | 1.0 | 875 | $950 | $1.09 | 44d | 1 | 1.36mi |
| 8254 Meadowlark Dr Indianapolis, IN | 3.0 | 1.5 | 1320 | $1,150 | $0.87 | 22d | 1 | 1.38mi |
| 8254 Meadowlark Dr Unit 1 Indianapolis, IN | 3.0 | 1.5 | 1320 | $1,150 | $0.87 | 44d | 1 | 1.38mi |
Listing history 31 events
-
2026-06-18days on market $139,900 Active 28 DOM
-
2026-06-17days on market $139,900 Active 27 DOM
-
2026-06-16days on market $139,900 Active 26 DOM
-
2026-06-15days on market $139,900 Active 25 DOM
-
2026-06-13days on market $139,900 Active 23 DOM
-
2026-06-13pricedays on market $139,900 Active 22 DOM
-
2026-06-09days on market $149,000 Active 19 DOM
-
2026-06-08days on market $149,000 Active 18 DOM
-
2026-06-07days on market $149,000 Active 17 DOM
-
2026-06-03days on market $149,000 Active 13 DOM
-
2026-06-02days on market $149,000 Active 12 DOM
-
2026-06-01days on market $149,000 Active 11 DOM
-
2026-05-31days on market $149,000 Active 10 DOM
-
2026-05-21status Active
-
2026-05-05status Pending
-
2026-05-05$155,000 Active
-
2023-09-08soldstatus $94,900 Closed 508-char remark
Show marketing remark (508 chars)
Embrace the potential of this 3-bedroom, 1-bath home in the Devington neighborhood of Indianapolis 46226. With your personal touch, you can transform this residence into a true gem. The interior offers a living area, a functional kitchen, and three cozy bedrooms awaiting your creative updates. This property boasts a generous yard, inviting you to create your own outdoor oasis. Nestled in the Devington community, you'll enjoy proximity to the scenic Devington Park, local schools, and convenient shopping.
-
2023-08-31status Pending 508-char remark
Show marketing remark (508 chars)
Embrace the potential of this 3-bedroom, 1-bath home in the Devington neighborhood of Indianapolis 46226. With your personal touch, you can transform this residence into a true gem. The interior offers a living area, a functional kitchen, and three cozy bedrooms awaiting your creative updates. This property boasts a generous yard, inviting you to create your own outdoor oasis. Nestled in the Devington community, you'll enjoy proximity to the scenic Devington Park, local schools, and convenient shopping.
-
2023-08-23$94,900 Active 508-char remark
Show marketing remark (508 chars)
Embrace the potential of this 3-bedroom, 1-bath home in the Devington neighborhood of Indianapolis 46226. With your personal touch, you can transform this residence into a true gem. The interior offers a living area, a functional kitchen, and three cozy bedrooms awaiting your creative updates. This property boasts a generous yard, inviting you to create your own outdoor oasis. Nestled in the Devington community, you'll enjoy proximity to the scenic Devington Park, local schools, and convenient shopping.
-
2011-02-10historical
-
2010-11-15$50,000
-
2006-07-21historical
-
2006-03-29$65,900
-
2003-01-29soldstatus $29,900
-
2002-10-01$37,900
-
2002-09-17historical
-
2002-06-17$45,900
-
2001-10-01historical
-
2001-08-20historical
-
2001-03-31$69,900
-
2001-02-20$75,000
ⓘ Source: listings_history table (triggers on properties + properties_extension) + one-shot
backfill from property_details.listing_events for pre-trigger history.
Tax reassessment forecast IN · Partial reset (capped growth)
- Current annual tax
- $2,362 · $197/mo
- Projected year-2 tax
- $2,362 · $197/mo
- Expected delta
- $0/yr ($0/mo · 0.0%)
ⓘ Screening estimate from a state-policy table — verify with the county assessor before closing.
Climate risk First Street
- Flood 1/10 Low FEMA zone X (unshaded) · 0% chance over 30 yrs
- Wildfire 1/10 Low
- Heat 3/10 Moderate 7 d/yr ≥101°F today · 18 d/yr by 30 yrs out
- Wind 2/10 Low 0% chance of damaging wind over 30 yrs
- Air quality 3/10 Moderate 3 unhealthy d/yr today · 4 by 30 yrs out
Nearby sold comps map
Loading sold comps map…
Walkable amenities ~0.75 mi
Loading nearby amenities…
Taxation est. · year 1
- Rental income
- $15,443
- − Mortgage interest
- −$7,837
- − Property taxes
- −$2,362
- − Insurance
- −$700
- − Repairs & maintenance
- −$1,235
- − Management
- −$1,235
- − Depreciation
- −$4,070
- Taxable loss
- −$1,996
- Est. tax savings @ 24.0%
- +$479
- After-tax cash flow
- $814/yr
For passive investors: Depreciation is non-cash, so a rental often shows a tax loss while cash-flowing — sheltering income. Rental losses are passive: they offset passive income freely, and up to $25,000/yr can offset ordinary (W-2) income if you actively participate and your MAGI is under $100k (phasing out to $0 by $150k); unused losses carry forward. On sale, claimed depreciation is recaptured at up to 25%, and gains may owe capital-gains tax (a 1031 exchange can defer both). Figures are a year-1 estimate at your 24.0% rate — not tax advice; consult a CPA.
Schools (NCES district)
- District
- Indianapolis Public Schools
- NCES district ID
- 1804770
- Math proficiency
- 14% ▼ -7.00%
- Reading proficiency
- 20% ▼ -3.00%
- Median HH income
- $32,034
- Composite
- 13.69/100
- National rank
- #9499
- State rank
- #286 of 301 in IN
Livability — Indianapolis city (balance)
No livability data for this city. (Only ~50 U.S. cities are tracked.)
Census & demographics
- Census place
- Indianapolis city (balance), IN
- County
- Marion County · 998,460 people
- City population
- 881,119
- Metro
- Indianapolis-Carmel-Anderson, IN
- Population (ZIP)
- 47,099
- Household income
- $50,325
- Rent vs Own
- Severe rent burden
- 2742.0
Population outlook (Marion County) Hauer SSP2
- Today (2025)
- 1,025,572 people
- By 2030
- 1,065,727 · +3.9%
- By 2040
- 1,141,577 · +11.3%
- By 2050
- 1,208,920 · +17.9%
- By 2075
- 1,367,288 · +33.3%
- By 2100
- 1,438,201 · +40.2%
Race, ethnicity, and origin ACS 2023
- Neighborhood character
- Diverse neighborhood (Simpson 0.62)
- Race & ethnicity
- Black 53% White 25% Hispanic / Latino 17% Two or more races 9% Asian 2%
- Hispanic origin (detail)
- Mexican 11%
- Common ancestry
- Lithuanian 1% Italian 1% Romanian 1%
- Foreign-born
- 11% · Canada
- Languages at home
- 86% English-only · Spanish 10% French/Haitian/Cajun 1% Other Asian/Pacific 1%
Political lean MEDSL · Marion
- 2024 margin
- Strong D (+27.7) · D 63.0% · R 35.3% · Other 1.7%
- 2008→2024 swing
- -0.7pp no change · 2008: 28.4pp · 2024: 27.7pp
- All cycles
- 2024: D+27.7 2020: D+29.1 2016: D+22.8 2012: D+22.2 2008: D+28.4
Not yet ingested
- Civics
- —
Market trends
- HPI YoY
- ▼ -218.85%
- Current HPI
- 239.43
- Rent YoY
- ▲ 6.76%
- Metro
- Indianapolis-Carmel-Anderson, IN
- State GDP YoY
- ▲ 2.90%
- F500 in state
- 18
Industry mix (Fortune 500 HQ in IN)
| Industry | F500 HQs | Revenue |
|---|---|---|
| Industrial Machinery | 2 | $37B |
|
||
| Healthcare | 1 | $177B |
|
||
| Pharmaceuticals | 1 | $45B |
|
||
| Metals / Steel | 1 | $18B |
|
||
| Agriculture | 1 | $17B |
|
||
| Packaging | 1 | $12B |
|
||
Price history
+106.7% since first listed18 events — show timeline
- 2026-05-21 Relisted — MIBOR as Distributed by MLS Grid
- 2026-05-05 Pending — MIBOR as Distributed by MLS Grid
- 2026-05-05 Listed $155,000 MIBOR as Distributed by MLS Grid
- 2023-09-08 Sold (MLS) $94,900 MIBOR as Distributed by MLS Grid
- 2023-08-31 Pending — MIBOR as Distributed by MLS Grid
- 2023-08-23 Listed $94,900 MIBOR as Distributed by MLS Grid
- 2011-02-10 Listing Removed — MIBOR as Distributed by MLS Grid
- 2010-11-15 Listed $50,000 MIBOR as Distributed by MLS Grid
- 2006-07-21 Listing Removed — MIBOR as Distributed by MLS Grid
- 2006-03-29 Listed $65,900 MIBOR as Distributed by MLS Grid
- 2003-01-29 Sold (MLS) $29,900 MIBOR as Distributed by MLS Grid
- 2002-10-01 Listed $37,900 MIBOR as Distributed by MLS Grid
- 2002-09-17 Listing Removed — MIBOR as Distributed by MLS Grid
- 2002-06-17 Listed $45,900 MIBOR as Distributed by MLS Grid
- 2001-10-01 Listing Removed — MIBOR as Distributed by MLS Grid
- 2001-08-20 Listing Removed — MIBOR as Distributed by MLS Grid
- 2001-03-31 Listed $69,900 MIBOR as Distributed by MLS Grid
- 2001-02-20 Listed $75,000 MIBOR as Distributed by MLS Grid
Property tax history
+4.2%/yrLatest (2025): $2,362 · +8.6% YoY. Source: county tax records.
Cash-flow waterfall
monthlySold comps — $/sqft
last 12 mo · ≤1 miLoading sold comps…