6 N Shenorock Dr · Shenorock, NY
Flood risk 1/10 · Minimal
- FEMA flood zone
- X (unshaded)
- Chance of flooding over 30 yrs
- 0.0%
- Est. flood insurance / yr
- $473 – $860
Fire risk 1/10 · Minimal
- Est. fire insurance / yr
- $691 – $1,283
Heat risk 5/10 · Moderate
- Hot days now (above 99°F)
- 7 days/yr
- Hot days in 30 yrs
- 15 days/yr
Wind risk 4/10 · Minor
- Chance of severe wind over 30 yrs
- 23.0%
Air-quality risk 4/10 · Minor
- Unhealthy air days now
- 3 days/yr
- Unhealthy air days in 30 yrs
- 6 days/yr
Risk factors via First Street. Map © Google.
Why this score? — see what drove the D grade
The composite is a weighted blend of 9 inputs, each scored 0–100. Each bar is that input's sub-score; the figure is the points it added to the 100-point composite (weight × sub-score).
- Cash flow +11.0/30.0
- ARV discount +9.6/15.0
- Schools +6.5/10.0
- 1% rule +3.9/10.0
- DSCR +3.2/10.0
- Livability +3.2/5.0
- Rent growth +2.5/5.0
- Condition / age +2.5/5.0
- Appreciation +0.0/10.0
$229,700
🖨 Deal sheet 📄 Offer letter ✓ Due diligence
Listing remarks MLS
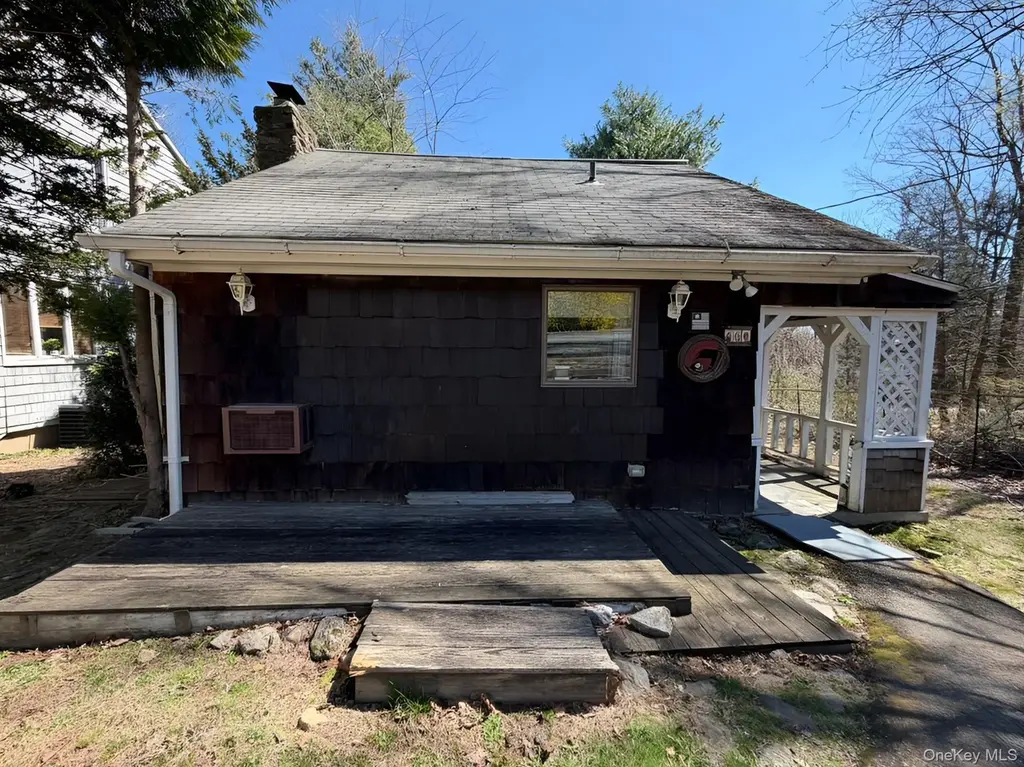
Wonderful opportunity located near Lake Shenorock, featuring a desirable open-concept layout that enhances both comfort and functionality. The property offers convenient off-street parking and a welcoming front porch overlooking the front yard, with easy access to the backyard—ideal for outdoor enjoyment and everyday living. This home presents excellent potential for buyers seeking to add their own personal touches, as it does require some TLC.
Key facts
- Backyard access
- Front porch
- Off-street parking
Tags
Neighborhood map
What this means for you Summary
Snapshot
- This is a 1-bed/1.0-bath single-family listed at $230k.
Deal economics
- At list price, monthly cash flow is $-98 ($-1k/yr) — negative.
- To cash-flow at today's rent, offer at most $212k (7.5% below list).
- To meet the 1% rule (rent ≥ 1% of price), the offer needs to be $205k (10.9% below list).
- Recommended offer: $205k (10.9% below list) — sets the bar for 1% rule.
Location & tenants
- Location reads 64/100 on livability (#739 in NY) — a middle-class / working-renter tenant base. Strengths: crime A+, employment A+, housing A+; Watch: amenities F, commute F, cost of living F.
- Somers Central School District (suburban): math 65% / reading 74% proficiency, ranked #95 of 590 in NY (top 16%) — acceptable for families but not a draw, mixed tenant base, ~2y average lease; only 6% free/reduced lunch — higher-income household profile.
- Market conditions: 160 active listings in the ZIP; 954 units permitted in Westchester County in 2024 (649 in 5+ unit buildings).
Forward outlook
- Local home prices are declining (-3.0%/yr); year-one equity from $2k of loan paydown is wiped out by about $7k of value loss. Plan a longer hold.
- Westchester County population projected at +10% by 2050 — modest demand growth; plan on rents tracking national, not racing it.
Negotiation context
- It's been on market 57 days — a 3% lower offer ($223k) is reasonable based on typical stale-listing flexibility.
Risks & watch-outs
- Watch-outs: built in 1930 — expect roof / HVAC / electrical / plumbing capex.
- Climate carrying-cost: extreme-heat days projected 7→15/yr by 2055 (HVAC capex compounding) — expect insurance premiums to compound above CPI over the hold.
Questions for the listing agent
- What do current leases actually rent for vs. the listed asking? Can we see a recent rent roll and the last 12 months of T-12 income?
- It's been on market 57 days. Have you received any prior offers? Is the seller open to a 11% concession, seller financing, or rate buy-down credit?
- Built in 1930 — when were the roof, HVAC, electrical panel, plumbing, and water heater last replaced?
- Is there a deadline driving the sale (1031 exchange, divorce, estate, relocation)? That informs how much negotiation room exists.
- The area grade is low — what's the realistic commute time and amenity access for the typical tenant pool here? Any planned neighborhood developments (good or bad) we should know about?
- What's the average days-on-market for RENTAL listings here right now (not sales)? A rising rental-DOM trend means longer vacancies and softer asking-rent achievability than the comps imply.
- What's the recent tenant-quality profile in this submarket — average credit score on applications, eviction rate, late-payment / NSF rate, and stable-employment percentage? A property-management company in the area should have these aggregated.
- How much new for-sale + rental construction is in the pipeline within 1–3 miles? Heavy new supply typically softens prices + rents 12–24 months out; constrained supply supports both.
Investment metrics
- 1% rule
- 0.89% ✗
- Cap rate
- 5.78%
- Cash-on-cash
- -1.82%
- DSCR
- 0.92
- GRM
- 9.4
CMA / ARV
- ARV (median comp)
- $240,692
- List price
- $229,700
- Delta
- -4.57%
- Verdict
- FAIR
- Comps
- 2 within 2.0 mi
Projected returns pro-forma
-3.0% appreciation · 3.0% rent growth · sell at horizon
- IRR
- -19.2%
- Equity multiple
- 0.33×
- Total profit
- $-43,330
- Equity at exit
- $34,249
- IRR
- -11.8%
- Equity multiple
- 0.30×
- Total profit
- $-45,293
- Equity at exit
- $19,860
Cash invested: $64,316 (down + closing). Projections, not guarantees.
Landlord ↔ Tenant lean methodology
- Overall (STATE)
- 15 Strongly Tenant-Friendly
- State New York
- 15 Strongly Tenant-Friendly · D+10
- County
- — inherits STATE
- City
- — inherits STATE
ZIP-level market 10598
- Active inventory
- 160
- Price-to-rent
- 9.4×
Monthly cashflow live
- Estimated rent
- $2,047 medium interval (Pro) →
- Mortgage (P&I)
- −$1,205
- Tax from tax record
- −$415 /mo · $4,975/yr
- Insurance
- −$96
- HOA
- −$0
- Vacancy / Maint / Mgmt
- −$430
- Net cashflow
- $-98
Break-even live
UW: 25.0% down · 7.5% · 30yr · 1.5% tax · 5.0% vac · 8.0% maint · 8.0% mgmt
Financing live
Cash to close
- Down payment
- $57,425
- Closing costs
- $6,891
- Reserves months
- —
- Total cash needed
- —
Loan-product check · same deal, 3 products live
Conventional
25% down · 7.5% · 30yr
- Down + closing
- —
- Monthly P&I
- —
- Monthly cashflow
- —
- DSCR
- —
- Eligible?
- —
Personal DTI + credit; lowest rate.
DSCR
20% down · 8.5% · 30yr
- Down + closing
- —
- Monthly P&I
- —
- Monthly cashflow
- —
- DSCR
- —
- Eligible?
- —
No personal income docs; deal must DSCR.
Hard money
10% down · 12.0% · 12mo
- Down + closing
- —
- Monthly P&I
- —
- Monthly cashflow
- —
- DSCR
- —
- Eligible?
- —
Short-term bridge; refi at stabilization.
Listing history 15 events
-
2026-06-18days on market $229,700 Active 57 DOM
-
2026-06-17days on market $229,700 Active 56 DOM
-
2026-06-16days on market $229,700 Active 55 DOM
-
2026-06-15days on market $229,700 Active 54 DOM
-
2026-06-13days on market $229,700 Active 52 DOM
-
2026-06-10price $229,700 Active 48 DOM
-
2026-06-09days on market $270,750 Active 48 DOM
-
2026-06-08days on market $270,750 Active 47 DOM
-
2026-06-07days on market $270,750 Active 46 DOM
-
2026-06-04days on market $270,750 Active 43 DOM
-
2026-06-03days on market $270,750 Active 42 DOM
-
2026-06-02days on market $270,750 Active 41 DOM
-
2026-06-01days on market $270,750 Active 40 DOM
-
2026-05-31days on market $270,750 Active 39 DOM
-
2026-04-21$285,000 Active 454-char remark
Show marketing remark (454 chars)
Wonderful opportunity located near Lake Shenorock, featuring a desirable open-concept layout that enhances both comfort and functionality. The property offers convenient off-street parking and a welcoming front porch overlooking the front yard, with easy access to the backyard—ideal for outdoor enjoyment and everyday living. This home presents excellent potential for buyers seeking to add their own personal touches, as it does require some TLC.
ⓘ Source: listings_history table (triggers on properties + properties_extension) + one-shot
backfill from property_details.listing_events for pre-trigger history.
Tax reassessment forecast NY · Partial reset (capped growth)
- Current annual tax
- $4,975 · $415/mo
- Projected year-2 tax
- $4,975 · $415/mo
- Expected delta
- $0/yr ($0/mo · 0.0%)
ⓘ Screening estimate from a state-policy table — verify with the county assessor before closing.
Climate risk First Street
- Flood 1/10 Low FEMA zone X (unshaded) · 0% chance over 30 yrs
- Wildfire 1/10 Low
- Heat 5/10 Major 7 d/yr ≥99°F today · 15 d/yr by 30 yrs out
- Wind 4/10 Moderate 23% chance of damaging wind over 30 yrs
- Air quality 4/10 Moderate 3 unhealthy d/yr today · 6 by 30 yrs out
Nearby sold comps map
Loading sold comps map…
Walkable amenities ~0.75 mi
Loading nearby amenities…
Taxation est. · year 1
- Rental income
- $24,566
- − Mortgage interest
- −$12,867
- − Property taxes
- −$4,975
- − Insurance
- −$1,148
- − Repairs & maintenance
- −$1,965
- − Management
- −$1,965
- − Depreciation
- −$6,682
- Taxable loss
- −$5,037
- Est. tax savings @ 24.0%
- +$1,209
- After-tax cash flow
- $37/yr
For passive investors: Depreciation is non-cash, so a rental often shows a tax loss while cash-flowing — sheltering income. Rental losses are passive: they offset passive income freely, and up to $25,000/yr can offset ordinary (W-2) income if you actively participate and your MAGI is under $100k (phasing out to $0 by $150k); unused losses carry forward. On sale, claimed depreciation is recaptured at up to 25%, and gains may owe capital-gains tax (a 1031 exchange can defer both). Figures are a year-1 estimate at your 24.0% rate — not tax advice; consult a CPA.
Schools (NCES district)
- District
- Somers Central School District
- NCES district ID
- 3627180
- Math proficiency
- 65% ▼ -3.00%
- Reading proficiency
- 74% ▲ 12.00%
- Median HH income
- $111,661
- Composite
- 64.82/100
- National rank
- #516
- State rank
- #95 of 590 in NY
Livability — Shenorock
- Score
- 64/100
- State rank
- #739
- US rank
- #14073
Category grades
Schools grade is shown separately in the Schools card above.
Census & demographics
- Census place
- Shenorock, NY
- Population (ZIP)
- 28,894
Population outlook (Westchester County) Hauer SSP2
- Today (2025)
- 1,028,035 people
- By 2030
- 1,051,636 · +2.3%
- By 2040
- 1,098,520 · +6.9%
- By 2050
- 1,136,044 · +10.5%
- By 2075
- 1,196,925 · +16.4%
- By 2100
- 1,175,147 · +14.3%
Race, ethnicity, and origin ACS 2023
- Neighborhood character
- Predominantly White (74%)
- Race & ethnicity
- White 74% Hispanic / Latino 14% Two or more races 7% Black 5% Asian 4%
- Hispanic origin (detail)
- Puerto Rican 6% Dominican 2%
- Common ancestry
- Romanian 5% Scotch-Irish 2% Slovak 2%
- Foreign-born
- 12% · Canada, Jamaica, China
- Languages at home
- 82% English-only · Spanish 8% Other Indo-European 5% Other Asian/Pacific 1%
Political lean MEDSL · Westchester
- 2024 margin
- Strong D (+26.3) · D 63.1% · R 36.9%
- 2008→2024 swing
- -1.3pp toward R · 2008: 27.6pp · 2024: 26.3pp
- All cycles
- 2024: D+26.3 2020: D+36.3 2016: D+32.8 2012: D+22.2 2008: D+27.6
Not yet ingested
- Civics
- —
Market trends
- HPI YoY
- ▼ -580.71%
- Current HPI
- 248.9112
- Rent YoY
- —
- Metro
- —
- State GDP YoY
- ▲ 2.60%
- F500 in state
- 92
Industry mix (Fortune 500 HQ in NY)
| Industry | F500 HQs | Revenue |
|---|---|---|
| Financial Services | 10 | $950B |
|
||
| Consumer Goods | 9 | $162B |
|
||
| Insurance | 4 | $225B |
|
||
| Telecommunications | 2 | $144B |
|
||
| Pharmaceuticals | 2 | $112B |
|
||
| Media / Entertainment | 2 | $69B |
|
||
Price history
1 event — show timeline
- 2026-04-21 Listed $285,000 OneKey® MLS as Distributed by MLS Grid
Property tax history
+13.6%/yrLatest (2025): $4,975 · +2.1% YoY. Source: county tax records.
Cash-flow waterfall
monthlySold comps — $/sqft
last 12 mo · ≤1 miLoading sold comps…