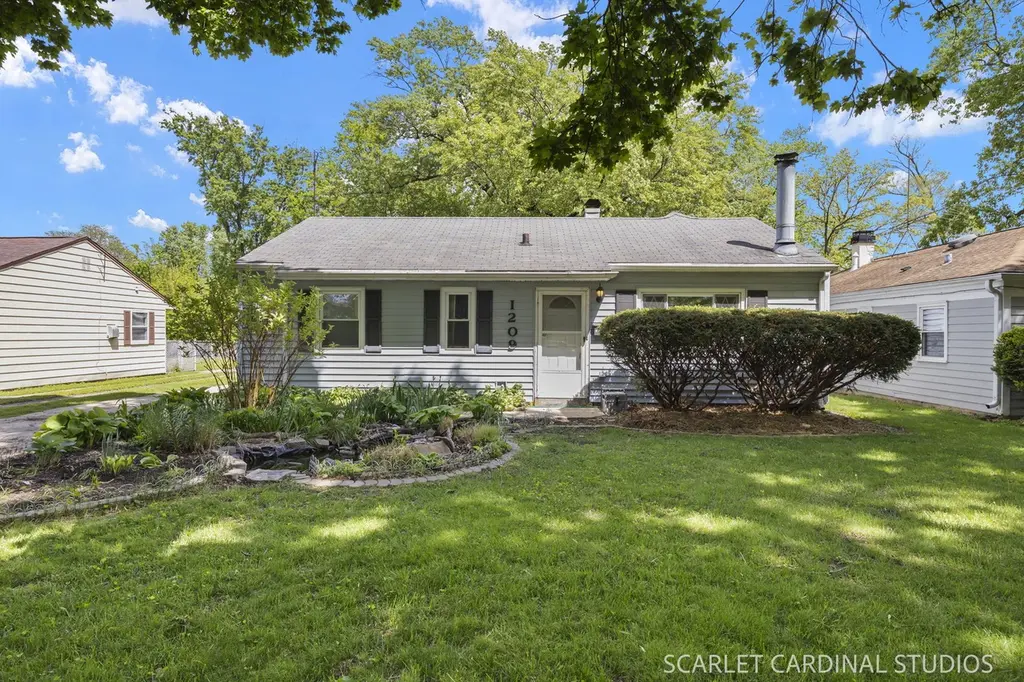
1209 Fischer St · Wheaton, IL
Flood risk 1/10 · Minimal
- FEMA flood zone
- X (unshaded)
- Chance of flooding over 30 yrs
- 0.0%
- Est. flood insurance / yr
- $473 – $860
Fire risk 1/10 · Minimal
- Est. fire insurance / yr
- $804 – $1,492
Heat risk 3/10 · Minor
- Hot days now (above 105°F)
- 7 days/yr
- Hot days in 30 yrs
- 14 days/yr
Wind risk 2/10 · Minimal
- Chance of severe wind over 30 yrs
- 0.0%
Air-quality risk 3/10 · Minor
- Unhealthy air days now
- 4 days/yr
- Unhealthy air days in 30 yrs
- 4 days/yr
Risk factors via First Street. Map © Google.
Why this score? — see what drove the C grade
The composite is a weighted blend of 9 inputs, each scored 0–100. Each bar is that input's sub-score; the figure is the points it added to the 100-point composite (weight × sub-score).
- Cash flow +16.1/30.0
- ARV discount +15.0/15.0
- DSCR +5.0/10.0
- 1% rule +4.8/10.0
- Livability +4.3/5.0
- Schools +4.1/10.0
- Rent growth +3.3/5.0
- Condition / age +2.5/5.0
- Appreciation +0.0/10.0
$274,900
🖨 Deal sheet 📄 Offer letter ✓ Due diligence
Listing remarks
Fixer upper opportunity knocks in sought-after South Wheaton! This 3-bedroom, 1-bath ranch is full of potential! With some extra special work, this little gem will shine after some polishing! With good bones and a functional layout, this home offers the perfect chance to create something truly your own. Living spaces include a living room with a fireplace, an open-concept kitchen that flows into the family room featuring a volume ceiling, a convenient laundry room with utility sink, a full hall bath, and three modest-sized bedrooms. The fenced backyard offers possibilities to be transformed into your own outdoor space, while the 2-car detached garage provides added storage and convenience.
Key facts
- Open concept kitchen
- Fenced backyard
- Detached garage
Tags
Property features AI
Finance
- Other: Lot dimensions approximately 50 x 135 (less than 0.25 acre)
- HOA & community: No master association fee required; Community features include a park
Exterior
- Parking: Detached garage (owned) plus garage owned/owned parking; 2 garage spaces; Concrete driveway; Total parking for 8 vehicles
- Utilities: Lake Michigan water source; Public sewer; Electric with circuit breakers
- Home design: Detached single-family home; One-story; Fee simple ownership; Built approximately 71–80 years ago; Asphalt roof; Concrete perimeter foundation; Vinyl siding
- Construction: Vinyl siding construction; Asphalt roof; Concrete perimeter foundation; Built before 1978
- Exterior features: Deck; Fenced yard; Mature trees; Street is paved with sidewalks; School bus and commuter bus service available
Interior
- Kitchen: Eating area / table space; Range; Microwave; Dishwasher; Refrigerator
- Bedrooms: 3 bedrooms (all on the main level); Master bedroom on the main level
- Flooring: Hardwood in family room and kitchen; Carpet in living room and bedrooms; Ceramic tile in laundry
- Bathrooms: 1 full bathroom (main level)
- Heating & cooling: Natural gas forced-air heating; Window AC units
- Interior features: First-floor bedroom; First-floor full bath; Storm door(s); Screens and window treatments; 6 total rooms; Unfinished attic; Kitchen/dining combo; Ceiling fan(s); Gas water heater; Gas log fireplace in the living room
- Laundry & utility: Main-level laundry with sink; Washer and dryer included
Neighborhood map
What this means for you Summary
Snapshot
- This is a 3-bed/1.0-bath single-family listed at $275k.
Deal economics
- At list price, monthly cash flow is $143 ($2k/yr) — positive.
- The deal already cash-flows at list — no discount required.
- To meet the 1% rule (rent ≥ 1% of price), the offer needs to be $269k (2.1% below list).
- Recommended offer: $269k (2.1% below list) — sets the bar for 1% rule.
- Cap rate 6.9% vs local median 3.7% in Wheaton — top-decile yield for the area; either an underpriced asset or a hidden risk that comps aren't pricing in. Stress-test before assuming the spread holds.
Location & tenants
- Location reads 86/100 on livability (#17 in IL, #374 nationally) — a professional / high-income tenant draw. Strengths: crime A+, commute A+, employment A+; Watch: amenities D+, health & safety D+, cost of living F.
- CUSD 200 (suburban): math 43% / reading 44% proficiency, ranked #78 of 620 in IL (top 13%) — families likely to look elsewhere, expect single-tenant / working-renter base with shorter leases.
- Zoned schools: Lincoln Elem School (math 62% / reading 52%, grade C+, #89 of 2,056 statewide, top 5%, 483 students, 0% FRL); Edison Middle School (math 33% / reading 42%, grade F, #165 of 665 statewide, top 25%, 674 students, 0% FRL); Wheaton Warrenville South H S (math 41% / reading 48%, grade F, #62 of 693 statewide, top 10%, 1,845 students, 0% FRL) — zoned schools average 0% FRL vs 23% district-wide (23 pts lower); this property's tenant base skews higher-income than the district average.
- Market conditions: Rents rising (+3.4%/yr); 51 active listings in the ZIP; 17 comparable units currently listed for rent nearby; rentals leasing fast (median 3d on market — plan ~1-2 weeks tenant-placement turnaround); high-income renter base; 1,378 units permitted in DuPage County in 2024 (594 in 5+ unit buildings).
Forward outlook
- Local home prices are declining (-3.0%/yr); year-one equity from $2k of loan paydown is wiped out by about $8k of value loss. Plan a longer hold.
Negotiation context
- It's been on market 29 days — a 2% lower offer ($271k) is reasonable based on typical stale-listing flexibility.
- Current owner paid $128k; list at $275k implies a 115% gain — meaningful room to come down on a strong offer.
Risks & watch-outs
- Watch-outs: built in 1953 — expect roof / HVAC / electrical / plumbing capex.
Questions for the listing agent
- Built in 1953 — when were the roof, HVAC, electrical panel, plumbing, and water heater last replaced?
- Is there a deadline driving the sale (1031 exchange, divorce, estate, relocation)? That informs how much negotiation room exists.
- Schools are A-rated — typically a magnet for longer-tenancy family renters. What's the average tenant stay here, and is there a school-zone premium baked into asking?
- What's the average days-on-market for RENTAL listings here right now (not sales)? A rising rental-DOM trend means longer vacancies and softer asking-rent achievability than the comps imply.
- What's the recent tenant-quality profile in this submarket — average credit score on applications, eviction rate, late-payment / NSF rate, and stable-employment percentage? A property-management company in the area should have these aggregated.
- How much new for-sale + rental construction is in the pipeline within 1–3 miles? Heavy new supply typically softens prices + rents 12–24 months out; constrained supply supports both.
Investment metrics
- 1% rule
- 0.98% ✗
- Cap rate
- 6.92%
- Cash-on-cash
- 2.23%
- DSCR
- 1.10
- GRM
- 8.5
CMA / ARV
- ARV (on-the-fly)
- $388,619
- Comps found
- 12
Show comp detail 12 sales within ~0.75 mi
| Address | Dist | Beds/Ba | Sqft | Sold | Price | $/sf | Match |
|---|---|---|---|---|---|---|---|
| 1209 Fischer St | 0.00mi | 3/1.0 | 1,133 (0%) | 0mo | $311,000 | $274 | 100 |
| 1020 Pershing Ave | 0.29mi | 3/2.0 | 1,194 (+5%) | 1mo | $416,500 | $349 | 73 |
| 1212 Underwood Ter | 0.29mi | 3/1.0 | 1,184 (+4%) | 8mo | $353,500 | $299 | 72 |
| 1406 E Elm St | 0.42mi | 3/1.5 | 1,199 (+6%) | 1mo | $440,000 | $367 | 68 |
| 1112 E Elm St | 0.24mi | 3/1.5 | 1,218 (+8%) | 15mo | $418,000 | $343 | 62 |
| 1010 E Elm St | 0.18mi | 3/1.5 | 988 (-13%) | 13mo | $350,000 | $354 | 57 |
| 1217 E Evergreen St | 0.54mi | 3/1.5 | 1,096 (-3%) | 14mo | $385,000 | $351 | 56 |
| 306 S Chase St | 0.66mi | 3/1.0 | 1,185 (+5%) | 12mo | $345,000 | $291 | 52 |
| 418 S Williston St | 0.59mi | 2/1.0 (-1) | 1,231 (+9%) | 9mo | $365,000 | $297 | 46 |
| 604 Devonshire Ln | 0.47mi | 4/1.5 (+1) | 1,264 (+12%) | 12mo | $495,000 | $392 | 41 |
| 1408 E Evergreen St | 0.59mi | 3/1.5 | 1,293 (+14%) | 10mo | $390,000 | $302 | 38 |
| 1221 E Illinois St | 0.68mi | 2/1.0 (-1) | 1,265 (+12%) | 15mo | $370,000 | $292 | 32 |
Match score weights: distance 35% · size 25% · config 20% · recency 20%. Top-matched comps best support the ARV.
Projected returns pro-forma
-3.0% appreciation · 3.35% rent growth · sell at horizon
- IRR
- -12.3%
- Equity multiple
- 0.55×
- Total profit
- $-34,410
- Equity at exit
- $40,988
- IRR
- -2.6%
- Equity multiple
- 0.82×
- Total profit
- $-13,950
- Equity at exit
- $23,768
Cash invested: $76,972 (down + closing). Projections, not guarantees.
Landlord ↔ Tenant lean methodology
- Overall (STATE)
- 43 Moderately Tenant-Leaning
- State Illinois
- 43 Moderately Tenant-Leaning · D+7
- County
- — inherits STATE
- City
- — inherits STATE
ZIP-level market 60189
- Rents YoY
- 3.4%
- Active inventory
- 51
- Price-to-rent
- 8.5×
Monthly cashflow live
- Estimated rent
- $2,692 high interval (Pro) →
- Mortgage (P&I)
- −$1,442
- Tax from tax record
- −$428 /mo · $5,130/yr
- Insurance
- −$115
- HOA
- −$0
- Vacancy / Maint / Mgmt
- −$565
- Net cashflow
- $143
Break-even live
UW: 25.0% down · 7.5% · 30yr · 1.5% tax · 5.0% vac · 8.0% maint · 8.0% mgmt
Financing live
Cash to close
- Down payment
- $68,725
- Closing costs
- $8,247
- Reserves months
- —
- Total cash needed
- —
Loan-product check · same deal, 3 products live
Conventional
25% down · 7.5% · 30yr
- Down + closing
- —
- Monthly P&I
- —
- Monthly cashflow
- —
- DSCR
- —
- Eligible?
- —
Personal DTI + credit; lowest rate.
DSCR
20% down · 8.5% · 30yr
- Down + closing
- —
- Monthly P&I
- —
- Monthly cashflow
- —
- DSCR
- —
- Eligible?
- —
No personal income docs; deal must DSCR.
Hard money
10% down · 12.0% · 12mo
- Down + closing
- —
- Monthly P&I
- —
- Monthly cashflow
- —
- DSCR
- —
- Eligible?
- —
Short-term bridge; refi at stabilization.
Rent comps 17 comps
| Address | Beds | Baths | Sqft | Rent | $/sqft | DOM | Units | Dist |
|---|---|---|---|---|---|---|---|---|
| 250 S Naperville Rd Wheaton, IL | 3.0 | 1.0–2.0 | 1061 | $5,058 | $4.77 | 24d | 16 | 0.82mi |
| 250 S Naperville Rd Wheaton, IL | 3.0 | 1.0–2.0 | 1061 | $5,058 | $4.77 | 1d | 12 | 0.82mi |
| 1706 E Liberty Dr Wheaton, IL | 3.0 | 3.0 | 1320 | $3,200 | $2.42 | 22d | 1 | 0.90mi |
| 1750 22nd St Wheaton, IL | 1.0–3.0 | 1.0–2.0 | 873 | $1,802 | $2.06 | 1d | 6 | 0.93mi |
| 121 N Cross St Wheaton, IL | 2.0 | 1.0–2.0 | 831 | $2,887 | $3.47 | 2d | 18 | 0.96mi |
| 1607 Thames Ct Unit D Wheaton, IL | 2.0 | 1.0 | 1056 | $2,150 | $2.04 | 17d | 1 | 1.06mi |
| 1756 Plymouth Ct Unit B Wheaton, IL | 3.0 | 2.0 | 1311 | $2,600 | $1.98 | 2d | 1 | 1.07mi |
| 302 W Liberty Dr Wheaton, IL | 2.0 | 2.0 | 1194 | $2,885 | $2.42 | 2d | 3 | 1.07mi |
| 357 Bloomfield Ln Glen Ellyn, IL | 2.0 | 2.0 | 1213 | $2,100 | $1.73 | 24d | 1 | 1.08mi |
| 357 Bloomfield Ln Glen Ellyn, IL | 2.0 | 2.0 | 1213 | $2,100 | $1.73 | 6d | 1 | 1.08mi |
| 363 Pembroke Ln #3 Glen Ellyn, IL | 2.0 | 2.0 | 1213 | $1,875 | $1.55 | 24d | 1 | 1.18mi |
| 385 Sandhurst Cir #4 Glen Ellyn, IL | 2.0 | 1.0 | 1213 | $2,200 | $1.81 | 1d | 1 | 1.20mi |
| 50 Sterling Cir #201 Wheaton, IL | 3.0 | 2.0 | 1206 | $2,799 | $2.32 | 2d | 1 | 1.29mi |
| 285 Hill Ave Unit 2 Glen Ellyn, IL | 3.0 | 1.0 | 1200 | $3,250 | $2.71 | 7d | 1 | 1.33mi |
| 2 Sterling Cir Wheaton, IL | 1.0–3.0 | 1.0–2.0 | 924 | $3,078 | $3.33 | 1d | 86 | 1.39mi |
| 470 Fawell Blvd #218 Glen Ellyn, IL | 2.0 | 2.0 | 993 | $2,150 | $2.17 | 24d | 1 | 1.43mi |
| 21 N Main St Glen Ellyn, IL | 1.0–2.0 | 1.0 | 850 | $1,595 | $1.88 | 1d | 17 | 1.46mi |
Listing history 11 events
-
2026-06-07statusdays on market $274,900 Pending 29 DOM
-
2026-06-04days on market $274,900 Contingent - Continue to Show 28 DOM
-
2026-06-03days on market $274,900 Contingent - Continue to Show 27 DOM
-
2026-06-02days on market $274,900 Contingent - Continue to Show 26 DOM
-
2026-06-01days on market $274,900 Contingent - Continue to Show 25 DOM
-
2026-05-31days on market $274,900 Contingent - Continue to Show 24 DOM
-
2026-05-12historical Contingent - Continue to Show
-
2026-05-07$274,900 Active
-
1997-12-17soldstatus $128,000
-
1997-09-26soldstatus $128,000
-
1987-08-01soldstatus $79,000
ⓘ Source: listings_history table (triggers on properties + properties_extension) + one-shot
backfill from property_details.listing_events for pre-trigger history.
Tax reassessment forecast IL · Partial reset (capped growth)
- Current annual tax
- $5,130 · $428/mo
- Projected year-2 tax
- $5,685 · $474/mo
- Expected delta
- +$555/yr (+$46/mo · 10.8%)
ⓘ Screening estimate from a state-policy table — verify with the county assessor before closing.
Climate risk First Street
- Flood 1/10 Low FEMA zone X (unshaded) · 0% chance over 30 yrs
- Wildfire 1/10 Low
- Heat 3/10 Moderate 7 d/yr ≥105°F today · 14 d/yr by 30 yrs out
- Wind 2/10 Low 0% chance of damaging wind over 30 yrs
- Air quality 3/10 Moderate 4 unhealthy d/yr today · 4 by 30 yrs out
Nearby sold comps map
Loading sold comps map…
Walkable amenities ~0.75 mi
Loading nearby amenities…
Taxation est. · year 1
- Rental income
- $32,300
- − Mortgage interest
- −$15,399
- − Property taxes
- −$5,130
- − Insurance
- −$1,374
- − Repairs & maintenance
- −$2,584
- − Management
- −$2,584
- − Depreciation
- −$7,997
- Taxable loss
- −$2,768
- Est. tax savings @ 24.0%
- +$664
- After-tax cash flow
- $2,378/yr
For passive investors: Depreciation is non-cash, so a rental often shows a tax loss while cash-flowing — sheltering income. Rental losses are passive: they offset passive income freely, and up to $25,000/yr can offset ordinary (W-2) income if you actively participate and your MAGI is under $100k (phasing out to $0 by $150k); unused losses carry forward. On sale, claimed depreciation is recaptured at up to 25%, and gains may owe capital-gains tax (a 1031 exchange can defer both). Figures are a year-1 estimate at your 24.0% rate — not tax advice; consult a CPA.
Schools (NCES district)
- District
- CUSD 200
- NCES district ID
- 1742180
- Math proficiency
- 43% ▼ -6.00%
- Reading proficiency
- 44% ▼ -8.00%
- Median HH income
- $85,077
- Composite
- 40.75/100
- National rank
- #3653
- State rank
- #78 of 620 in IL
Livability — Wheaton
- Score
- 86/100
- State rank
- #17
- US rank
- #374
Category grades
Schools grade is shown separately in the Schools card above.
Census & demographics
- Census place
- Wheaton, IL
- County
- DuPage County · 904,569 people
- City population
- 59,857
- Metro
- Chicago-Naperville-Elgin, IL-IN-WI
- Population (ZIP)
- 31,042
- Household income
- $128,878
- Rent vs Own
- Severe rent burden
- 484.0
Population outlook (DuPage County) Hauer SSP2
- Today (2025)
- 960,187 people
- By 2030
- 965,850 · +0.6%
- By 2040
- 965,812 · +0.6%
- By 2050
- 954,890 · -0.6%
- By 2075
- 910,185 · -5.2%
- By 2100
- 816,255 · -15.0%
Race, ethnicity, and origin ACS 2023
- Neighborhood character
- Predominantly White (80%)
- Race & ethnicity
- White 80% Two or more races 8% Hispanic / Latino 7% Asian 5% Black 3%
- Hispanic origin (detail)
- Mexican 5%
- Common ancestry
- Romanian 10% Italian 3% Slovak 2%
- Foreign-born
- 11% · Canada, Philippines, China
- Languages at home
- 86% English-only · Spanish 4% Other Indo-European 3% Russian/Polish/Slavic 2%
Political lean MEDSL · DuPage
- 2024 margin
- D (+13.3) · D 55.9% · R 42.5% · Other 1.6%
- 2008→2024 swing
- +2.5pp toward D · 2008: 10.8pp · 2024: 13.3pp
- All cycles
- 2024: D+13.3 2020: D+18.1 2016: D+14.1 2012: D+1.0 2008: D+10.8
Not yet ingested
- Civics
- —
Market trends
- HPI YoY
- ▼ -254.37%
- Current HPI
- 212.2464
- Rent YoY
- ▲ 3.35%
- Metro
- Chicago-Naperville-Elgin, IL-IN-WI
- State GDP YoY
- ▲ 1.59%
- F500 in state
- 60
Industry mix (Fortune 500 HQ in IL)
| Industry | F500 HQs | Revenue |
|---|---|---|
| Insurance | 4 | $201B |
|
||
| Consumer Goods | 4 | $87B |
|
||
| Industrial Machinery | 3 | $64B |
|
||
| Healthcare | 2 | $55B |
|
||
| Retail / Pharmacy | 1 | $148B |
|
||
| Agriculture / Food | 1 | $86B |
|
||
Price history
+248.0% since first listed5 events — show timeline
- 2026-05-12 Contingent — MRED as Distributed by MLS Grid
- 2026-05-07 Listed $274,900 MRED as Distributed by MLS Grid
- 1997-12-17 Sold (Public Records) $128,000 Public Records
- 1997-09-26 Sold (Public Records) $128,000 Public Records
- 1987-08-01 Sold (Public Records) $79,000 Public Records
Property tax history
+1.5%/yrLatest (2024): $5,130 · +4.5% YoY. Source: county tax records.
Cash-flow waterfall
monthlySold comps — $/sqft
last 12 mo · ≤1 miLoading sold comps…