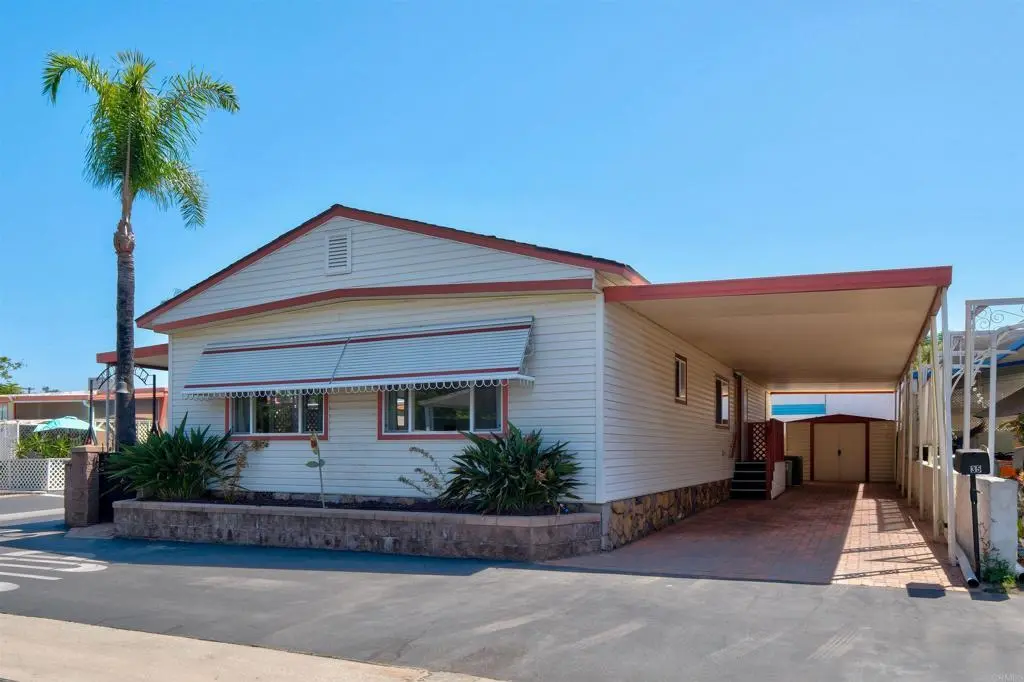
1351 Pepper Dr #35 · Bostonia, CA
Flood risk 1/10 · Minimal
- FEMA flood zone
- X (unshaded)
- Chance of flooding over 30 yrs
- 0.0%
- Est. flood insurance / yr
- $507 – $1,088
Fire risk 3/10 · Minor
- Est. fire insurance / yr
- $659 – $1,223
Heat risk 5/10 · Moderate
- Hot days now (above 98°F)
- 5 days/yr
- Hot days in 30 yrs
- 14 days/yr
Wind risk 1/10 · Minimal
- Chance of severe wind over 30 yrs
- —
Air-quality risk 4/10 · Minor
- Unhealthy air days now
- 6 days/yr
- Unhealthy air days in 30 yrs
- 7 days/yr
Risk factors via First Street. Map © Google.
Why this score? — see what drove the C- grade
The composite is a weighted blend of 9 inputs, each scored 0–100. Each bar is that input's sub-score; the figure is the points it added to the 100-point composite (weight × sub-score).
- Cash flow +17.9/30.0
- ARV discount +11.1/15.0
- 1% rule +7.6/10.0
- DSCR +5.6/10.0
- Schools +4.0/10.0
- Livability +3.2/5.0
- Condition / age +2.5/5.0
- Rent growth +2.3/5.0
- Appreciation +0.0/10.0
$215,000
🖨 Deal sheet 📄 Offer letter ✓ Due diligence
Listing remarks
Welcome home to this charming 2-bedroom, 2-bath, 1,416 sq ft residence nestled in a small, well-maintained, gated, resident-owned senior community. Enjoy some of the lowest space rent around at just $630.33 per month. Inside, you’ll find beautiful natural wood cabinetry and floors, a spacious kitchen, and multiple living areas including a living room, dining room, and family room—perfect for both everyday comfort and entertaining. Ceiling fans in every room and a generously sized primary bedroom add to the home’s appeal. Paid solar panels provide energy efficiency and long-term savings. Step outside to enjoy a cozy brick side yard, ideal for relaxing or hosting guests. Add
Key facts
- Paid solar panels
- Brick side yard
- Refreshing pool
Tags
Property features AI
Finance
- Financial info: Land lease applies with amount $631
- HOA & community: Part of Royal View Gardens association; Monthly association fee of $631; Senior community; Manager approval required for tenancy; Pets allowed with size and number limits; Community features include a dog park
Exterior
- Parking: 2 total parking spaces; 2 carport spaces; Located in Royal View Gardens park
- Utilities: Public sewer
- Home design: Single-story mobile/home model Shelby; Mobile home remains; Entry level: 1; Facing/position: corner placement in the park
- Construction: Composition roof; Single-story
- Exterior features: Covered patio; Community pool; Block wall and partial fencing; Corner lot; Level with street; 1 shed; Has a view
Interior
- Kitchen: Dishwasher; Garbage disposal; Gas range; Microwave; Refrigerator
- Bedrooms: All bedrooms are on the first level
- Flooring: Tile; Carpet; Wood
- Bathrooms: 2 full bathrooms
- Heating & cooling: Central heating (central furnace); Central air conditioning
- Interior features: All bedrooms on main level; One-level entry; Entry from carport house door; Covered patio
- Laundry & utility: Washer included; Dryer included; Gas dryer hookup; Laundry in closet
Neighborhood map
What this means for you Summary
Snapshot
- This is a 2-bed/2.0-bath manufactured listed at $215k.
Deal economics
- At list price, monthly cash flow is $181 ($2k/yr) — positive.
- The deal already cash-flows at list — no discount required.
- Meets the 1% rule at list price ($3k rent vs $215k).
- Recommended offer: $209k (3.0% below list) — sets the bar for market timing.
- Cap rate 7.3% vs local median 6.0% in Bostonia — meaningfully above typical; check what's discounted (condition, days-on-market, listing class) to confirm the premium yield is real.
Location & tenants
- Location reads 65/100 on livability (#383 in CA) — a middle-class / working-renter tenant base. Strengths: commute A+, housing B+; Watch: crime F, amenities F, cost of living F.
- Grossmont Union High (suburban): math 31% / reading 60% proficiency, ranked #173 of 517 in CA (top 34%) — families likely to look elsewhere, expect single-tenant / working-renter base with shorter leases; only 17% free/reduced lunch — higher-income household profile.
- Zoned schools: El Cajon Valley High (math 22% / reading 45%, grade F, #656 of 1,170 statewide, top 57%, 1,652 students, 91% FRL) — zoned schools average 91% FRL vs 17% district-wide (74 pts higher); higher-poverty schools than district average — tighter screening recommended.
- Zoned-school proficiency averages 34% at this address vs 46% district-wide (-12 pts) — the specific schools serving this property underperform the Grossmont Union High average; the district grade overstates school quality for this exact location.
- Market conditions: Rents soft (-0.8%/yr); 238 active listings in the ZIP; 17 comparable units currently listed for rent nearby; rentals leasing fast (median 2d on market — plan ~1-2 weeks tenant-placement turnaround); 11,759 units permitted in San Diego County in 2024 (7,244 in 5+ unit buildings).
- This rent runs 44% of the median local income ($74k/yr) — at the standard rent-burdened threshold; future hikes will face affordability resistance.
Forward outlook
- Local home prices are declining (-3.0%/yr); year-one equity from $1k of loan paydown is wiped out by about $6k of value loss. Plan a longer hold.
- San Diego County population projected at +20% by 2050 — long-run rental-demand tailwind backs the buy-and-hold thesis.
Negotiation context
- It's been on market 57 days — a 3% lower offer ($209k) is reasonable based on typical stale-listing flexibility.
Risks & watch-outs
- Watch-outs: HOA is 23% of rent.
- Climate carrying-cost: extreme-heat days projected 5→14/yr by 2055 (HVAC capex compounding) — expect insurance premiums to compound above CPI over the hold.
Questions for the listing agent
- It's been on market 57 days. Have you received any prior offers? Is the seller open to a 3% concession, seller financing, or rate buy-down credit?
- Built in 1972 — when were the roof, HVAC, electrical panel, plumbing, and water heater last replaced?
- What does the HOA fee cover, when was the last increase, and are there any pending special assessments or reserve-fund shortfalls?
- Is there a deadline driving the sale (1031 exchange, divorce, estate, relocation)? That informs how much negotiation room exists.
- Schools are D-rated, which usually means shorter tenancies and higher turnover. Who's the typical renter profile here, and what's been the actual vacancy rate?
- Crime grade is F in this area — have there been break-ins, vandalism, or insurance claims at this property in the last 3 years? What carrier currently insures it and at what premium?
- What's the average days-on-market for RENTAL listings here right now (not sales)? A rising rental-DOM trend means longer vacancies and softer asking-rent achievability than the comps imply.
- What's the recent tenant-quality profile in this submarket — average credit score on applications, eviction rate, late-payment / NSF rate, and stable-employment percentage? A property-management company in the area should have these aggregated.
- How much new for-sale + rental construction is in the pipeline within 1–3 miles? Heavy new supply typically softens prices + rents 12–24 months out; constrained supply supports both.
Investment metrics
- 1% rule
- 1.26% ✓
- Cap rate
- 7.30%
- Cash-on-cash
- 3.61%
- DSCR
- 1.16
- GRM
- 6.6
CMA / ARV
- ARV (on-the-fly)
- $233,640
- Comps found
- 12
Show comp detail 12 sales within ~0.75 mi
| Address | Dist | Beds/Ba | Sqft | Sold | Price | $/sf | Match |
|---|---|---|---|---|---|---|---|
| 1351 Pepper Dr Spc 41 | 0.00mi | 2/2.0 | 1,400 (-1%) | 8mo | $235,000 | $168 | 91 |
| 1315 Pepper Dr #67 | 0.06mi | 3/2.0 (+1) | 1,440 (+2%) | 3mo | $145,000 | $101 | 87 |
| 1120 Pepper Dr #17 | 0.57mi | 2/2.0 | 1,440 (+2%) | 4mo | $125,000 | $87 | 67 |
| 1315 Pepper Dr #72 | 0.06mi | 2/2.0 | 1,220 (-14%) | 10mo | $194,000 | $159 | 65 |
| 8128 Royal Park Ln | 0.45mi | 2/2.0 | 1,368 (-3%) | 12mo | $150,000 | $110 | 63 |
| 1120 Pepper Dr #78 | 0.66mi | 2/2.0 | 1,368 (-3%) | 10mo | $300,000 | $219 | 56 |
| 12044 Royal Rd #120 | 0.38mi | 3/2.0 (+1) | 1,325 (-6%) | 14mo | $219,000 | $165 | 55 |
| 1120 Pepper Dr #79 | 0.57mi | 3/2.0 (+1) | 1,344 (-5%) | 6mo | $310,000 | $231 | 55 |
| 12250 Vista Del Cajon Rd Spc 25 | 0.66mi | 2/2.0 | 1,275 (-10%) | 1mo | $235,000 | $184 | 52 |
| 1120 Pepper Dr #121 | 0.57mi | 2/2.0 | 1,534 (+8%) | 14mo | $240,000 | $156 | 48 |
| 12250 Vista Del Cajon Rd Spc 45 | 0.66mi | 3/2.0 (+1) | 1,248 (-12%) | 14mo | $183,000 | $147 | 33 |
| 12250 Vista Del Cajon Rd #17 | 0.67mi | 3/2.0 (+1) | 1,248 (-12%) | 14mo | $275,000 | $220 | 32 |
Match score weights: distance 35% · size 25% · config 20% · recency 20%. Top-matched comps best support the ARV.
Projected returns pro-forma
-3.0% appreciation · 0.0% rent growth · sell at horizon
- IRR
- -14.9%
- Equity multiple
- 0.49×
- Total profit
- $-30,931
- Equity at exit
- $32,057
- IRR
- -14.6%
- Equity multiple
- 0.31×
- Total profit
- $-41,449
- Equity at exit
- $18,589
Cash invested: $60,200 (down + closing). Projections, not guarantees.
Landlord ↔ Tenant lean methodology
- Overall (STATE)
- 18 Strongly Tenant-Friendly
- State California
- 18 Strongly Tenant-Friendly · D+13
- County
- — inherits STATE
- City
- — inherits STATE
ZIP-level market 92021
- Rents YoY
- -0.8%
- Active inventory
- 238
- Price-to-rent
- 6.6×
Monthly cashflow live
- Estimated rent
- $2,711 high interval (Pro) →
- Mortgage (P&I)
- −$1,127
- Tax from tax record
- −$112 /mo · $1,349/yr
- Insurance
- −$90
- HOA
- −$631
- Vacancy / Maint / Mgmt
- −$569
- Net cashflow
- $181
Break-even live
UW: 25.0% down · 7.5% · 30yr · 1.5% tax · 5.0% vac · 8.0% maint · 8.0% mgmt
Financing live
Cash to close
- Down payment
- $53,750
- Closing costs
- $6,450
- Reserves months
- —
- Total cash needed
- —
Loan-product check · same deal, 3 products live
Conventional
25% down · 7.5% · 30yr
- Down + closing
- —
- Monthly P&I
- —
- Monthly cashflow
- —
- DSCR
- —
- Eligible?
- —
Personal DTI + credit; lowest rate.
DSCR
20% down · 8.5% · 30yr
- Down + closing
- —
- Monthly P&I
- —
- Monthly cashflow
- —
- DSCR
- —
- Eligible?
- —
No personal income docs; deal must DSCR.
Hard money
10% down · 12.0% · 12mo
- Down + closing
- —
- Monthly P&I
- —
- Monthly cashflow
- —
- DSCR
- —
- Eligible?
- —
Short-term bridge; refi at stabilization.
Rent comps 17 comps
| Address | Beds | Baths | Sqft | Rent | $/sqft | DOM | Units | Dist |
|---|---|---|---|---|---|---|---|---|
| 8031 Winter Gardens Blvd El Cajon, CA | 3.0 | 2.0 | 1124 | $2,995 | $2.66 | 1d | 1 | 0.28mi |
| 1221 Oro St El Cajon, CA | 2.0 | 1.5 | 1020 | $2,575 | $2.52 | 1d | 1 | 0.67mi |
| 8424 Pueblo Rd Unit 8424 Lakeside, CA | 3.0 | 1.0 | 1000 | $2,750 | $2.75 | 1d | 1 | 0.70mi |
| 1365 Broadway El Cajon, CA | 3.0 | 2.0 | 1000 | $3,478 | $3.48 | 1d | 1 | 0.81mi |
| 1314 5 D Dr Unit 1318 El Cajon, CA | 3.0 | 1.0 | 960 | $2,600 | $2.71 | 23d | 1 | 0.92mi |
| 1696 Buckeye Dr El Cajon, CA | 3.0 | 1.0 | 942 | $2,900 | $3.08 | 1d | 1 | 0.96mi |
| 816 Oro St El Cajon, CA | 3.0 | 1.0 | 1235 | $3,400 | $2.75 | 2d | 1 | 1.04mi |
| 2000 E Main St El Cajon, CA | 3.0 | 1.5–2.5 | 1165 | $3,300 | $2.83 | 1d | 1 | 1.04mi |
| 1219 Denver Ln Unit 1465013P El Cajon, CA | 3.0 | 2.5 | 1194 | $8,558 | $7.17 | 21d | 1 | 1.09mi |
| 1171 Marline Ave Unit 1171-A El Cajon, CA | 3.0 | 1.5 | 1141 | $3,100 | $2.72 | 1d | 1 | 1.11mi |
| 1343 Oakdale Ave El Cajon, CA | 1.0–2.0 | 1.0–2.0 | 800 | $2,195 | $2.74 | 1d | 1 | 1.18mi |
| 1377 Oakdale Ave Unit 03 El Cajon, CA | 2.0 | 2.0 | 900 | $2,425 | $2.69 | 1d | 1 | 1.18mi |
| 500 Grape St El Cajon, CA | 2.0 | 1.0 | 900 | $2,150 | $2.39 | 1d | 1 | 1.28mi |
| 989 Peach Ave El Cajon, CA | 1.0–3.0 | 1.0–2.0 | 845 | $2,150 | $2.54 | 1d | 11 | 1.33mi |
| 360 E Bradley Ave El Cajon, CA | 3.0 | 2.0 | 1116 | $2,934 | $2.63 | 1d | 3 | 1.38mi |
| 422 Shady Ln El Cajon, CA | 1.0–3.0 | 1.0–2.0 | 900 | $2,304 | $2.56 | 1d | 18 | 1.39mi |
| 798 McClure St Unit 14 El Cajon, CA | 3.0 | 1.0 | 916 | $2,295 | $2.51 | 1d | 1 | 1.39mi |
HOA detail
- Monthly dues
- $631 · $7,572/yr
- Likely covers
- security
Listing history 17 events
-
2026-06-18days on market $215,000 Active 57 DOM
-
2026-06-18price $215,000 Active 56 DOM
-
2026-06-17days on market $236,999 Active 56 DOM
-
2026-06-16days on market $236,999 Active 55 DOM
-
2026-06-15days on market $236,999 Active 54 DOM
-
2026-06-13days on market $236,999 Active 52 DOM
-
2026-06-13days on market $236,999 Active 51 DOM
-
2026-06-09days on market $236,999 Active 48 DOM
-
2026-06-08days on market $236,999 Active 47 DOM
-
2026-06-07days on market $236,999 Active 46 DOM
-
2026-06-04days on market $236,999 Active 43 DOM
-
2026-06-03days on market $236,999 Active 42 DOM
-
2026-06-02days on market $236,999 Active 41 DOM
-
2026-06-01days on market $236,999 Active 40 DOM
-
2026-05-31days on market $236,999 Active 39 DOM
-
2026-05-07price $236,999
-
2026-04-22$249,000 Active
ⓘ Source: listings_history table (triggers on properties + properties_extension) + one-shot
backfill from property_details.listing_events for pre-trigger history.
Tax reassessment forecast CA · Resets to sale price
- Current annual tax
- $1,349 · $112/mo
- Projected year-2 tax
- $1,634 · $136/mo
- Expected delta
- +$285/yr (+$24/mo · 21.1%)
ⓘ Screening estimate from a state-policy table — verify with the county assessor before closing.
Climate risk First Street
- Flood 1/10 Low FEMA zone X (unshaded) · 0% chance over 30 yrs
- Wildfire 3/10 Moderate
- Heat 5/10 Major 5 d/yr ≥98°F today · 14 d/yr by 30 yrs out
- Wind 1/10 Low
- Air quality 4/10 Moderate 6 unhealthy d/yr today · 7 by 30 yrs out
Nearby sold comps map
Loading sold comps map…
Walkable amenities ~0.75 mi
Loading nearby amenities…
Taxation est. · year 1
- Rental income
- $32,527
- − Mortgage interest
- −$12,043
- − Property taxes
- −$1,349
- − Insurance
- −$1,075
- − Repairs & maintenance
- −$2,602
- − Management
- −$2,602
- − HOA
- −$7,572
- − Depreciation
- −$6,255
- Taxable loss
- −$971
- Est. tax savings @ 24.0%
- +$233
- After-tax cash flow
- $2,404/yr
For passive investors: Depreciation is non-cash, so a rental often shows a tax loss while cash-flowing — sheltering income. Rental losses are passive: they offset passive income freely, and up to $25,000/yr can offset ordinary (W-2) income if you actively participate and your MAGI is under $100k (phasing out to $0 by $150k); unused losses carry forward. On sale, claimed depreciation is recaptured at up to 25%, and gains may owe capital-gains tax (a 1031 exchange can defer both). Figures are a year-1 estimate at your 24.0% rate — not tax advice; consult a CPA.
Schools (NCES district)
- District
- Grossmont Union High
- NCES district ID
- 0616230
- Math proficiency
- 31% ▼ -1.00%
- Reading proficiency
- 60% ▲ 5.00%
- Median HH income
- $61,801
- Composite
- 40.07/100
- National rank
- #3810
- State rank
- #173 of 517 in CA
Livability — Bostonia
- Score
- 65/100
- State rank
- #383
- US rank
- #13065
Category grades
Schools grade is shown separately in the Schools card above.
Census & demographics
- Census place
- Bostonia, CA
- County
- San Diego County · 3,178,799 people
- Metro
- San Diego-Chula Vista-Carlsbad, CA
- Population (ZIP)
- 70,501
- Household income
- $74,013
- Rent vs Own
- Severe rent burden
- 4178.0
Population outlook (San Diego County) Hauer SSP2
- Today (2025)
- 3,678,185 people
- By 2030
- 3,856,546 · +4.8%
- By 2040
- 4,171,407 · +13.4%
- By 2050
- 4,421,607 · +20.2%
- By 2075
- 4,831,599 · +31.4%
- By 2100
- 4,832,502 · +31.4%
Race, ethnicity, and origin ACS 2023
- Neighborhood character
- Diverse neighborhood (Simpson 0.62)
- Race & ethnicity
- White 54% Hispanic / Latino 28% Two or more races 14% Black 6% Asian 5% Native American 2%
- Hispanic origin (detail)
- Mexican 24%
- Common ancestry
- Arab 6% Italian 2% Lithuanian 2%
- Foreign-born
- 22% · Canada
- Languages at home
- 65% English-only · Spanish 18% Arabic 7% Other Indo-European 3%
Political lean MEDSL · San Diego
- 2024 margin
- D (+16.8) · D 56.9% · R 40.1% · Other 2.9%
- 2008→2024 swing
- +6.6pp toward D · 2008: 10.2pp · 2024: 16.8pp
- All cycles
- 2024: D+16.8 2020: D+22.8 2016: D+17.8 2012: D+5.1 2008: D+10.2
Not yet ingested
- Civics
- —
Market trends
- HPI YoY
- ▼ -654.88%
- Current HPI
- 335.0617
- Rent YoY
- ▼ -0.83%
- Metro
- San Diego-Chula Vista-Carlsbad, CA
- State GDP YoY
- ▲ 3.21%
- F500 in state
- 116
Industry mix (Fortune 500 HQ in CA)
| Industry | F500 HQs | Revenue |
|---|---|---|
| Technology | 27 | $1,492B |
|
||
| Financial Services | 3 | $174B |
|
||
| Retail | 3 | $44B |
|
||
| Insurance | 3 | $26B |
|
||
| Media / Entertainment | 2 | $115B |
|
||
| Pharmaceuticals / Biotech | 2 | $62B |
|
||
Price history
-4.8% since first listed2 events — show timeline
- 2026-05-07 Price Changed $236,999 CRMLS
- 2026-04-22 Listed $249,000 CRMLS
Property tax history
+3.3%/yrLatest (2025): $1,349 · +11.6% YoY. Source: county tax records.
Cash-flow waterfall
monthlySold comps — $/sqft
last 12 mo · ≤1 miLoading sold comps…