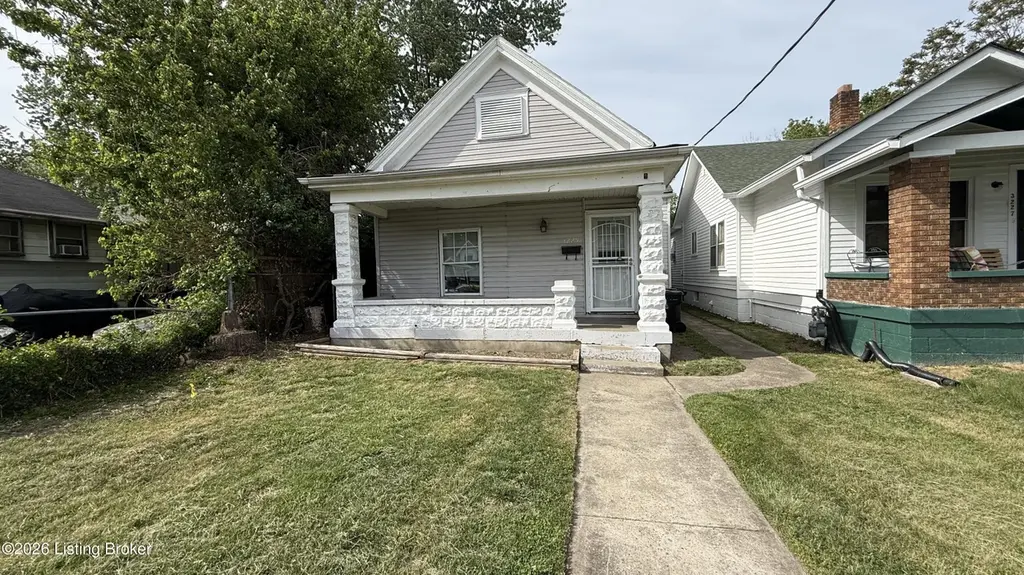
3229 Garland Ave · Louisville, KY
Flood risk 6/10 · Moderate
- FEMA flood zone
- X (shaded)
- Chance of flooding over 30 yrs
- 0.69%
- Est. flood insurance / yr
- $507 – $1,088
Fire risk 1/10 · Minimal
- Est. fire insurance / yr
- $839 – $1,559
Heat risk 5/10 · Moderate
- Hot days now (above 105°F)
- 7 days/yr
- Hot days in 30 yrs
- 20 days/yr
Wind risk 2/10 · Minimal
- Chance of severe wind over 30 yrs
- 1.0%
Air-quality risk 2/10 · Minimal
- Unhealthy air days now
- 1 days/yr
- Unhealthy air days in 30 yrs
- 3 days/yr
Risk factors via First Street. Map © Google.
Why this score? — see what drove the B grade
The composite is a weighted blend of 9 inputs, each scored 0–100. Each bar is that input's sub-score; the figure is the points it added to the 100-point composite (weight × sub-score).
- Cash flow +30.0/30.0
- ARV discount +10.3/15.0
- 1% rule +10.0/10.0
- DSCR +10.0/10.0
- Rent growth +3.7/5.0
- Livability +3.2/5.0
- Condition / age +2.5/5.0
- Schools +2.3/10.0
- Appreciation +0.0/10.0
$73,000
🖨 Deal sheet (PDF) 📄 Offer letter ✓ Due diligence
Listing remarks MLS
Sold ''As Is''. ALL BUYERS MUST BE PRE-APPROVED OR SHOW PROOF OF CASH WITH ALL OFFERS. BUYER TO BE RESPONSIBLE FOR COMPLIANCE WITH THE COUNTY SMOKE DETECTOR ORDINANCE. BUYERS AGENT TO VERIFY SQ FT, AGE, ANY HOA OR MONTHLY MAINT FEES, LOT SIZE AND WHICH UTILITIES ARE AVAILABLE. BUYERS AGENT TO VERIFY ALL SCHOOL INFO. BUYERS AGENT RESPONSIBLE FOR ALL SEWER AND FLOOD PLAIN INFORMATION.
Key facts
- Spacious backyard
- Huge deck
- Functional layout
Tags
Property features AI
Finance
- Other: Property listed in the DEPPENS JOHN HEI subdivision
- HOA & community: No association fee
Exterior
- Parking: Detached garage (1 car); Rear entry; Driveway parking
- Utilities: Electricity connected; One HVAC unit reported; One cooling unit reported
- Home design: Single-family residence; Shotgun architectural style; One story
- Construction: Built in 1920; Vinyl siding and wood frame construction; Shingle roof; Crawl space foundation
- Exterior features: Privacy and partial fencing
Interior
- Kitchen: Kitchen located on the first floor
- Bedrooms: Three bedrooms, all on the first floor
- Bathrooms: One full bathroom
- Heating & cooling: Forced air heating; Central air conditioning
- Interior features: Six total rooms; Cellar with outside entry; First-floor laundry; No fireplaces reported
- Laundry & utility: Laundry on the first floor
Neighborhood map
What this means for you Summary
Snapshot
- This is a 3-bed/1.0-bath single-family listed at $73k.
Deal economics
- At list price, monthly cash flow is $518 ($6k/yr) — positive.
- The deal already cash-flows at list — no discount required.
- Meets the 1% rule at list price ($1k rent vs $73k).
- Recommended offer: $69k (6.0% below list) — sets the bar for market timing.
- Cap rate 14.8% vs local median 5.0% in Louisville — top-decile yield for the area; either an underpriced asset or a hidden risk that comps aren't pricing in. Stress-test before assuming the spread holds.
Location & tenants
- Location reads 63/100 on livability (#333 in KY) — a middle-class / working-renter tenant base. Strengths: cost of living A+, housing A+; Watch: employment C-, health & safety D+, schools D-.
- Jefferson County (urban): math 19% / reading 35% proficiency, ranked #121 of 165 in KY (top 73%) — low school quality limits family demand, transient renter base, plan for 1-2y turnover.
- Market conditions: Rents rising fast (+4.9%/yr); 140 active listings in the ZIP; 40 comparable units currently listed for rent nearby; rentals at typical pace (median 25d on market — plan ~3-4 weeks tenant-placement turnaround); lower-income renter base — watch delinquency; 2,836 units permitted in Jefferson County in 2024 (1,558 in 5+ unit buildings).
- At $1,255/mo this rent would consume 47% of the median local household income ($32k/yr) (locally 1483% of renters already pay >50% of income on rent) — very limited rent-growth headroom before tenants either downsize or default.
Forward outlook
- Local home prices are declining (-3.0%/yr); year-one equity from $505 of loan paydown is wiped out by about $2k of value loss. Plan a longer hold.
- Jefferson County population projected at +13% by 2050 — modest demand growth; plan on rents tracking national, not racing it.
- At projected returns (-3.0% appreciation + 4.9% rent growth), your $20k cash investment doubles in ~4 years — after that, you're playing with house money.
Negotiation context
- It's been on market 83 days — a 6% lower offer ($69k) is reasonable based on typical stale-listing flexibility.
- 4 sale attempts since 17y ago with the ask held roughly flat each time — persistent listings suggest the price (not the market) is what's stuck; bring a comps-based counter.
- Current owner paid $8k; list at $73k implies a 873% gain — meaningful room to come down on a strong offer.
Risks & watch-outs
- Watch-outs: built in 1920 — expect roof / HVAC / electrical / plumbing capex.
- Climate carrying-cost: major flood risk; extreme-heat days projected 7→20/yr by 2055 (HVAC capex compounding) — expect insurance premiums to compound above CPI over the hold.
Questions for the listing agent
- It's been on market 83 days. Have you received any prior offers? Is the seller open to a 6% concession, seller financing, or rate buy-down credit?
- Built in 1920 — when were the roof, HVAC, electrical panel, plumbing, and water heater last replaced?
- Why hasn't it sold? Are there any deal-killer items the seller is aware of (foundation, flood, title, zoning, code violations)?
- Is there a deadline driving the sale (1031 exchange, divorce, estate, relocation)? That informs how much negotiation room exists.
- Schools are D-rated, which usually means shorter tenancies and higher turnover. Who's the typical renter profile here, and what's been the actual vacancy rate?
- Crime grade is F in this area — have there been break-ins, vandalism, or insurance claims at this property in the last 3 years? What carrier currently insures it and at what premium?
- What's the average days-on-market for RENTAL listings here right now (not sales)? A rising rental-DOM trend means longer vacancies and softer asking-rent achievability than the comps imply.
- What's the recent tenant-quality profile in this submarket — average credit score on applications, eviction rate, late-payment / NSF rate, and stable-employment percentage? A property-management company in the area should have these aggregated.
- How much new for-sale + rental construction is in the pipeline within 1–3 miles? Heavy new supply typically softens prices + rents 12–24 months out; constrained supply supports both.
Investment metrics
- 1% rule
- 1.72% ✓
- Cap rate
- 14.80%
- Cash-on-cash
- 30.40%
- DSCR
- 2.35
- GRM
- 4.8
CMA / ARV
- ARV (on-the-fly)
- $77,760
- Comps found
- 12
Show comp detail 12 sales within ~0.75 mi
| Address | Dist | Beds/Ba | Sqft | Sold | Price | $/sf | Match |
|---|---|---|---|---|---|---|---|
| 3212 W Kentucky St | 0.13mi | 2/1.5 (-1) | 1,104 (+2%) | 2mo | $45,000 | $41 | 82 |
| 844 Louis Coleman Jr Dr | 0.11mi | 3/1.0 | 1,008 (-7%) | 3mo | $109,000 | $108 | 81 |
| 3419 Greenwood Ave | 0.26mi | 3/1.0 | 1,033 (-4%) | 3mo | $120,000 | $116 | 78 |
| 722 S 37th St | 0.39mi | 2/1.0 (-1) | 1,092 (+1%) | 4mo | $46,000 | $42 | 72 |
| 802 Sutcliffe Ave | 0.31mi | 2/1.0 (-1) | 1,162 (+8%) | 4mo | $110,000 | $95 | 65 |
| 3107 Dumesnil St | 0.58mi | 3/1.0 | 1,035 (-4%) | 6mo | $32,000 | $31 | 61 |
| 637 S 27th St | 0.72mi | 3/1.0 | 1,110 (+3%) | 7mo | $40,000 | $36 | 56 |
| 2615 Greenwood Ave | 0.63mi | 3/1.0 | 988 (-8%) | 3mo | $71,000 | $72 | 54 |
| 3322 Virginia Ave | 0.52mi | 3/1.0 | 1,198 (+11%) | 8mo | $180,000 | $150 | 51 |
| 1310 Hemlock St | 0.68mi | 2/1.0 (-1) | 1,126 (+4%) | 8mo | $105,000 | $93 | 50 |
| 3229 Kirby Ave | 0.67mi | 2/1.0 (-1) | 950 (-12%) | 2mo | $45,000 | $47 | 42 |
| 2645 Grand Ave | 0.60mi | 2/1.0 (-1) | 926 (-14%) | 3mo | $62,000 | $67 | 40 |
Match score weights: distance 35% · size 25% · config 20% · recency 20%. Top-matched comps best support the ARV.
Projected returns pro-forma
-3.0% appreciation · 4.87% rent growth · sell at horizon
- IRR
- 27.1%
- Equity multiple
- 2.15×
- Total profit
- $23,555
- Equity at exit
- $10,885
- IRR
- 35.7%
- Equity multiple
- 4.58×
- Total profit
- $73,235
- Equity at exit
- $6,312
Cash invested: $20,440 (down + closing). Projections, not guarantees.
Landlord ↔ Tenant lean methodology
- Overall (STATE)
- 83 Strongly Landlord-Friendly
- State Kentucky
- 83 Strongly Landlord-Friendly · R+16
- County
- — inherits STATE
- City
- — inherits STATE
ZIP-level market 40211
- Home prices YoY
- -33.4%
- Rents YoY
- 4.9%
- Active inventory
- 140
- Price-to-rent
- 4.8×
Monthly cashflow live
- Estimated rent
- $1,255 high interval (Pro) →
- Mortgage (P&I)
- −$383
- Tax from tax record
- −$61 /mo · $729/yr
- Insurance
- −$30
- HOA
- −$0
- Vacancy / Maint / Mgmt
- −$264
- Net cashflow
- $518
Break-even live
Sensitivity live
| Price | -10% $559 | -5% $538 | +0% $518 | +5% $497 | +10% $476 |
|---|---|---|---|---|---|
| Rent | -10% $419 | -5% $468 | +0% $518 | +5% $567 | +10% $617 |
| Rate | -1.0pp $555 | -0.5pp $536 | base $518 | +0.5pp $499 | +1.0pp $480 |
UW: 25.0% down · 7.5% · 30yr · 1.5% tax · 5.0% vac · 8.0% maint · 8.0% mgmt
Financing live
Cash to close
- Down payment
- $18,250
- Closing costs
- $2,190
- Reserves months
- —
- Total cash needed
- —
Loan-product check · same deal, 3 products live
Conventional
25% down · 7.5% · 30yr
- Down + closing
- —
- Monthly P&I
- —
- Monthly cashflow
- —
- DSCR
- —
- Eligible?
- —
Personal DTI + credit; lowest rate.
DSCR
20% down · 8.5% · 30yr
- Down + closing
- —
- Monthly P&I
- —
- Monthly cashflow
- —
- DSCR
- —
- Eligible?
- —
No personal income docs; deal must DSCR.
Hard money
10% down · 12.0% · 12mo
- Down + closing
- —
- Monthly P&I
- —
- Monthly cashflow
- —
- DSCR
- —
- Eligible?
- —
Short-term bridge; refi at stabilization.
Rent comps 40 comps
| Address | Beds | Baths | Sqft | Rent | $/sqft | DOM | Units | Dist |
|---|---|---|---|---|---|---|---|---|
| 814 S 33rd St Louisville, KY | 3.0 | 1.0 | 1104 | $1,350 | $1.22 | 4d | 1 | 0.10mi |
| 832 Hazel St Louisville, KY | 2.0 | 1.0 | 720 | $1,095 | $1.52 | 4d | 1 | 0.11mi |
| 737 S 33rd St Louisville, KY | 4.0 | 1.0 | 1356 | $1,595 | $1.18 | 24d | 1 | 0.17mi |
| 3122 W Kentucky St Louisville, KY | 3.0 | 1.0 | 1030 | $1,150 | $1.12 | 24d | 1 | 0.18mi |
| 803 S 35th St Louisville, KY | 3.0 | 1.0 | 1486 | $1,350 | $0.91 | 24d | 1 | 0.19mi |
| 701 Hazel St Unit 3 Louisville, KY | 2.0 | 1.0 | 832 | $800 | $0.96 | 11d | 1 | 0.28mi |
| 666 Eastlawn Ave Louisville, KY | 2.0 | 1.0 | 936 | $895 | $0.96 | 17d | 1 | 0.35mi |
| 1115 S 32nd St Louisville, KY | 3.0 | 1.0 | 1393 | $1,275 | $0.92 | 22d | 1 | 0.37mi |
| 1115 S 32nd St Louisville, KY | 3.0 | 1.0 | 1393 | $1,275 | $0.92 | 24d | 1 | 0.37mi |
| 2912 Greenwood Ave Louisville, KY | 3.0 | 2.0 | 1362 | $1,150 | $0.84 | 17d | 1 | 0.38mi |
| 3514 Grand Ave Louisville, KY | 3.0 | 1.5 | 1450 | $1,295 | $0.89 | 22d | 1 | 0.41mi |
| 2825 Greenwood Ave #4 Louisville, KY | 3.0 | 1.0 | 1440 | $1,250 | $0.87 | 24d | 1 | 0.41mi |
| 2825 Greenwood Ave #2 Louisville, KY | 2.0 | 1.0 | 1300 | $995 | $0.77 | 24d | 1 | 0.41mi |
| 2821 Greenwood Ave #1 Louisville, KY | 3.0 | 1.0 | 1113 | $1,300 | $1.17 | 24d | 1 | 0.42mi |
| 823 S 38th St Louisville, KY | 3.0 | 1.0 | 1100 | $1,195 | $1.09 | 4d | 1 | 0.44mi |
| 1145 Louis Coleman Jr Dr Louisville, KY | 2.0 | 1.0 | 913 | $875 | $0.96 | 24d | 1 | 0.46mi |
| 2724 Garland Ave Unit 202 Louisville, KY | 2.0 | 1.0 | 950 | $745 | $0.78 | 4d | 1 | 0.47mi |
| 3215 Virginia Ave Louisville, KY | 3.0 | 1.0 | 975 | $924 | $0.95 | 24d | 1 | 0.48mi |
| 2711 W Kentucky St Louisville, KY | 3.0 | 1.0 | 1155 | $1,100 | $0.95 | 24d | 1 | 0.52mi |
| 2710 W Kentucky St Apt 2 Louisville, KY | 3.0 | 1.0 | 1015 | $1,300 | $1.28 | 24d | 1 | 0.52mi |
| 729 S 39th St Unit 1 Louisville, KY | 2.0 | 1.0 | 800 | $800 | $1.00 | 24d | 1 | 0.54mi |
| 652 S 37th St #9 Louisville, KY | 3.0 | 1.0 | 1070 | $1,095 | $1.02 | 24d | 1 | 0.54mi |
| 2634 Garland Ave Unit A Louisville, KY | 3.0 | 1.0 | 1152 | $940 | $0.82 | 24d | 1 | 0.55mi |
| 2634 Garland Ave Unit B Louisville, KY | 3.0 | 1.0 | 1152 | $895 | $0.78 | 21d | 1 | 0.55mi |
| 648 S 37th St #3 Louisville, KY | 2.0 | 1.0 | 807 | $850 | $1.05 | 24d | 1 | 0.56mi |
| 2708 Greenwood Ave Apt 1 Louisville, KY | 3.0 | 1.0 | 1100 | $1,300 | $1.18 | 24d | 1 | 0.56mi |
| 2733 Chase Ct Louisville, KY | 2.0 | 1.0 | 900 | $900 | $1.00 | 17d | 1 | 0.59mi |
| 3421 River Park Dr Louisville, KY | 3.0 | 1.0 | 994 | $1,250 | $1.26 | 24d | 1 | 0.61mi |
| 1155 S 28th St Unit 4 Louisville, KY | 4.0 | 2.0 | 1010 | $1,350 | $1.34 | 24d | 1 | 0.64mi |
| 2913 Dumesnil St Apt 3 Louisville, KY | 3.0 | 1.0 | 1112 | $740 | $0.67 | 11d | 1 | 0.65mi |
| 714 S 40th St #2 Louisville, KY | 3.0 | 1.0 | 1000 | $1,250 | $1.25 | 24d | 1 | 0.66mi |
| 833 S 41st St Louisville, KY | 3.0 | 2.0 | 786 | $1,250 | $1.59 | 24d | 1 | 0.67mi |
| 2706 Hale Ave Unit 1 Louisville, KY | 3.0 | 1.0 | 1100 | $1,400 | $1.27 | 24d | 1 | 0.67mi |
| 2706 Hale Ave Unit 2 Louisville, KY | 2.0 | 1.0 | 900 | $1,250 | $1.39 | 24d | 1 | 0.67mi |
| 627 S 38th St Louisville, KY | 4.0 | 1.0 | 1300 | $1,349 | $1.04 | 17d | 1 | 0.68mi |
| 836 S 41st St Louisville, KY | 3.0 | 1.0 | 1300 | $1,300 | $1.00 | 20d | 1 | 0.70mi |
| 715 S 41st St Unit 1 Louisville, KY | 4.0 | 1.0 | 1000 | $1,295 | $1.29 | 11d | 1 | 0.70mi |
| 3611 Regatta Way Louisville, KY | 3.0 | 1.0 | 1035 | $1,450 | $1.40 | 17d | 1 | 0.74mi |
| 628 S 39th St Louisville, KY | 3.0 | 1.0 | 1448 | $1,220 | $0.84 | 17d | 1 | 0.74mi |
| 803 Cecil Ave Louisville, KY | 4.0 | 1.0 | 1165 | $1,449 | $1.24 | 11d | 1 | 0.75mi |
Listing history 21 events
-
2026-06-18days on market $73,000 Active 83 DOM
-
2026-06-17days on market $73,000 Active 82 DOM
-
2026-06-16days on market $73,000 Active 81 DOM
-
2026-06-15days on market $73,000 Active 80 DOM
-
2026-06-13days on market $73,000 Active 78 DOM
-
2026-06-10days on market $73,000 Active 75 DOM
-
2026-06-09days on market $73,000 Active 74 DOM
-
2026-06-08days on market $73,000 Active 73 DOM
-
2026-06-07days on market $73,000 Active 72 DOM
-
2026-06-03days on market $73,000 Active 68 DOM
-
2026-06-02days on market $73,000 Active 67 DOM
-
2026-06-01days on market $73,000 Active 66 DOM
-
2026-05-31days on market $73,000 Active 65 DOM
-
2026-05-23price $73,000
-
2026-03-27$75,000 Active
-
2021-11-12historical
-
2021-08-12$74,900 Active
-
2010-04-09soldstatus $7,500 385-char remark
Show marketing remark (385 chars)
Sold ''As Is''. ALL BUYERS MUST BE PRE-APPROVED OR SHOW PROOF OF CASH WITH ALL OFFERS. BUYER TO BE RESPONSIBLE FOR COMPLIANCE WITH THE COUNTY SMOKE DETECTOR ORDINANCE. BUYERS AGENT TO VERIFY SQ FT, AGE, ANY HOA OR MONTHLY MAINT FEES, LOT SIZE AND WHICH UTILITIES ARE AVAILABLE. BUYERS AGENT TO VERIFY ALL SCHOOL INFO. BUYERS AGENT RESPONSIBLE FOR ALL SEWER AND FLOOD PLAIN INFORMATION.
-
2010-03-09$5,000 385-char remark
Show marketing remark (385 chars)
Sold ''As Is''. ALL BUYERS MUST BE PRE-APPROVED OR SHOW PROOF OF CASH WITH ALL OFFERS. BUYER TO BE RESPONSIBLE FOR COMPLIANCE WITH THE COUNTY SMOKE DETECTOR ORDINANCE. BUYERS AGENT TO VERIFY SQ FT, AGE, ANY HOA OR MONTHLY MAINT FEES, LOT SIZE AND WHICH UTILITIES ARE AVAILABLE. BUYERS AGENT TO VERIFY ALL SCHOOL INFO. BUYERS AGENT RESPONSIBLE FOR ALL SEWER AND FLOOD PLAIN INFORMATION.
-
2010-01-25historical
-
2009-12-08$9,900
ⓘ Source: listings_history table (triggers on properties + properties_extension) + one-shot
backfill from property_details.listing_events for pre-trigger history.
Tax reassessment forecast KY · Resets to sale price
- Current annual tax
- $729 · $61/mo
- Projected year-2 tax
- $729 · $61/mo
- Expected delta
- $0/yr ($0/mo · 0.0%)
ⓘ Screening estimate from a state-policy table — verify with the county assessor before closing.
Climate risk First Street
- Flood 6/10 Major FEMA zone X (shaded) · 69% chance over 30 yrs
- Wildfire 1/10 Low
- Heat 5/10 Major 7 d/yr ≥105°F today · 20 d/yr by 30 yrs out
- Wind 2/10 Low 100% chance of damaging wind over 30 yrs
- Air quality 2/10 Low 1 unhealthy d/yr today · 3 by 30 yrs out
Nearby sold comps map
Loading sold comps map…
Walkable amenities ~0.75 mi
Loading nearby amenities…
Taxation est. · year 1
- Rental income
- $15,065
- − Mortgage interest
- −$4,089
- − Property taxes
- −$729
- − Insurance
- −$365
- − Repairs & maintenance
- −$1,205
- − Management
- −$1,205
- − Depreciation
- −$2,124
- Taxable income
- $5,348
- Est. tax owed @ 24.0%
- −$1,283
- After-tax cash flow
- $4,930/yr
For passive investors: Depreciation is non-cash, so a rental often shows a tax loss while cash-flowing — sheltering income. Rental losses are passive: they offset passive income freely, and up to $25,000/yr can offset ordinary (W-2) income if you actively participate and your MAGI is under $100k (phasing out to $0 by $150k); unused losses carry forward. On sale, claimed depreciation is recaptured at up to 25%, and gains may owe capital-gains tax (a 1031 exchange can defer both). Figures are a year-1 estimate at your 24.0% rate — not tax advice; consult a CPA.
Schools (NCES district)
- District
- Jefferson County
- NCES district ID
- 2102990
- Math proficiency
- 19% ▼ -17.00%
- Reading proficiency
- 35% ▼ -11.00%
- Median HH income
- $47,885
- Composite
- 23.45/100
- National rank
- #7884
- State rank
- #121 of 165 in KY
Livability — Louisville
- Score
- 63/100
- State rank
- #333
- US rank
- #15887
Category grades
Schools grade is shown separately in the Schools card above.
Census & demographics
- Census place
- Louisville, KY
- County
- Jefferson County · 790,184 people
- City population
- 769,292
- Metro
- Louisville/Jefferson County, KY-IN
- Population (ZIP)
- 20,407
- Household income
- $31,749
- Rent vs Own
- Severe rent burden
- 1483.0
Population outlook (Jefferson County) Hauer SSP2
- Today (2025)
- 823,112 people
- By 2030
- 849,343 · +3.2%
- By 2040
- 895,696 · +8.8%
- By 2050
- 933,630 · +13.4%
- By 2075
- 1,028,262 · +24.9%
- By 2100
- 1,072,675 · +30.3%
Race, ethnicity, and origin ACS 2023
- Neighborhood character
- Predominantly Black (90%)
- Race & ethnicity
- Black 90% White 5% Two or more races 4% Hispanic / Latino 1%
- Common ancestry
- Italian 1%
- Foreign-born
- 1% · Canada
- Languages at home
- 98% English-only · Spanish 1%
Political lean MEDSL · Jefferson
- 2024 margin
- D (+16.6) · D 57.4% · R 40.9% · Other 1.7%
- 2008→2024 swing
- +4.5pp toward D · 2008: 12.0pp · 2024: 16.6pp
- All cycles
- 2024: D+16.6 2020: D+20.1 2016: D+13.3 2012: D+11.1 2008: D+12.0
Not yet ingested
- Civics
- —
Market trends
- HPI YoY
- ▼ -88.22%
- Current HPI
- 176.337
- Rent YoY
- ▲ 4.87%
- Metro
- Louisville/Jefferson County, KY-IN
- State GDP YoY
- ▲ 1.81%
- F500 in state
- 4
Industry mix (Fortune 500 HQ in KY)
| Industry | F500 HQs | Revenue |
|---|---|---|
| Healthcare | 1 | $118B |
|
||
| Food / Beverage | 1 | $7B |
|
||
Price history
+637.4% since first listed8 events — show timeline
- 2026-05-23 Price Changed $73,000 Metro Search MLS
- 2026-03-27 Listed $75,000 Metro Search MLS
- 2021-11-12 Listing Removed — Metro Search MLS
- 2021-08-12 Listed $74,900 Metro Search MLS
- 2010-04-09 Sold (MLS) $7,500 Metro Search MLS
- 2010-03-09 Listed $5,000 Metro Search MLS
- 2010-01-25 Listing Removed — Metro Search MLS
- 2009-12-08 Listed $9,900 Metro Search MLS
Property tax history
+7.6%/yrLatest (2025): $729 · -1.9% YoY. Source: county tax records.
Cash-flow waterfall
monthlySold comps — $/sqft
last 12 mo · ≤1 miLoading sold comps…