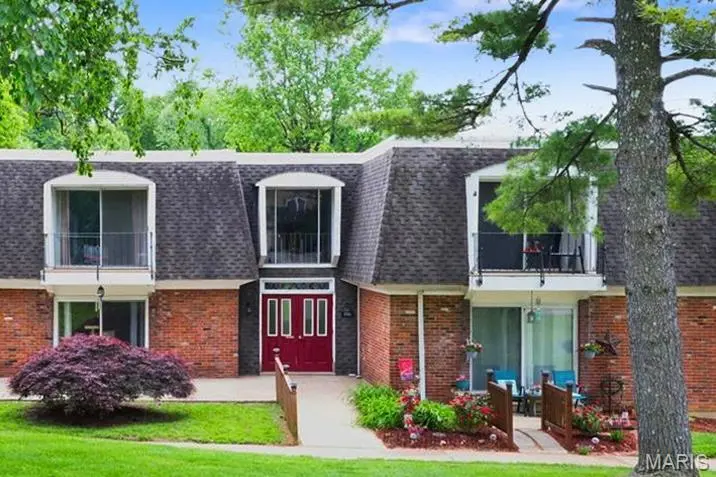
1061 Lafayette Ct Unit A · Collinsville, IL
Flood risk 1/10 · Minimal
- FEMA flood zone
- X
- Chance of flooding over 30 yrs
- 0.0%
- Est. flood insurance / yr
- $473 – $860
Fire risk 1/10 · Minimal
- Est. fire insurance / yr
- $804 – $1,492
Heat risk 5/10 · Moderate
- Hot days now (above 107°F)
- 7 days/yr
- Hot days in 30 yrs
- 21 days/yr
Wind risk 2/10 · Minimal
- Chance of severe wind over 30 yrs
- 1.0%
Air-quality risk 3/10 · Minor
- Unhealthy air days now
- 3 days/yr
- Unhealthy air days in 30 yrs
- 4 days/yr
Risk factors via First Street. Map © Google.
Why this score? — see what drove the B- grade
The composite is a weighted blend of 9 inputs, each scored 0–100. Each bar is that input's sub-score; the figure is the points it added to the 100-point composite (weight × sub-score).
- Cash flow +30.0/30.0
- 1% rule +10.0/10.0
- DSCR +10.0/10.0
- ARV discount +7.5/15.0
- Livability +3.4/5.0
- Rent growth +3.3/5.0
- Condition / age +2.5/5.0
- Schools +1.6/10.0
- Appreciation +0.0/10.0
$74,900
🖨 Deal sheet 📄 Offer letter ✓ Due diligence
Listing remarks
Property Listing: Maintenance-Free Living on the Bluffs. Effortless Living at Its Best! Discover the perfect blend of comfort, convenience and low-maintenance living in this beautiful 3-bedroom, 2-bathroom main-floor condominium. Nestled high atop the scenic Bluffs of Collinsville, this condo offers a peaceful retreat while keeping you mere minutes from major highway access, premier shopping and local dining favorites. Interior Highlights: This move-in-ready condo features a spacious, functional layout with a welcoming foyer and living room plus a dedicated dining area. You’ll enjoy total peace of mind with brand-new vinyl windows throughout, providing home with natural light. The uni
Key facts
- $328 HOA
- Garage
- Built 1967
Property features AI
Finance
- HOA & community: Carrol Wood Hill Condominiums HOA; Monthly HOA fee includes water, sewer, and trash; HOA provides common ground
Exterior
- Parking: Attached garage with garage door opener (1 garage space); Additional parking
- Utilities: Public water; Public sewer; Electric: other; Cable available
- Home design: Attached condominium; One level
- Construction: Brick construction
- Exterior features: Patio; Adjoins common ground
Interior
- Kitchen: Kitchen (8 x 10)
- Bedrooms: Three bedrooms, all on the main level; Primary bedroom (14 x 11); Second bedroom (14 x 9); Third bedroom (9 x 11)
- Bathrooms: One full bathroom (main level); One half bathroom (main level)
- Heating & cooling: Forced air heating; Central air conditioning
- Interior features: Basement with unspecified/other features; Living room (23 x 11); Dining room (9 x 9)
Neighborhood map
What this means for you Summary
Snapshot
- This is a 3-bed/1.0-bath condo listed at $75k.
Deal economics
- At list price, monthly cash flow is $323 ($4k/yr) — positive.
- The deal already cash-flows at list — no discount required.
- Meets the 1% rule at list price ($1k rent vs $75k).
- Cap rate 11.5% vs local median 4.0% in Collinsville — top-decile yield for the area; either an underpriced asset or a hidden risk that comps aren't pricing in. Stress-test before assuming the spread holds.
Location & tenants
- Location reads 67/100 on livability (#491 in IL) — a middle-class / working-renter tenant base. Strengths: cost of living A+, housing A+, crime B; Watch: amenities F, commute F, health & safety F.
- Collinsville CUSD 10 (suburban): math 14% / reading 20% proficiency, ranked #465 of 620 in IL (top 75%) — low school quality limits family demand, transient renter base, plan for 1-2y turnover.
- Zoned schools: Collinsville High School (math 16% / reading 21%, grade F, #427 of 693 statewide, top 62%, 1,978 students, 0% FRL) — zoned schools average 0% FRL vs 52% district-wide (52 pts lower); this property's tenant base skews higher-income than the district average.
- Market conditions: Rents rising (+3.1%/yr); 83 active listings in the ZIP; 8 comparable units currently listed for rent nearby; rentals leasing fast (median 8d on market — plan ~1-2 weeks tenant-placement turnaround); 336 units permitted in Madison County in 2024 (0 in 5+ unit buildings).
Forward outlook
- Local home prices are declining (-3.0%/yr); year-one equity from $518 of loan paydown is wiped out by about $2k of value loss. Plan a longer hold.
- Madison County population projected at -18% by 2050 — secular population decline; favor cash flow + early exit over multi-decade hold.
- At projected returns (-3.0% appreciation + 3.1% rent growth), your $21k cash investment doubles in ~7 years — after that, you're playing with house money.
Negotiation context
- Only 1 days on market — expect competitive offers; lowballing is unlikely to land.
Risks & watch-outs
- Watch-outs: HOA is 23% of rent.
- Climate carrying-cost: extreme-heat days projected 7→21/yr by 2055 (HVAC capex compounding) — expect insurance premiums to compound above CPI over the hold.
Questions for the listing agent
- Built in 1967 — when were the roof, HVAC, electrical panel, plumbing, and water heater last replaced?
- What does the HOA fee cover, when was the last increase, and are there any pending special assessments or reserve-fund shortfalls?
- Any open or pending special assessments — roof, HVAC, plumbing, elevator, façade? What's the per-unit balance and payoff schedule, and is the seller paying it off at close or rolling it to the buyer?
- Is there a deadline driving the sale (1031 exchange, divorce, estate, relocation)? That informs how much negotiation room exists.
- Schools are D-rated, which usually means shorter tenancies and higher turnover. Who's the typical renter profile here, and what's been the actual vacancy rate?
- What's the average days-on-market for RENTAL listings here right now (not sales)? A rising rental-DOM trend means longer vacancies and softer asking-rent achievability than the comps imply.
- What's the recent tenant-quality profile in this submarket — average credit score on applications, eviction rate, late-payment / NSF rate, and stable-employment percentage? A property-management company in the area should have these aggregated.
- How much new apartment / multifamily construction is in the pipeline within 1–3 miles? Heavy new supply (>2% of stock underway) typically softens rents 12–24 months out; light construction supports rent growth.
Investment metrics
- 1% rule
- 1.91% ✓
- Cap rate
- 11.47%
- Cash-on-cash
- 18.50%
- DSCR
- 1.82
- GRM
- 4.4
CMA / ARV
No comps found within radius.
Projected returns pro-forma
-3.0% appreciation · 3.1% rent growth · sell at horizon
- IRR
- 10.6%
- Equity multiple
- 1.42×
- Total profit
- $8,796
- Equity at exit
- $11,168
- IRR
- 19.9%
- Equity multiple
- 2.70×
- Total profit
- $35,579
- Equity at exit
- $6,476
Cash invested: $20,972 (down + closing). Projections, not guarantees.
Landlord ↔ Tenant lean methodology
- Overall (STATE)
- 43 Moderately Tenant-Leaning
- State Illinois
- 43 Moderately Tenant-Leaning · D+7
- County
- — inherits STATE
- City
- — inherits STATE
ZIP-level market 62234
- Home prices YoY
- -17.1%
- Rents YoY
- 3.1%
- Active inventory
- 83
- Price-to-rent
- 4.4×
Monthly cashflow live
- Estimated rent
- $1,434 high interval (Pro) →
- Mortgage (P&I)
- −$393
- Tax from tax record
- −$58 /mo · $694/yr
- Insurance
- −$31
- HOA
- −$328
- Vacancy / Maint / Mgmt
- −$301
- Net cashflow
- $323
Break-even live
UW: 25.0% down · 7.5% · 30yr · 1.5% tax · 5.0% vac · 8.0% maint · 8.0% mgmt
Financing live
Cash to close
- Down payment
- $18,725
- Closing costs
- $2,247
- Reserves months
- —
- Total cash needed
- —
Loan-product check · same deal, 3 products live
Conventional
25% down · 7.5% · 30yr
- Down + closing
- —
- Monthly P&I
- —
- Monthly cashflow
- —
- DSCR
- —
- Eligible?
- —
Personal DTI + credit; lowest rate.
DSCR
20% down · 8.5% · 30yr
- Down + closing
- —
- Monthly P&I
- —
- Monthly cashflow
- —
- DSCR
- —
- Eligible?
- —
No personal income docs; deal must DSCR.
Hard money
10% down · 12.0% · 12mo
- Down + closing
- —
- Monthly P&I
- —
- Monthly cashflow
- —
- DSCR
- —
- Eligible?
- —
Short-term bridge; refi at stabilization.
Rent comps 8 comps
| Address | Beds | Baths | Sqft | Rent | $/sqft | DOM | Units | Dist |
|---|---|---|---|---|---|---|---|---|
| 34 Marcia Ct Unit 7 Collinsville, IL | 2.0 | 1.5 | 900 | $895 | $0.99 | 12d | 1 | 0.84mi |
| 319 N Hesperia St Collinsville, IL | 2.0 | 1.0 | 1000 | $1,200 | $1.20 | 1d | 1 | 0.94mi |
| 1225 W Main St Collinsville, IL | 3.0 | 1.0 | 1010 | $1,350 | $1.34 | 7d | 1 | 0.98mi |
| 307 N Clinton St Collinsville, IL | 3.0 | 2.0 | 1395 | $1,700 | $1.22 | 1d | 1 | 1.08mi |
| 102 W Madison Ave Collinsville, IL | 3.0 | 1.0 | 1100 | $1,650 | $1.50 | 14d | 1 | 1.09mi |
| 408 W Clay St Collinsville, IL | 4.0 | 2.0 | 1400 | $1,850 | $1.32 | 1d | 1 | 1.14mi |
| 108 S Hesperia St Collinsville, IL | 2.0 | 2.0 | 1450 | $1,300 | $0.90 | 7d | 1 | 1.20mi |
| 114 Greenfield Dr Collinsville, IL | 2.0 | 1.0 | 900 | $1,250 | $1.39 | 43d | 1 | 1.48mi |
HOA detail condo
- Monthly dues
- $328 · $3,936/yr
- Assessments
- None detected in remarks — confirm with the listing agent.
Listing history 7 events
-
2026-06-13status $74,900 Pending 1 DOM
-
2026-06-10statusdays on market $74,900 Active 1 DOM
-
2026-06-09days on market $74,900 Coming Soon 6 DOM
-
2026-06-08days on market $74,900 Coming Soon 5 DOM
-
2026-06-07days on market $74,900 Coming Soon 4 DOM
-
2026-06-05remarks 693-char remark
-
2026-06-05$74,900 Coming Soon 1 DOM
ⓘ Source: listings_history table (triggers on properties + properties_extension) + one-shot
backfill from property_details.listing_events for pre-trigger history.
Tax reassessment forecast IL · Partial reset (capped growth)
- Current annual tax
- $694 · $58/mo
- Projected year-2 tax
- $1,197 · $100/mo
- Expected delta
- +$503/yr (+$42/mo · 72.4%)
ⓘ Screening estimate from a state-policy table — verify with the county assessor before closing.
Climate risk First Street
- Flood 1/10 Low FEMA zone X · 0% chance over 30 yrs
- Wildfire 1/10 Low
- Heat 5/10 Major 7 d/yr ≥107°F today · 21 d/yr by 30 yrs out
- Wind 2/10 Low 100% chance of damaging wind over 30 yrs
- Air quality 3/10 Moderate 3 unhealthy d/yr today · 4 by 30 yrs out
Nearby sold comps map
Loading sold comps map…
Walkable amenities ~0.75 mi
Loading nearby amenities…
Taxation est. · year 1
- Rental income
- $17,211
- − Mortgage interest
- −$4,196
- − Property taxes
- −$694
- − Insurance
- −$374
- − Repairs & maintenance
- −$1,377
- − Management
- −$1,377
- − HOA
- −$3,936
- − Depreciation
- −$2,179
- Taxable income
- $3,078
- Est. tax owed @ 24.0%
- −$739
- After-tax cash flow
- $3,140/yr
For passive investors: Depreciation is non-cash, so a rental often shows a tax loss while cash-flowing — sheltering income. Rental losses are passive: they offset passive income freely, and up to $25,000/yr can offset ordinary (W-2) income if you actively participate and your MAGI is under $100k (phasing out to $0 by $150k); unused losses carry forward. On sale, claimed depreciation is recaptured at up to 25%, and gains may owe capital-gains tax (a 1031 exchange can defer both). Figures are a year-1 estimate at your 24.0% rate — not tax advice; consult a CPA.
Schools (NCES district)
- District
- Collinsville CUSD 10
- NCES district ID
- 1710650
- Math proficiency
- 14% ▼ -9.00%
- Reading proficiency
- 20% ▼ -7.00%
- Median HH income
- $52,504
- Composite
- 15.65/100
- National rank
- #9288
- State rank
- #465 of 620 in IL
Livability — Collinsville
- Score
- 67/100
- State rank
- #491
- US rank
- #10221
Category grades
Schools grade is shown separately in the Schools card above.
Census & demographics
- Census place
- Collinsville, IL
- County
- Madison County · 189,064 people
- City population
- 31,648
- Metro
- St. Louis, MO-IL
- Population (ZIP)
- 31,648
- Household income
- $69,607
- Rent vs Own
- Severe rent burden
- 801.0
Population outlook (Madison County) Hauer SSP2
- Today (2025)
- 258,371 people
- By 2030
- 251,523 · -2.7%
- By 2040
- 233,640 · -9.6%
- By 2050
- 213,042 · -17.5%
- By 2075
- 165,255 · -36.0%
- By 2100
- 123,953 · -52.0%
Race, ethnicity, and origin ACS 2023
- Neighborhood character
- Predominantly White (73%)
- Race & ethnicity
- White 73% Black 13% Hispanic / Latino 10% Two or more races 8%
- Hispanic origin (detail)
- Mexican 7%
- Common ancestry
- Romanian 3% Lithuanian 3% Slovak 1%
- Foreign-born
- 4% · Canada
- Languages at home
- 92% English-only · Spanish 6%
Political lean MEDSL · Madison
- 2024 margin
- R (+13.3) · D 42.5% · R 55.8% · Other 1.8%
- 2008→2024 swing
- -22.5pp toward R · 2008: 9.2pp · 2024: -13.3pp
- All cycles
- 2024: R+13.3 2020: R+13.2 2016: R+15.6 2012: R+1.4 2008: D+9.2
Not yet ingested
- Civics
- —
Market trends
- HPI YoY
- ▼ -46.21%
- Current HPI
- 223.6438
- Rent YoY
- ▲ 3.10%
- Metro
- St. Louis, MO-IL
- State GDP YoY
- ▲ 1.59%
- F500 in state
- 60
Industry mix (Fortune 500 HQ in IL)
| Industry | F500 HQs | Revenue |
|---|---|---|
| Insurance | 4 | $201B |
|
||
| Consumer Goods | 4 | $87B |
|
||
| Industrial Machinery | 3 | $64B |
|
||
| Healthcare | 2 | $55B |
|
||
| Retail / Pharmacy | 1 | $148B |
|
||
| Agriculture / Food | 1 | $86B |
|
||
Price history
1 event — show timeline
- 2026-06-04 Coming Soon $74,900 MARIS as Distributed by MLS Grid
Property tax history
-3.2%/yrLatest (2024): $694 · -2.9% YoY. Source: county tax records.
Cash-flow waterfall
monthlySold comps — $/sqft
last 12 mo · ≤1 miLoading sold comps…