1865 Sanie Rd · Odenville, AL
Flood risk 1/10 · Minimal
- FEMA flood zone
- X (unshaded)
- Chance of flooding over 30 yrs
- 0.0%
- Est. flood insurance / yr
- $507 – $1,088
Fire risk 5/10 · Moderate
- Est. fire insurance / yr
- $916 – $1,700
Heat risk 6/10 · Moderate
- Hot days now (above 106°F)
- 7 days/yr
- Hot days in 30 yrs
- 19 days/yr
Wind risk 6/10 · Moderate
- Chance of severe wind over 30 yrs
- 27.0%
Air-quality risk 4/10 · Minor
- Unhealthy air days now
- 4 days/yr
- Unhealthy air days in 30 yrs
- 6 days/yr
Risk factors via First Street. Map © Google.
Why this score? — see what drove the D+ grade
The composite is a weighted blend of 9 inputs, each scored 0–100. Each bar is that input's sub-score; the figure is the points it added to the 100-point composite (weight × sub-score).
- ARV discount +15.0/15.0
- Cash flow +14.2/30.0
- DSCR +4.3/10.0
- 1% rule +4.0/10.0
- Livability +3.4/5.0
- Schools +3.2/10.0
- Rent growth +2.6/5.0
- Condition / age +2.5/5.0
- Appreciation +0.0/10.0
$189,900
🖨 Deal sheet 📄 Offer letter ✓ Due diligence
Listing remarks
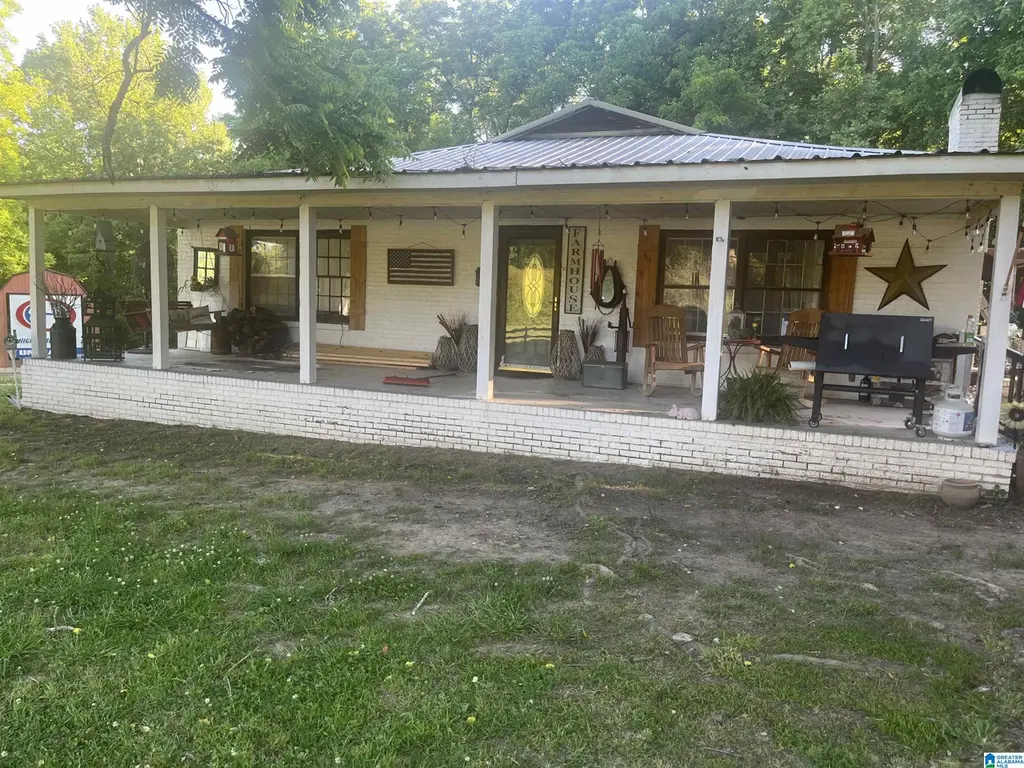
Who doesn't love a farmhouse??? Situated on 1 acre +/-. Wonderful opportunity to make this one your own dream home. Owners are mid renovation but offering this home as is for completion. CH & A has been recently replaced! Cozy front porch, scenic lot, Beautiful floors. This home has LOADS of potential! If you're handy, it might be for you. If you're not Handy it is eligible for FHA203K restoration loan. Come see this one today! It is priced to sell!!!
Key facts
- 0.8 acre lot
- Built 1966
- Listed 30 days
Property features AI
Finance
- Other: Parcel ID: 24-03-07-0-001-027.000
- Financial info: Quarterly garbage fee applies
- HOA & community: No association fee
Exterior
- Parking: Driveway parking
- Utilities: Public water; Septic system; Electric water heater; Internet available (Spectrum)
- Home design: Existing single-family property; 4-sided brick construction; Crawl space foundation
- Construction: 4-sided brick exterior; Crawl space foundation
- Exterior features: Front porch; Storage building; Approximately 0.8 acre lot; Not waterfront; No pool, patio, deck, or garden listed; Not in a flood plain
Interior
- Kitchen: Laminate countertops; Electric stove
- Bedrooms: Three bedrooms on the main level
- Flooring: Carpet and hardwood floors
- Bathrooms: One full bathroom with tub/shower combo
- Heating & cooling: Central heating; Central air conditioning
- Interior features: Smooth ceilings; Handyman special; Brick fireplace in the great room (wood-burning)
- Laundry & utility: Main-level laundry room; Washer hookup and electric dryer hookup; Attic access
Neighborhood map
What this means for you Summary
Snapshot
- This is a 3-bed/1.0-bath single-family listed at $190k.
Deal economics
- At list price, monthly cash flow is $33 ($395/yr) — positive.
- The deal already cash-flows at list — no discount required.
- To meet the 1% rule (rent ≥ 1% of price), the offer needs to be $170k (10.3% below list).
- Recommended offer: $170k (10.3% below list) — sets the bar for 1% rule.
- Cap rate 6.5% vs local median 4.7% in Odenville — top-decile yield for the area; either an underpriced asset or a hidden risk that comps aren't pricing in. Stress-test before assuming the spread holds.
Location & tenants
- Location reads 67/100 on livability (#80 in AL) — a middle-class / working-renter tenant base. Strengths: employment A+, cost of living A+, housing A+; Watch: amenities F, commute F, health & safety F.
- St Clair County (rural): math 21% / reading 52% proficiency, ranked #33 of 129 in AL (top 26%) — families likely to look elsewhere, expect single-tenant / working-renter base with shorter leases.
- Zoned schools: Margaret Elementary (math 29% / reading 57%, grade F, #204 of 627 statewide, top 33%, 727 students, 58% FRL); Saint Clair County High School (math 17% / reading 22%, grade F, #169 of 305 statewide, top 59%, 622 students, 58% FRL) — zoned schools average 58% FRL vs 41% district-wide (17 pts higher); higher-poverty schools than district average — tighter screening recommended.
- Market conditions: Rents flat; 292 active listings in the ZIP; 10 comparable units currently listed for rent nearby; rentals at typical pace (median 19d on market — plan ~3-4 weeks tenant-placement turnaround); 557 units permitted in St. Clair County in 2024 (0 in 5+ unit buildings).
Forward outlook
- Local home prices are declining (-3.0%/yr); year-one equity from $1k of loan paydown is wiped out by about $6k of value loss. Plan a longer hold.
- St. Clair County population projected at +11% by 2050 — modest demand growth; plan on rents tracking national, not racing it.
Negotiation context
- It's been on market 30 days — a 2% lower offer ($187k) is reasonable based on typical stale-listing flexibility.
Risks & watch-outs
- Climate carrying-cost: major wind risk, 27% chance of damaging wind over 30y; moderate wildfire risk; extreme-heat days projected 7→19/yr by 2055 (HVAC capex compounding) — expect insurance premiums to compound above CPI over the hold.
Questions for the listing agent
- Built in 1966 — when were the roof, HVAC, electrical panel, plumbing, and water heater last replaced?
- Is there a deadline driving the sale (1031 exchange, divorce, estate, relocation)? That informs how much negotiation room exists.
- Schools are D-rated, which usually means shorter tenancies and higher turnover. Who's the typical renter profile here, and what's been the actual vacancy rate?
- The area grade is low — what's the realistic commute time and amenity access for the typical tenant pool here? Any planned neighborhood developments (good or bad) we should know about?
- What's the average days-on-market for RENTAL listings here right now (not sales)? A rising rental-DOM trend means longer vacancies and softer asking-rent achievability than the comps imply.
- What's the recent tenant-quality profile in this submarket — average credit score on applications, eviction rate, late-payment / NSF rate, and stable-employment percentage? A property-management company in the area should have these aggregated.
- How much new for-sale + rental construction is in the pipeline within 1–3 miles? Heavy new supply typically softens prices + rents 12–24 months out; constrained supply supports both.
Investment metrics
- 1% rule
- 0.90% ✗
- Cap rate
- 6.50%
- Cash-on-cash
- 0.74%
- DSCR
- 1.03
- GRM
- 9.3
CMA / ARV
- ARV (on-the-fly)
- $265,598
- Comps found
- 12
Show comp detail 12 sales within ~0.75 mi
| Address | Dist | Beds/Ba | Sqft | Sold | Price | $/sf | Match |
|---|---|---|---|---|---|---|---|
| 1695 Sanie Rd | 0.14mi | 3/2.5 | 1,816 (+8%) | 6mo | $425,000 | $234 | 69 |
| 175 Sanie Cove Ln | 0.65mi | 3/2.0 | 1,740 (+4%) | 9mo | $287,680 | $165 | 52 |
| 220 Sanie Cove Ln | 0.71mi | 3/2.0 | 1,740 (+4%) | 6mo | $258,460 | $149 | 52 |
| 165 Sanie Cove Ln | 0.65mi | 3/2.0 | 1,740 (+4%) | 10mo | $275,190 | $158 | 52 |
| 210 Sanie Cove Ln | 0.71mi | 3/2.0 | 1,740 (+4%) | 7mo | $250,870 | $144 | 51 |
| 170 Sanie Cove Ln | 0.70mi | 3/2.0 | 1,740 (+4%) | 9mo | $253,070 | $145 | 50 |
| 160 Sanie Cove Ln | 0.70mi | 3/2.0 | 1,740 (+4%) | 9mo | $272,940 | $157 | 50 |
| 150 Sanie Cove Ln | 0.70mi | 3/2.0 | 1,740 (+4%) | 9mo | $259,995 | $149 | 50 |
| 145 Stone Cove Dr | 0.74mi | 3/2.0 | 1,530 (-9%) | 6mo | $279,900 | $183 | 42 |
| 215 Sanie Cove Ln | 0.65mi | 3/2.0 | 1,501 (-11%) | 8mo | $248,400 | $165 | 41 |
| 135 Sanie Cove Ln | 0.65mi | 3/2.0 | 1,501 (-11%) | 10mo | $234,885 | $156 | 40 |
| 515 Sterling Way | 0.74mi | 3/2.0 | 1,469 (-13%) | 11mo | $265,000 | $180 | 31 |
Match score weights: distance 35% · size 25% · config 20% · recency 20%. Top-matched comps best support the ARV.
Projected returns pro-forma
-3.0% appreciation · 0.49% rent growth · sell at horizon
- IRR
- -18.0%
- Equity multiple
- 0.38×
- Total profit
- $-32,845
- Equity at exit
- $28,315
- IRR
- -15.9%
- Equity multiple
- 0.21×
- Total profit
- $-42,168
- Equity at exit
- $16,419
Cash invested: $53,172 (down + closing). Projections, not guarantees.
Landlord ↔ Tenant lean methodology
- Overall (STATE)
- 90 Strongly Landlord-Friendly
- State Alabama
- 90 Strongly Landlord-Friendly · R+15
- County
- — inherits STATE
- City
- — inherits STATE
ZIP-level market 35120
- Home prices YoY
- -17.9%
- Rents YoY
- 0.5%
- Active inventory
- 292
- Price-to-rent
- 9.3×
Monthly cashflow live
- Estimated rent
- $1,703 high interval (Pro) →
- Mortgage (P&I)
- −$996
- Tax est. 1.5%
- −$237 /mo · $2,848/yr
- Insurance
- −$79
- HOA
- −$0
- Vacancy / Maint / Mgmt
- −$358
- Net cashflow
- $33
Break-even live
UW: 25.0% down · 7.5% · 30yr · 1.5% tax · 5.0% vac · 8.0% maint · 8.0% mgmt
Financing live
Cash to close
- Down payment
- $47,475
- Closing costs
- $5,697
- Reserves months
- —
- Total cash needed
- —
Loan-product check · same deal, 3 products live
Conventional
25% down · 7.5% · 30yr
- Down + closing
- —
- Monthly P&I
- —
- Monthly cashflow
- —
- DSCR
- —
- Eligible?
- —
Personal DTI + credit; lowest rate.
DSCR
20% down · 8.5% · 30yr
- Down + closing
- —
- Monthly P&I
- —
- Monthly cashflow
- —
- DSCR
- —
- Eligible?
- —
No personal income docs; deal must DSCR.
Hard money
10% down · 12.0% · 12mo
- Down + closing
- —
- Monthly P&I
- —
- Monthly cashflow
- —
- DSCR
- —
- Eligible?
- —
Short-term bridge; refi at stabilization.
Rent comps 10 comps
| Address | Beds | Baths | Sqft | Rent | $/sqft | DOM | Units | Dist |
|---|---|---|---|---|---|---|---|---|
| 814 Kent Dr Odenville, AL | 3.0 | 2.0 | 1450 | $1,599 | $1.10 | 3d | 1 | 1.01mi |
| 245 Hathaway Ln Odenville, AL | 3.0 | 2.0 | 1497 | $1,661 | $1.11 | 19d | 1 | 1.02mi |
| 819 Kent Dr Odenville, AL | 3.0 | 2.0 | 1106 | $1,475 | $1.33 | 23d | 1 | 1.03mi |
| 830 Kent Dr Odenville, AL | 3.0 | 2.0 | 1106 | $1,480 | $1.34 | 23d | 1 | 1.05mi |
| 50 Railroad Dr Odenville, AL | 3.0 | 2.0 | 1188 | $1,620 | $1.36 | 19d | 1 | 1.10mi |
| 860 Kent Dr Odenville, AL | 3.0 | 2.0 | 1081 | $1,475 | $1.36 | 21d | 1 | 1.11mi |
| 120 Pine Springs Rd Odenville, AL | 3.0 | 2.0 | 1312 | $1,426 | $1.09 | 3d | 1 | 1.23mi |
| 30 Sunset Cir Odenville, AL | 3.0 | 2.0 | 1502 | $1,595 | $1.06 | 3d | 1 | 1.24mi |
| 1055 Sky View Ln Odenville, AL | 3.0 | 2.0 | 1497 | $1,810 | $1.21 | 23d | 1 | 1.40mi |
| 855 Moonlite Dr Odenville, AL | 3.0 | 2.0 | 1488 | $1,765 | $1.19 | 19d | 1 | 1.45mi |
Listing history 15 events
-
2026-06-18days on market $189,900 Active 30 DOM
-
2026-06-17days on market $189,900 Active 29 DOM
-
2026-06-16days on market $189,900 Active 28 DOM
-
2026-06-15days on market $189,900 Active 27 DOM
-
2026-06-13days on market $189,900 Active 25 DOM
-
2026-06-10days on market $189,900 Active 22 DOM
-
2026-06-09days on market $189,900 Active 21 DOM
-
2026-06-08days on market $189,900 Active 20 DOM
-
2026-06-07days on market $189,900 Active 19 DOM
-
2026-06-03days on market $189,900 Active 15 DOM
-
2026-06-02days on market $189,900 Active 14 DOM
-
2026-06-01days on market $189,900 Active 13 DOM
-
2026-05-31days on market $189,900 Active 12 DOM
-
2026-05-17$189,900 Active
-
2026-01-25price $205,000
ⓘ Source: listings_history table (triggers on properties + properties_extension) + one-shot
backfill from property_details.listing_events for pre-trigger history.
Climate risk First Street
- Flood 1/10 Low FEMA zone X (unshaded) · 0% chance over 30 yrs
- Wildfire 5/10 Major
- Heat 6/10 Major 7 d/yr ≥106°F today · 19 d/yr by 30 yrs out
- Wind 6/10 Major 27% chance of damaging wind over 30 yrs
- Air quality 4/10 Moderate 4 unhealthy d/yr today · 6 by 30 yrs out
Nearby sold comps map
Loading sold comps map…
Walkable amenities ~0.75 mi
Loading nearby amenities…
Taxation est. · year 1
- Rental income
- $20,435
- − Mortgage interest
- −$10,637
- − Property taxes
- −$2,848
- − Insurance
- −$950
- − Repairs & maintenance
- −$1,635
- − Management
- −$1,635
- − Depreciation
- −$5,524
- Taxable loss
- −$2,795
- Est. tax savings @ 24.0%
- +$671
- After-tax cash flow
- $1,066/yr
For passive investors: Depreciation is non-cash, so a rental often shows a tax loss while cash-flowing — sheltering income. Rental losses are passive: they offset passive income freely, and up to $25,000/yr can offset ordinary (W-2) income if you actively participate and your MAGI is under $100k (phasing out to $0 by $150k); unused losses carry forward. On sale, claimed depreciation is recaptured at up to 25%, and gains may owe capital-gains tax (a 1031 exchange can defer both). Figures are a year-1 estimate at your 24.0% rate — not tax advice; consult a CPA.
Schools (NCES district)
- District
- St Clair County
- NCES district ID
- 0103062
- Math proficiency
- 21% ▼ -34.00%
- Reading proficiency
- 52% ▬ 0.00%
- Median HH income
- $53,324
- Composite
- 31.79/100
- National rank
- #5887
- State rank
- #33 of 129 in AL
Livability — Odenville
- Score
- 67/100
- State rank
- #80
- US rank
- #10630
Category grades
Schools grade is shown separately in the Schools card above.
Census & demographics
- County
- Saint Clair County · 54,404 people
- City population
- 17,730
- Metro
- Birmingham-Hoover, AL
- Population (ZIP)
- 17,730
- Household income
- $74,352
- Rent vs Own
- Severe rent burden
- 109.0
Population outlook (St. Clair County) Hauer SSP2
- Today (2025)
- 94,158 people
- By 2030
- 97,008 · +3.0%
- By 2040
- 101,615 · +7.9%
- By 2050
- 104,537 · +11.0%
- By 2075
- 109,350 · +16.1%
- By 2100
- 106,785 · +13.4%
Race, ethnicity, and origin ACS 2023
- Neighborhood character
- Predominantly White (87%)
- Race & ethnicity
- White 87% Black 8% Two or more races 4% Hispanic / Latino 2%
- Common ancestry
- Serbian 2% Slovak 2% Lithuanian 2%
- Foreign-born
- 0%
- Languages at home
- 99% English-only · Spanish 1%
Political lean MEDSL · St. Clair
- 2024 margin
- Solid R (+64.1) · D 17.6% · R 81.7%
- 2008→2024 swing
- -0.9pp no change · 2008: -63.2pp · 2024: -64.1pp
- All cycles
- 2024: R+64.1 2020: R+64.0 2016: R+68.6 2012: R+66.1 2008: R+63.2
Not yet ingested
- Civics
- —
Market trends
- HPI YoY
- ▼ -38.39%
- Current HPI
- 175.5104
- Rent YoY
- ▲ 0.49%
- Metro
- Birmingham-Hoover, AL
- State GDP YoY
- ▲ 2.94%
- F500 in state
- 4
Industry mix (Fortune 500 HQ in AL)
| Industry | F500 HQs | Revenue |
|---|---|---|
| Financial Services | 1 | $8B |
|
||
| Healthcare | 1 | $5B |
|
||
Price history
-7.4% since first listed2 events — show timeline
- 2026-05-17 Listed $189,900 Greater Alabama MLS
- 2026-01-25 Price Changed $205,000 Greater Alabama MLS
Property tax history
-0.4%/yrLatest (2025): $233 · +0.0% YoY. Source: county tax records.
Cash-flow waterfall
monthlySold comps — $/sqft
last 12 mo · ≤1 miLoading sold comps…