 Duplex
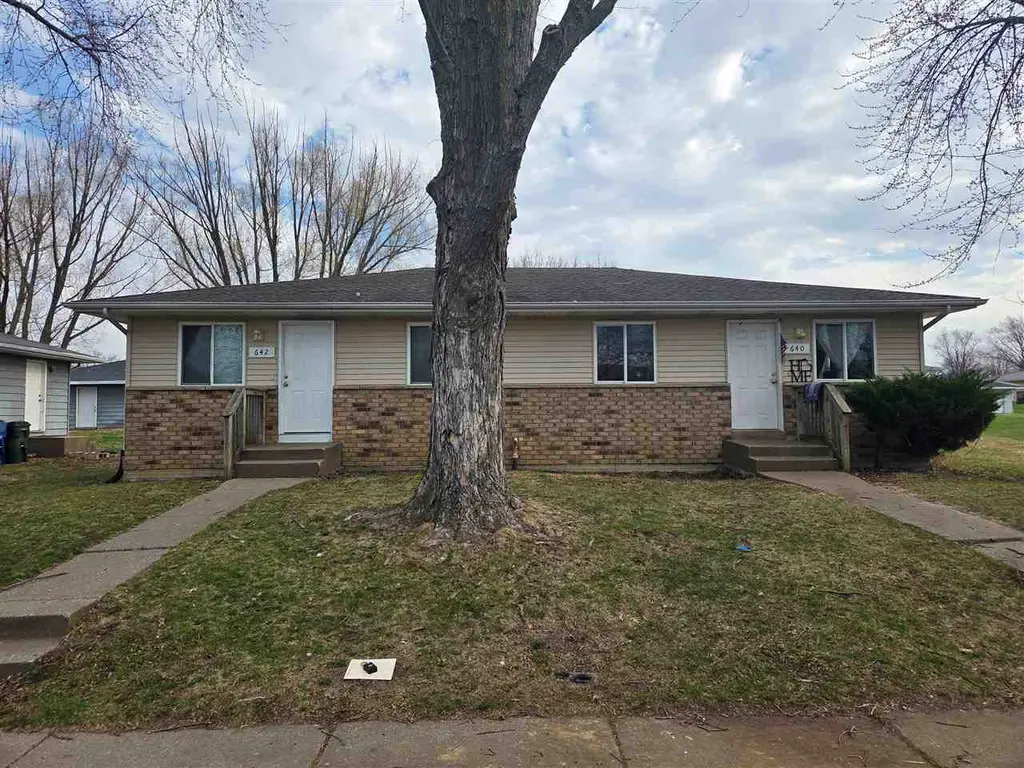
640/642 W 61st St · Davenport, IA
Flood risk 1/10 · Minimal
- FEMA flood zone
- X (unshaded)
- Chance of flooding over 30 yrs
- 0.0%
- Est. flood insurance / yr
- $473 – $860
Fire risk 1/10 · Minimal
- Est. fire insurance / yr
- $902 – $1,676
Heat risk 3/10 · Minor
- Hot days now (above 104°F)
- 7 days/yr
- Hot days in 30 yrs
- 16 days/yr
Wind risk 2/10 · Minimal
- Chance of severe wind over 30 yrs
- —
Air-quality risk 3/10 · Minor
- Unhealthy air days now
- 2 days/yr
- Unhealthy air days in 30 yrs
- 3 days/yr
Risk factors via First Street. Map © Google.
Why this score? — see what drove the C- grade
The composite is a weighted blend of 9 inputs, each scored 0–100. Each bar is that input's sub-score; the figure is the points it added to the 100-point composite (weight × sub-score).
- Cash flow +21.0/30.0
- ARV discount +7.5/15.0
- DSCR +6.7/10.0
- 1% rule +6.3/10.0
- Livability +4.0/5.0
- Schools +3.9/10.0
- Rent growth +3.0/5.0
- Condition / age +2.5/5.0
- Appreciation +0.0/10.0
$160,000
🖨 Deal sheet (PDF) 📄 Offer letter ✓ Due diligence
Multi-family units
County records classify this as Multi-Family (2-4 Unit). Listing-text estimate: 2 units. confirmed
Listing remarks MLS
Ranch duplex 2 bedroom 1 bath with 2 car garage property sold" as is"24 hr notice to show com box on door
Key facts
- 0.24 acre lot
- 2 parking spots
- Built 1979
Property features AI
Finance
- Financial info: $925 total rent reported for one unit (as listed)
- HOA & community: Association fee billed annually
Exterior
- Parking: 2 parking spaces total
- Security: Smoke detectors
- Utilities: Public water; Public sewer
- Home design: Residential multi-family property; Single-story building
- Construction: Vinyl siding and frame construction
- Exterior features: Front porch; Sloped lot; Sidewalks in the community
Interior
- Kitchen: Refrigerator included
- Bedrooms: Units include living room and dining room configurations (varies by unit)
- Flooring: Laminate
- Bathrooms: Some units have 1 bathroom; no half or 3/4 baths reported in unit descriptions
- Heating & cooling: Central air conditioning; Heating by electric and natural gas with forced air
- Interior features: Refrigerator, Washer, Dryer included; Laminate flooring; No fireplace
- Laundry & utility: Laundry located in basement
Neighborhood map
What this means for you Summary
Snapshot
- This is a 2 × 2-bed/1-bath units multifamily listed at $160k.
Deal economics
- At list price, monthly cash flow is $226 ($3k/yr) — positive. Per door: $113/mo.
- The deal already cash-flows at list — no discount required.
- Meets the 1% rule at list price ($2k rent vs $160k).
- Recommended offer: $158k (1.5% below list) — sets the bar for market timing.
- Cap rate 8.0% vs local median 4.4% in Davenport — top-decile yield for the area; either an underpriced asset or a hidden risk that comps aren't pricing in. Stress-test before assuming the spread holds.
Location & tenants
- Location reads 79/100 on livability (#126 in IA, #2,312 nationally) — a middle-class / working-renter tenant base. Strengths: cost of living A+, housing A+, health & safety A+; Watch: employment C-, crime F.
- Davenport Community School District (urban): math 43% / reading 50% proficiency, ranked #288 of 289 in IA (top 100%) — families likely to look elsewhere, expect single-tenant / working-renter base with shorter leases.
- Market conditions: Rents rising (+1.8%/yr); 162 active listings in the ZIP; 2 comparable units currently listed for rent nearby; 805 units permitted in Scott County in 2024 (479 in 5+ unit buildings).
Forward outlook
- Local home prices are declining (-3.0%/yr); year-one equity from $1k of loan paydown is wiped out by about $5k of value loss. Plan a longer hold.
- Scott County population projected at +19% by 2050 — long-run rental-demand tailwind backs the buy-and-hold thesis.
Negotiation context
- It's been on market 18 days — a 2% lower offer ($158k) is reasonable based on typical stale-listing flexibility.
- 5 sale attempts since 18y ago; this cycle's ask is 3% above the opening price — seller raised mid-cycle; expect resistance to lowballs.
Questions for the listing agent
- Can we see the unit-by-unit rent roll, current vacancy, and any below-market leases? What's the average tenancy length?
- What capital expenditures (roof, boiler, parking lot, exteriors) have been made in the last 5 years, and what's planned in the next 2?
- Built in 1979 — when were the roof, HVAC, electrical panel, plumbing, and water heater last replaced?
- Is there a deadline driving the sale (1031 exchange, divorce, estate, relocation)? That informs how much negotiation room exists.
- Crime grade is F in this area — have there been break-ins, vandalism, or insurance claims at this property in the last 3 years? What carrier currently insures it and at what premium?
- What's the average days-on-market for RENTAL listings here right now (not sales)? A rising rental-DOM trend means longer vacancies and softer asking-rent achievability than the comps imply.
- What's the recent tenant-quality profile in this submarket — average credit score on applications, eviction rate, late-payment / NSF rate, and stable-employment percentage? A property-management company in the area should have these aggregated.
- How much new apartment / multifamily construction is in the pipeline within 1–3 miles? Heavy new supply (>2% of stock underway) typically softens rents 12–24 months out; light construction supports rent growth.
Investment metrics
- 1% rule
- 1.13% ✓
- Cap rate
- 7.99%
- Cash-on-cash
- 6.04%
- DSCR
- 1.27
- GRM
- 7.4
CMA / ARV
No comps found within radius.
Projected returns pro-forma
-3.0% appreciation · 1.8% rent growth · sell at horizon
- IRR
- -8.4%
- Equity multiple
- 0.70×
- Total profit
- $-13,628
- Equity at exit
- $23,857
- IRR
- -0.6%
- Equity multiple
- 0.96×
- Total profit
- $-1,655
- Equity at exit
- $13,834
Cash invested: $44,800 (down + closing). Projections, not guarantees.
Landlord ↔ Tenant lean methodology
- Overall (STATE)
- 83 Strongly Landlord-Friendly
- State Iowa
- 83 Strongly Landlord-Friendly · R+6
- County
- — inherits STATE
- City
- — inherits STATE
ZIP-level market 52806
- Rents YoY
- 1.8%
- Active inventory
- 162
- Price-to-rent
- 14.7×
Monthly cashflow live
- Estimated rent
- $1,810 high interval (Pro) →
- Mortgage (P&I)
- −$839
- Tax from tax record
- −$299 /mo · $3,582/yr
- Insurance
- −$67
- HOA
- −$0
- Vacancy / Maint / Mgmt
- −$380
- Net cashflow
- $226
Break-even live
Sensitivity live
| Price | -10% $316 | -5% $271 | +0% $226 | +5% $180 | +10% $135 |
|---|---|---|---|---|---|
| Rent | -10% $83 | -5% $154 | +0% $226 | +5% $297 | +10% $369 |
| Rate | -1.0pp $306 | -0.5pp $266 | base $226 | +0.5pp $184 | +1.0pp $142 |
2-unit breakdown (identical units grouped — click to expand)
| Units | Beds | Baths | Est. rent |
|---|---|---|---|
| 2× units | 2 | 1 | $1,810 |
| #1 | 2 | 1 | $905 |
| #2 | 2 | 1 | $905 |
| Total (2 units) | $1,810 | ||
UW: 25.0% down · 7.5% · 30yr · 1.5% tax · 5.0% vac · 8.0% maint · 8.0% mgmt
Financing live
Cash to close
- Down payment
- $40,000
- Closing costs
- $4,800
- Reserves months
- —
- Total cash needed
- —
Loan-product check · same deal, 3 products live
Conventional
25% down · 7.5% · 30yr
- Down + closing
- —
- Monthly P&I
- —
- Monthly cashflow
- —
- DSCR
- —
- Eligible?
- —
Personal DTI + credit; lowest rate.
DSCR
20% down · 8.5% · 30yr
- Down + closing
- —
- Monthly P&I
- —
- Monthly cashflow
- —
- DSCR
- —
- Eligible?
- —
No personal income docs; deal must DSCR.
Hard money
10% down · 12.0% · 12mo
- Down + closing
- —
- Monthly P&I
- —
- Monthly cashflow
- —
- DSCR
- —
- Eligible?
- —
Short-term bridge; refi at stabilization.
Rent comps 2 comps
| Address | Beds | Baths | Sqft | Rent | $/sqft | DOM | Units | Dist |
|---|---|---|---|---|---|---|---|---|
| 5337 Villa Dr Davenport, IA | 2.0–3.0 | 2.5 | 1650 | $2,045 | $1.24 | 14d | 1 | 0.97mi |
| 105 Colony Dr Davenport, IA | 3.0 | 2.5 | 1500 | $1,700 | $1.13 | 45d | 1 | 1.22mi |
Listing history 13 events
-
2026-06-21days on market $160,000 Active 18 DOM
-
2026-06-18days on market $160,000 Active 15 DOM
-
2026-06-17days on market $160,000 Active 14 DOM
-
2026-06-16days on market $160,000 Active 13 DOM
-
2026-06-15days on market $160,000 Active 12 DOM
-
2026-06-14days on market $160,000 Active 10 DOM
-
2026-06-13days on market $160,000 Active 9 DOM
-
2026-06-10days on market $160,000 Active 7 DOM
-
2026-06-09days on market $160,000 Active 6 DOM
-
2026-06-08days on market $160,000 Active 5 DOM
-
2026-06-07pricedays on market $160,000 Active 4 DOM
-
2026-06-03remarks 237-char remark
-
2026-06-03$155,000 Active 1 DOM
ⓘ Source: listings_history table (triggers on properties + properties_extension) + one-shot
backfill from property_details.listing_events for pre-trigger history.
Tax reassessment forecast IA · Partial reset (capped growth)
- Current annual tax
- $3,582 · $299/mo
- Projected year-2 tax
- $3,582 · $299/mo
- Expected delta
- $0/yr ($0/mo · 0.0%)
ⓘ Screening estimate from a state-policy table — verify with the county assessor before closing.
Climate risk First Street
- Flood 1/10 Low FEMA zone X (unshaded) · 0% chance over 30 yrs
- Wildfire 1/10 Low
- Heat 3/10 Moderate 7 d/yr ≥104°F today · 16 d/yr by 30 yrs out
- Wind 2/10 Low
- Air quality 3/10 Moderate 2 unhealthy d/yr today · 3 by 30 yrs out
Nearby sold comps map
Loading sold comps map…
Walkable amenities ~0.75 mi
Loading nearby amenities…
Taxation est. · year 1
- Rental income
- $21,720
- − Mortgage interest
- −$8,962
- − Property taxes
- −$3,582
- − Insurance
- −$800
- − Repairs & maintenance
- −$1,738
- − Management
- −$1,738
- − Depreciation
- −$4,655
- Taxable income
- $245
- Est. tax owed @ 24.0%
- −$59
- After-tax cash flow
- $2,649/yr
For passive investors: Depreciation is non-cash, so a rental often shows a tax loss while cash-flowing — sheltering income. Rental losses are passive: they offset passive income freely, and up to $25,000/yr can offset ordinary (W-2) income if you actively participate and your MAGI is under $100k (phasing out to $0 by $150k); unused losses carry forward. On sale, claimed depreciation is recaptured at up to 25%, and gains may owe capital-gains tax (a 1031 exchange can defer both). Figures are a year-1 estimate at your 24.0% rate — not tax advice; consult a CPA.
Schools (NCES district)
- District
- Davenport Community School District
- NCES district ID
- 1908580
- Math proficiency
- 43% ▼ -11.00%
- Reading proficiency
- 50% ▼ -3.00%
- Median HH income
- $46,157
- Composite
- 39.49/100
- National rank
- #3951
- State rank
- #288 of 289 in IA
Livability — Davenport
- Score
- 79/100
- State rank
- #126
- US rank
- #2312
Category grades
Schools grade is shown separately in the Schools card above.
Census & demographics
- Census place
- Davenport, IA
- County
- Scott County · 144,583 people
- City population
- 103,319
- Metro
- Davenport-Moline-Rock Island, IA-IL
- Population (ZIP)
- 26,871
- Household income
- $74,297
- Rent vs Own
- Severe rent burden
- 735.0
Population outlook (Scott County) Hauer SSP2
- Today (2025)
- 188,878 people
- By 2030
- 196,648 · +4.1%
- By 2040
- 210,860 · +11.6%
- By 2050
- 224,359 · +18.8%
- By 2075
- 258,884 · +37.1%
- By 2100
- 286,447 · +51.7%
Race, ethnicity, and origin ACS 2023
- Neighborhood character
- Predominantly White (74%)
- Race & ethnicity
- White 74% Black 12% Hispanic / Latino 7% Two or more races 7% Asian 2%
- Hispanic origin (detail)
- Mexican 6%
- Common ancestry
- Slovak 2% Lithuanian 2% Iranian 1%
- Foreign-born
- 4% · Canada, Vietnam, China
- Languages at home
- 93% English-only · Spanish 3% Vietnamese 1% Chinese 1%
Political lean MEDSL · Scott
- 2024 margin
- Toss-up / Even · D 47.3% · R 51.2% · Other 1.4%
- 2008→2024 swing
- -18.4pp toward R · 2008: 14.6pp · 2024: -3.9pp
- All cycles
- 2024: R+3.9 2020: D+3.5 2016: D+1.4 2012: D+13.8 2008: D+14.6
Not yet ingested
- Civics
- —
Market trends
- HPI YoY
- ▼ -127.41%
- Current HPI
- 185.0808
- Rent YoY
- ▲ 1.80%
- Metro
- Davenport-Moline-Rock Island, IA-IL
- State GDP YoY
- ▲ 2.48%
- F500 in state
- 4
Industry mix (Fortune 500 HQ in IA)
| Industry | F500 HQs | Revenue |
|---|---|---|
| Financial Services | 1 | $16B |
|
||
| Retail / Convenience | 1 | $15B |
|
||
Price history
+40.9% since first listed14 events — show timeline
- 2026-06-03 Listed $155,000 ICAARMLS
- 2025-06-05 Sold (Public Records) $146,000 Public Records
- 2025-04-30 Sold (MLS) $146,000 RMLSA as Distributed by MLS Grid
- 2025-04-30 Sold (MLS) $146,000 MRED as Distributed by MLS Grid
- 2025-01-21 Pending — RMLSA as Distributed by MLS Grid
- 2025-01-13 Listed $149,900 RMLSA as Distributed by MLS Grid
- 2025-01-13 Listed $149,900 MRED as Distributed by MLS Grid
- 2021-08-06 Listing Removed — RMLSA as Distributed by MLS Grid
- 2008-05-27 Sold (MLS) $40,000 MRED as Distributed by MLS Grid
- 2008-05-27 Sold (MLS) $40,000 RMLSA as Distributed by MLS Grid
- 2008-04-16 Listed $63,000 MRED as Distributed by MLS Grid
- 2008-04-16 Listed $63,000 RMLSA as Distributed by MLS Grid
- 2007-03-01 Listing Removed — MRED as Distributed by MLS Grid
- 2006-05-25 Sold (Public Records) $110,000 Public Records
Property tax history
+10.2%/yrLatest (2025): $3,582 · +12.7% YoY. Source: county tax records.
Cash-flow waterfall
monthlySold comps — $/sqft
last 12 mo · ≤1 miLoading sold comps…