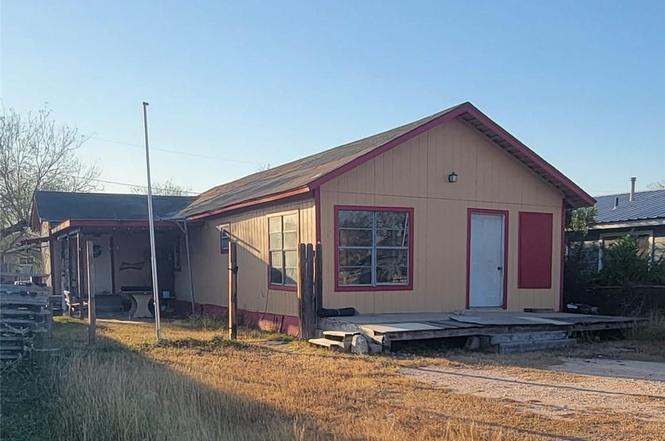
1451 S Vermont Ave · Mercedes, TX
Flood risk 1/10 · Minimal
- FEMA flood zone
- X (shaded)
- Chance of flooding over 30 yrs
- 0.0%
- Est. flood insurance / yr
- $507 – $1,088
Fire risk 2/10 · Minimal
- Est. fire insurance / yr
- $1,222 – $2,270
Heat risk 9/10 · Severe
- Hot days now (above 110°F)
- 7 days/yr
- Hot days in 30 yrs
- 22 days/yr
Wind risk 8/10 · Major
- Chance of severe wind over 30 yrs
- 99.0%
Air-quality risk 1/10 · Minimal
- Unhealthy air days now
- 0 days/yr
- Unhealthy air days in 30 yrs
- 0 days/yr
Risk factors via First Street. Map © Google.
Why this score? — see what drove the B grade
The composite is a weighted blend of 9 inputs, each scored 0–100. Each bar is that input's sub-score; the figure is the points it added to the 100-point composite (weight × sub-score).
- Cash flow +30.0/30.0
- 1% rule +10.0/10.0
- DSCR +10.0/10.0
- ARV discount +7.5/15.0
- Appreciation +7.3/10.0
- Livability +3.4/5.0
- Rent growth +2.5/5.0
- Condition / age +2.5/5.0
- Schools +1.3/10.0
$54,800
🖨 Deal sheet (PDF) 📄 Offer letter ✓ Due diligence
Listing remarks
Great opportunity in the growing city of Mercedes! This 4 bedroom, 1 bathroom home sits on a generously sized lot with plenty of space to expand, add value, or create your ideal outdoor setup. Perfect for a handyman looking to customize and make it their own, or for an investor searching for the next profitable flip. With solid potential, a great price point, and a convenient location near schools, shopping, and expressway access, this property offers strong upside. Bring your vision and transform this property into something special. Opportunities like this at this price don’t last long!
Key facts
- Generously sized lot
- 7,501 sq ft lot
- Parking
Tags
Neighborhood map
What this means for you Summary
Snapshot
- This is a 2-bed/1.0-bath single-family listed at $55k.
Deal economics
- At list price, monthly cash flow is $386 ($5k/yr) — positive.
- The deal already cash-flows at list — no discount required.
- Meets the 1% rule at list price ($1k rent vs $55k).
- Recommended offer: $53k (3.0% below list) — sets the bar for market timing.
- Cap rate 14.7% vs local median 3.4% in Mercedes — top-decile yield for the area; either an underpriced asset or a hidden risk that comps aren't pricing in. Stress-test before assuming the spread holds.
Location & tenants
- Location reads 67/100 on livability (#547 in TX) — a middle-class / working-renter tenant base. Strengths: cost of living A+, housing A+, health & safety A+; Watch: crime F, amenities F, commute F.
- Mercedes ISD (suburban): math 12% / reading 21% proficiency, ranked #811 of 826 in TX (top 98%) — low school quality limits family demand, transient renter base, plan for 1-2y turnover; 80% free/reduced lunch — lower-income household profile, screen leases tightly.
- Zoned schools: Travis El (math 17% / reading 22%, grade F, #3,583 of 4,322 statewide, top 86%, 506 students, 91% FRL); Sgt Manuel Chacon Middle (math 16% / reading 26%, grade F, #1,387 of 1,662 statewide, top 85%, 563 students, 87% FRL); Mercedes H S (math 8% / reading 12%, grade F, #1,591 of 1,632 statewide, top 98%, 974 students, 91% FRL).
- Market conditions: 393 active listings in the ZIP; 2 comparable units currently listed for rent nearby; 7,378 units permitted in Hidalgo County in 2024 (641 in 5+ unit buildings).
Forward outlook
- In year one you build about $3k of equity ($379 loan paydown + $2k appreciation (4.5% local appreciation)).
- Hidalgo County population projected at +28% by 2050 — long-run rental-demand tailwind backs the buy-and-hold thesis.
- At projected returns (4.5% appreciation + 3.0% rent growth), your $15k cash investment doubles in ~2 years — after that, you're playing with house money.
Negotiation context
- It's been on market 43 days — a 3% lower offer ($53k) is reasonable based on typical stale-listing flexibility.
- 2 sale attempts; this cycle's ask has dropped $13k (19%) from the opening price — seller is motivated, your offer sets the floor, not the list.
Risks & watch-outs
- Watch-outs: property tax is 4.8% of price.
- Climate carrying-cost: severe wind risk, 99% chance of damaging wind over 30y; extreme-heat days projected 7→22/yr by 2055 (HVAC capex compounding) — expect insurance premiums to compound above CPI over the hold.
Questions for the listing agent
- It's been on market 43 days. Have you received any prior offers? Is the seller open to a 3% concession, seller financing, or rate buy-down credit?
- Property tax is high relative to price — has the assessment been appealed recently, and will the sale trigger a re-assessment?
- Is there a deadline driving the sale (1031 exchange, divorce, estate, relocation)? That informs how much negotiation room exists.
- Schools are D-rated, which usually means shorter tenancies and higher turnover. Who's the typical renter profile here, and what's been the actual vacancy rate?
- Crime grade is F in this area — have there been break-ins, vandalism, or insurance claims at this property in the last 3 years? What carrier currently insures it and at what premium?
- What's the average days-on-market for RENTAL listings here right now (not sales)? A rising rental-DOM trend means longer vacancies and softer asking-rent achievability than the comps imply.
- What's the recent tenant-quality profile in this submarket — average credit score on applications, eviction rate, late-payment / NSF rate, and stable-employment percentage? A property-management company in the area should have these aggregated.
- How much new for-sale + rental construction is in the pipeline within 1–3 miles? Heavy new supply typically softens prices + rents 12–24 months out; constrained supply supports both.
Investment metrics
- 1% rule
- 2.12% ✓
- Cap rate
- 14.75%
- Cash-on-cash
- 30.20%
- DSCR
- 2.34
- GRM
- 3.9
CMA / ARV
- ARV (on-the-fly)
- $199,092
- Comps found
- 6
Show comp detail 6 sales within ~0.75 mi
| Address | Dist | Beds/Ba | Sqft | Sold | Price | $/sf | Match |
|---|---|---|---|---|---|---|---|
| 856 S Vermont Ave | 0.42mi | 3/2.0 (+1) | 1,420 (+1%) | 5mo | $155,000 | $109 | 67 |
| 837 S Virginia Ave | 0.53mi | 3/2.0 (+1) | 1,396 (-1%) | 7mo | $220,000 | $158 | 59 |
| 1101 S Washington Ave | 0.32mi | 3/2.0 (+1) | 1,268 (-10%) | 13mo | $179,000 | $141 | 48 |
| 616 S Vermont Ave | 0.60mi | 3/2.0 (+1) | 1,367 (-3%) | 20mo | $89,000 | $65 | 41 |
| 724 S Virginia Ave | 0.62mi | 3/2.0 (+1) | 1,232 (-13%) | 10mo | $115,000 | $93 | 33 |
| 812 S Texas Ave | 0.67mi | 3/2.0 (+1) | 1,560 (+10%) | 18mo | $220,000 | $141 | 27 |
Match score weights: distance 35% · size 25% · config 20% · recency 20%. Top-matched comps best support the ARV.
Projected returns pro-forma
4.53% appreciation · 3.0% rent growth · sell at horizon
- IRR
- 38.7%
- Equity multiple
- 3.34×
- Total profit
- $35,863
- Equity at exit
- $29,488
- IRR
- 37.3%
- Equity multiple
- 6.74×
- Total profit
- $88,109
- Equity at exit
- $49,641
Cash invested: $15,344 (down + closing). Projections, not guarantees.
Landlord ↔ Tenant lean methodology
- Overall (STATE)
- 87 Strongly Landlord-Friendly
- State Texas
- 87 Strongly Landlord-Friendly · R+5
- County
- — inherits STATE
- City
- — inherits STATE
ZIP-level market 78570
- Home prices YoY
- 1.9%
- Active inventory
- 393
- Price-to-rent
- 3.9×
Monthly cashflow live
- Estimated rent
- $1,161 medium interval (Pro) →
- Mortgage (P&I)
- −$287
- Tax from tax record
- −$221 /mo · $2,647/yr
- Insurance
- −$23
- HOA
- −$0
- Lot rent
- −$0
- Vacancy / Maint / Mgmt
- −$244
- Net cashflow
- $386
Break-even live
Sensitivity live
| Price | -10% $576 | -5% $557 | +0% $386 | +5% $371 | +10% $355 |
|---|---|---|---|---|---|
| Rent | -10% $294 | -5% $340 | +0% $386 | +5% $432 | +10% $478 |
| Rate | -1.0pp $414 | -0.5pp $400 | base $386 | +0.5pp $372 | +1.0pp $358 |
UW: 25.0% down · 7.5% · 30yr · 1.5% tax · 5.0% vac · 8.0% maint · 8.0% mgmt
Financing live
Cash to close
- Down payment
- $13,700
- Closing costs
- $1,644
- Reserves months
- —
- Total cash needed
- —
Loan-product check · same deal, 3 products live
Conventional
25% down · 7.5% · 30yr
- Down + closing
- —
- Monthly P&I
- —
- Monthly cashflow
- —
- DSCR
- —
- Eligible?
- —
Personal DTI + credit; lowest rate.
DSCR
20% down · 8.5% · 30yr
- Down + closing
- —
- Monthly P&I
- —
- Monthly cashflow
- —
- DSCR
- —
- Eligible?
- —
No personal income docs; deal must DSCR.
Hard money
10% down · 12.0% · 12mo
- Down + closing
- —
- Monthly P&I
- —
- Monthly cashflow
- —
- DSCR
- —
- Eligible?
- —
Short-term bridge; refi at stabilization.
Rent comps 2 comps
| Address | Beds | Baths | Sqft | Rent | $/sqft | DOM | Units | Dist |
|---|---|---|---|---|---|---|---|---|
| 941 S Indiana Ave Unit A Mercedes, TX | 2.0 | 2.0 | 1834 | $925 | $0.50 | 46d | 1 | 0.37mi |
| 189 Lago Vista St Mercedes, TX | 2.0 | 2.0 | 1164 | $2,000 | $1.72 | 46d | 1 | 1.39mi |
Listing history 11 events
-
2026-05-07soldstatus
-
2026-04-02status Pending
-
2026-03-23price $54,800
-
2026-03-10price $58,000
-
2026-03-01price $63,000
-
2026-02-18$68,000 Active
-
2025-12-17price $79,500
-
2025-11-18$84,500 Active
-
2022-10-25soldstatus
-
2011-03-02soldstatus
-
2001-05-07soldstatus
ⓘ Source: listings_history table (triggers on properties + properties_extension) + one-shot
backfill from property_details.listing_events for pre-trigger history.
Tax reassessment forecast TX · Resets to sale price
- Current annual tax
- $2,647 · $221/mo
- Projected year-2 tax
- $2,647 · $221/mo
- Expected delta
- $0/yr ($0/mo · 0.0%)
ⓘ Screening estimate from a state-policy table — verify with the county assessor before closing.
Climate risk First Street
- Flood 1/10 Low FEMA zone X (shaded) · 0% chance over 30 yrs
- Wildfire 2/10 Low
- Heat 9/10 Extreme 7 d/yr ≥110°F today · 22 d/yr by 30 yrs out
- Wind 8/10 Severe 99% chance of damaging wind over 30 yrs
- Air quality 1/10 Low 0 unhealthy d/yr today · 0 by 30 yrs out
Nearby sold comps map
Loading sold comps map…
Walkable amenities ~0.75 mi
Loading nearby amenities…
Taxation est. · year 1
- Rental income
- $13,929
- − Mortgage interest
- −$3,070
- − Property taxes
- −$2,647
- − Insurance
- −$274
- − Repairs & maintenance
- −$1,114
- − Management
- −$1,114
- − Depreciation
- −$1,594
- Taxable income
- $4,115
- Est. tax owed @ 24.0%
- −$988
- After-tax cash flow
- $3,646/yr
For passive investors: Depreciation is non-cash, so a rental often shows a tax loss while cash-flowing — sheltering income. Rental losses are passive: they offset passive income freely, and up to $25,000/yr can offset ordinary (W-2) income if you actively participate and your MAGI is under $100k (phasing out to $0 by $150k); unused losses carry forward. On sale, claimed depreciation is recaptured at up to 25%, and gains may owe capital-gains tax (a 1031 exchange can defer both). Figures are a year-1 estimate at your 24.0% rate — not tax advice; consult a CPA.
Schools (NCES district)
- District
- Mercedes ISD
- NCES district ID
- 4830250
- Math proficiency
- 12% ▼ -26.00%
- Reading proficiency
- 21% ▼ -10.00%
- Median HH income
- $27,606
- Composite
- 12.84/100
- National rank
- #9596
- State rank
- #811 of 826 in TX
Livability — Mercedes
- Score
- 67/100
- State rank
- #547
- US rank
- #10619
Category grades
Schools grade is shown separately in the Schools card above.
Census & demographics
- Census place
- Mercedes, TX
- City population
- 33,596
- Population (ZIP)
- 33,596
Population outlook (Hidalgo County) Hauer SSP2
- Today (2025)
- 955,232 people
- By 2030
- 1,009,774 · +5.7%
- By 2040
- 1,120,332 · +17.3%
- By 2050
- 1,225,036 · +28.2%
- By 2075
- 1,439,189 · +50.7%
- By 2100
- 1,533,429 · +60.5%
Race, ethnicity, and origin ACS 2023
- Neighborhood character
- Predominantly Hispanic (96%)
- Race & ethnicity
- Hispanic / Latino 96% Two or more races 44% White 4%
- Hispanic origin (detail)
- Mexican 91%
- Foreign-born
- 20% · Canada
- Languages at home
- 18% English-only · Spanish 82%
Political lean MEDSL · Hidalgo
- 2024 margin
- Toss-up / Even · D 48.1% · R 51.0%
- 2008→2024 swing
- -41.6pp toward R · 2008: 38.7pp · 2024: -2.9pp
- All cycles
- 2024: R+2.9 2020: D+17.1 2016: D+40.5 2012: D+41.8 2008: D+38.7
Not yet ingested
- Civics
- —
Market trends
- HPI YoY
- ▲ 4.53%
- Current HPI
- 238.8386
- Rent YoY
- —
- Metro
- —
- State GDP YoY
- ▲ 3.95%
- F500 in state
- 110
Industry mix (Fortune 500 HQ in TX)
| Industry | F500 HQs | Revenue |
|---|---|---|
| Energy | 16 | $1,198B |
|
||
| Technology | 5 | $198B |
|
||
| Engineering / Construction | 4 | $72B |
|
||
| Energy Services | 3 | $60B |
|
||
| Utilities | 3 | $41B |
|
||
| Healthcare | 2 | $330B |
|
||
Price history
-35.1% since first listed11 events — show timeline
- 2026-05-07 Sold (Public Records) — Public Records
- 2026-04-02 Pending — MCALLENMLS
- 2026-03-23 Price Changed $54,800 MCALLENMLS
- 2026-03-10 Price Changed $58,000 MCALLENMLS
- 2026-03-01 Price Changed $63,000 MCALLENMLS
- 2026-02-18 Listed $68,000 MCALLENMLS
- 2025-12-17 Price Changed $79,500 CBMLS
- 2025-11-18 Listed $84,500 CBMLS
- 2022-10-25 Sold (Public Records) — Public Records
- 2011-03-02 Sold (Public Records) — Public Records
- 2001-05-07 Sold (Public Records) — Public Records
Property tax history
+18.3%/yrLatest (2025): $2,647 · +18.7% YoY. Source: county tax records.
Cash-flow waterfall
monthlySold comps — $/sqft
last 12 mo · ≤1 miLoading sold comps…