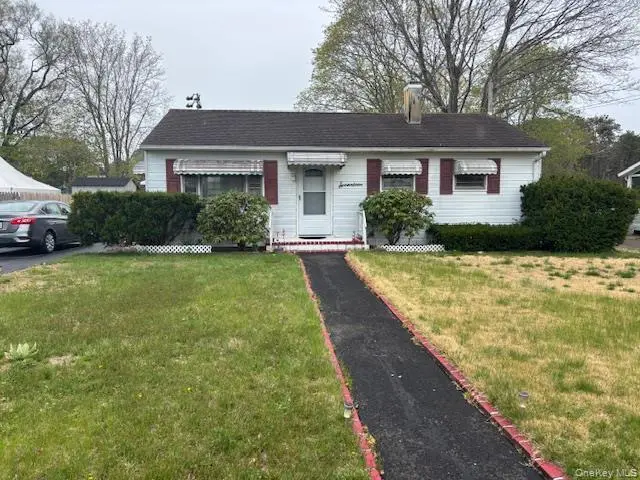
17 Brown St · Riverside, NY
Flood risk 4/10 · Minor
- FEMA flood zone
- X (unshaded)
- Chance of flooding over 30 yrs
- 0.2%
- Est. flood insurance / yr
- $473 – $860
Fire risk 4/10 · Minor
- Est. fire insurance / yr
- $691 – $1,283
Heat risk 5/10 · Moderate
- Hot days now (above 92°F)
- 7 days/yr
- Hot days in 30 yrs
- 19 days/yr
Wind risk 8/10 · Major
- Chance of severe wind over 30 yrs
- 80.0%
Air-quality risk 3/10 · Minor
- Unhealthy air days now
- 2 days/yr
- Unhealthy air days in 30 yrs
- 3 days/yr
Risk factors via First Street. Map © Google.
Why this score? — see what drove the C- grade
The composite is a weighted blend of 9 inputs, each scored 0–100. Each bar is that input's sub-score; the figure is the points it added to the 100-point composite (weight × sub-score).
- Cash flow +17.7/30.0
- ARV discount +11.7/15.0
- DSCR +5.5/10.0
- 1% rule +3.7/10.0
- Schools +3.6/10.0
- Livability +2.7/5.0
- Rent growth +2.5/5.0
- Condition / age +2.5/5.0
- Appreciation +0.0/10.0
$399,990
🖨 Deal sheet 📄 Offer letter ✓ Due diligence
Listing remarks
Cozy 3Bd Ranch Features Hardwoof floors 3 year young boiler, 10-15 Year old roof, full Basement, Detached 1 Car Garage, Low Taxes, Fenced Property, Close to school & Park
Key facts
- 9,583 sq ft lot
- Garage
- Built 1991
Neighborhood map
What this means for you Summary
Snapshot
- This is a 2-bed/1.0-bath single-family listed at $400k.
Deal economics
- At list price, monthly cash flow is $322 ($4k/yr) — positive.
- The deal already cash-flows at list — no discount required.
- To meet the 1% rule (rent ≥ 1% of price), the offer needs to be $349k (12.7% below list).
- Recommended offer: $349k (12.7% below list) — sets the bar for 1% rule.
Location & tenants
- Location reads 54/100 on livability (#1,145 in NY) — a working-class tenant base; expect higher turnover. Strengths: crime A, health & safety B+; Watch: amenities F, commute F, employment D-.
- Riverhead Central School District (suburban): math 34% / reading 48% proficiency, ranked #489 of 590 in NY (top 83%) — families likely to look elsewhere, expect single-tenant / working-renter base with shorter leases.
- Zoned schools: Phillips Avenue School (math 17% / reading 32%, grade F, #1,846 of 2,108 statewide, top 91%, 578 students, 50% FRL); Riverhead Middle School (math 18% / reading 35%, grade F, #594 of 729 statewide, top 81%, 827 students, 57% FRL); Riverhead Senior High School (math 80% / reading 86%, grade A, #440 of 1,100 statewide, top 40%, 2,001 students, 52% FRL).
- Market conditions: 188 active listings in the ZIP; 7 comparable units currently listed for rent nearby; rentals lingering (median 44d on market — plan ~5-8 weeks vacancy on turnover, expect pricing pressure); 71% of comp listings sitting > 30 days — soft ceiling on asking rent; 1,366 units permitted in Suffolk County in 2024 (216 in 5+ unit buildings).
Forward outlook
- Local home prices are declining (-3.0%/yr); year-one equity from $3k of loan paydown is wiped out by about $12k of value loss. Plan a longer hold.
- Suffolk County population projected to shrink 5% by 2050 — rents likely to lag national; underwrite the cash flow, not the appreciation.
Negotiation context
- Only 1 days on market — expect competitive offers; lowballing is unlikely to land.
- Current owner paid $38k; list at $400k implies a 967% gain — meaningful room to come down on a strong offer.
Risks & watch-outs
- Climate carrying-cost: severe wind risk, 80% chance of damaging wind over 30y; extreme-heat days projected 7→19/yr by 2055 (HVAC capex compounding) — expect insurance premiums to compound above CPI over the hold.
Questions for the listing agent
- Is there a deadline driving the sale (1031 exchange, divorce, estate, relocation)? That informs how much negotiation room exists.
- Schools are F-rated, which usually means shorter tenancies and higher turnover. Who's the typical renter profile here, and what's been the actual vacancy rate?
- What's the average days-on-market for RENTAL listings here right now (not sales)? A rising rental-DOM trend means longer vacancies and softer asking-rent achievability than the comps imply.
- What's the recent tenant-quality profile in this submarket — average credit score on applications, eviction rate, late-payment / NSF rate, and stable-employment percentage? A property-management company in the area should have these aggregated.
- How much new for-sale + rental construction is in the pipeline within 1–3 miles? Heavy new supply typically softens prices + rents 12–24 months out; constrained supply supports both.
Investment metrics
- 1% rule
- 0.87% ✗
- Cap rate
- 7.26%
- Cash-on-cash
- 3.45%
- DSCR
- 1.15
- GRM
- 9.5
CMA / ARV
- ARV (on-the-fly)
- $441,144
- Comps found
- 3
Show comp detail 3 sales within ~0.75 mi
| Address | Dist | Beds/Ba | Sqft | Sold | Price | $/sf | Match |
|---|---|---|---|---|---|---|---|
| 43 Goodridge Ave | 0.11mi | 2/1.0 | 770 (-3%) | 14mo | $335,000 | $435 | 79 |
| 440 Flanders Rd | 0.58mi | 2/1.0 | 754 (-5%) | 18mo | $420,000 | $557 | 50 |
| 257 Flanders Rd | 0.57mi | 3/1.0 (+1) | 700 (-12%) | 0mo | $460,000 | $657 | 49 |
Match score weights: distance 35% · size 25% · config 20% · recency 20%. Top-matched comps best support the ARV.
Projected returns pro-forma
-3.0% appreciation · 3.0% rent growth · sell at horizon
- IRR
- -10.9%
- Equity multiple
- 0.60×
- Total profit
- $-44,442
- Equity at exit
- $59,640
- IRR
- -1.7%
- Equity multiple
- 0.89×
- Total profit
- $-12,878
- Equity at exit
- $34,584
Cash invested: $111,997 (down + closing). Projections, not guarantees.
Landlord ↔ Tenant lean methodology
- Overall (STATE)
- 15 Strongly Tenant-Friendly
- State New York
- 15 Strongly Tenant-Friendly · D+10
- County
- — inherits STATE
- City
- — inherits STATE
ZIP-level market 11901
- Home prices YoY
- -29.5%
- Active inventory
- 188
- Price-to-rent
- 9.5×
Monthly cashflow live
- Estimated rent
- $3,493 high interval (Pro) →
- Mortgage (P&I)
- −$2,098
- Tax from tax record
- −$173 /mo · $2,073/yr
- Insurance
- −$167
- HOA
- −$0
- Vacancy / Maint / Mgmt
- −$733
- Net cashflow
- $322
Break-even live
UW: 25.0% down · 7.5% · 30yr · 1.5% tax · 5.0% vac · 8.0% maint · 8.0% mgmt
Financing live
Cash to close
- Down payment
- $99,998
- Closing costs
- $12,000
- Reserves months
- —
- Total cash needed
- —
Loan-product check · same deal, 3 products live
Conventional
25% down · 7.5% · 30yr
- Down + closing
- —
- Monthly P&I
- —
- Monthly cashflow
- —
- DSCR
- —
- Eligible?
- —
Personal DTI + credit; lowest rate.
DSCR
20% down · 8.5% · 30yr
- Down + closing
- —
- Monthly P&I
- —
- Monthly cashflow
- —
- DSCR
- —
- Eligible?
- —
No personal income docs; deal must DSCR.
Hard money
10% down · 12.0% · 12mo
- Down + closing
- —
- Monthly P&I
- —
- Monthly cashflow
- —
- DSCR
- —
- Eligible?
- —
Short-term bridge; refi at stabilization.
Rent comps 7 comps
| Address | Beds | Baths | Sqft | Rent | $/sqft | DOM | Units | Dist |
|---|---|---|---|---|---|---|---|---|
| 221 E Main St Unit 502 Riverhead, NY | 1.0 | 1.0 | 624 | $1,794 | $2.88 | 43d | 1 | 0.87mi |
| 221 E Main St Unit 227 Riverhead, NY | 1.0 | 1.0 | 680 | $2,154 | $3.17 | 43d | 1 | 0.87mi |
| 331 E Main St Unit 404 Riverhead, NY | 1.0 | 1.0 | 712 | $3,750 | $5.27 | 43d | 1 | 0.87mi |
| 331 E Main St Unit 204 Riverhead, NY | 2.0 | 1.0 | 867 | $3,350 | $3.86 | 43d | 1 | 0.87mi |
| 331 E Main St Unit 405 Riverhead, NY | 2.0 | 1.0 | 777 | $4,300 | $5.53 | 43d | 1 | 0.87mi |
| 331 E Main St Riverhead, NY | 1.0–2.0 | 1.0 | 822 | $4,300 | $5.23 | 1d | 3 | 0.87mi |
| 67 Reeves Bay Trl Unit 1546122P Riverhead, NY | 1.0 | 1.0 | 990 | $5,161 | $5.21 | 13d | 1 | 1.41mi |
Listing history 4 events
-
2026-05-12status Pending
-
2026-04-27price $399,990
-
2026-04-27$399,940 Active
-
2000-01-13soldstatus $37,500
ⓘ Source: listings_history table (triggers on properties + properties_extension) + one-shot
backfill from property_details.listing_events for pre-trigger history.
Tax reassessment forecast NY · Partial reset (capped growth)
- Current annual tax
- $2,073 · $173/mo
- Projected year-2 tax
- $4,416 · $368/mo
- Expected delta
- +$2,344/yr (+$195/mo · 113.1%)
ⓘ Screening estimate from a state-policy table — verify with the county assessor before closing.
Climate risk First Street
- Flood 4/10 Moderate FEMA zone X (unshaded) · 20% chance over 30 yrs
- Wildfire 4/10 Moderate
- Heat 5/10 Major 7 d/yr ≥92°F today · 19 d/yr by 30 yrs out
- Wind 8/10 Severe 80% chance of damaging wind over 30 yrs
- Air quality 3/10 Moderate 2 unhealthy d/yr today · 3 by 30 yrs out
Nearby sold comps map
Loading sold comps map…
Walkable amenities ~0.75 mi
Loading nearby amenities…
Taxation est. · year 1
- Rental income
- $41,912
- − Mortgage interest
- −$22,406
- − Property taxes
- −$2,073
- − Insurance
- −$2,000
- − Repairs & maintenance
- −$3,353
- − Management
- −$3,353
- − Depreciation
- −$11,636
- Taxable loss
- −$2,909
- Est. tax savings @ 24.0%
- +$698
- After-tax cash flow
- $4,565/yr
For passive investors: Depreciation is non-cash, so a rental often shows a tax loss while cash-flowing — sheltering income. Rental losses are passive: they offset passive income freely, and up to $25,000/yr can offset ordinary (W-2) income if you actively participate and your MAGI is under $100k (phasing out to $0 by $150k); unused losses carry forward. On sale, claimed depreciation is recaptured at up to 25%, and gains may owe capital-gains tax (a 1031 exchange can defer both). Figures are a year-1 estimate at your 24.0% rate — not tax advice; consult a CPA.
Schools (NCES district)
- District
- Riverhead Central School District
- NCES district ID
- 3624690
- Math proficiency
- 34% ▼ -4.00%
- Reading proficiency
- 48% ▲ 13.00%
- Median HH income
- $61,607
- Composite
- 36.38/100
- National rank
- #4683
- State rank
- #489 of 590 in NY
Livability — Riverside
- Score
- 54/100
- State rank
- #1145
- US rank
- #23895
Category grades
Schools grade is shown separately in the Schools card above.
Census & demographics
- Census place
- Riverside, NY
- Population (ZIP)
- 32,921
Population outlook (Suffolk County) Hauer SSP2
- Today (2025)
- 1,505,262 people
- By 2030
- 1,498,318 · -0.5%
- By 2040
- 1,471,101 · -2.3%
- By 2050
- 1,424,848 · -5.3%
- By 2075
- 1,337,157 · -11.2%
- By 2100
- 1,217,720 · -19.1%
Race, ethnicity, and origin ACS 2023
- Neighborhood character
- Diverse neighborhood (Simpson 0.63)
- Race & ethnicity
- White 52% Hispanic / Latino 29% Two or more races 14% Black 11% Asian 3%
- Hispanic origin (detail)
- Mexican 4%
- Common ancestry
- Romanian 8% Iranian 1% Portuguese 1%
- Foreign-born
- 25% · Canada, Jamaica
- Languages at home
- 68% English-only · Spanish 26% Other Indo-European 3% Russian/Polish/Slavic 2%
Political lean MEDSL · Suffolk
- 2024 margin
- Lean R (+10.0) · D 45.0% · R 55.0%
- 2008→2024 swing
- -16.0pp toward R · 2008: 6.0pp · 2024: -10.0pp
- All cycles
- 2024: R+10.0 2020: R+0.0 2016: R+8.2 2012: D+2.9 2008: D+6.0
Not yet ingested
- Civics
- —
Market trends
- HPI YoY
- ▼ -182.60%
- Current HPI
- 436.7781
- Rent YoY
- —
- Metro
- —
- State GDP YoY
- ▲ 2.60%
- F500 in state
- 92
Industry mix (Fortune 500 HQ in NY)
| Industry | F500 HQs | Revenue |
|---|---|---|
| Financial Services | 10 | $950B |
|
||
| Consumer Goods | 9 | $162B |
|
||
| Insurance | 4 | $225B |
|
||
| Telecommunications | 2 | $144B |
|
||
| Pharmaceuticals | 2 | $112B |
|
||
| Media / Entertainment | 2 | $69B |
|
||
Price history
+966.6% since first listed4 events — show timeline
- 2026-05-12 Pending — OneKey® MLS as Distributed by MLS Grid
- 2026-04-27 Price Changed $399,990 OneKey® MLS as Distributed by MLS Grid
- 2026-04-27 Listed $399,940 OneKey® MLS as Distributed by MLS Grid
- 2000-01-13 Sold (Public Records) $37,500 Public Records
Property tax history
+4.9%/yrLatest (2022): $2,073 · +0.0% YoY. Source: county tax records.
Cash-flow waterfall
monthlySold comps — $/sqft
last 12 mo · ≤1 miLoading sold comps…