2035 Hemstreet Rd · Billington Heights, NY
Flood risk 1/10 · Minimal
- FEMA flood zone
- X (unshaded)
- Chance of flooding over 30 yrs
- 0.0%
- Est. flood insurance / yr
- $507 – $1,088
Fire risk 1/10 · Minimal
- Est. fire insurance / yr
- $691 – $1,283
Heat risk 2/10 · Minimal
- Hot days now (above 91°F)
- 7 days/yr
- Hot days in 30 yrs
- 16 days/yr
Wind risk 1/10 · Minimal
- Chance of severe wind over 30 yrs
- —
Air-quality risk 2/10 · Minimal
- Unhealthy air days now
- 1 days/yr
- Unhealthy air days in 30 yrs
- 2 days/yr
Risk factors via First Street. Map © Google.
Why this score? — see what drove the B grade
The composite is a weighted blend of 9 inputs, each scored 0–100. Each bar is that input's sub-score; the figure is the points it added to the 100-point composite (weight × sub-score).
- Cash flow +30.0/30.0
- 1% rule +10.0/10.0
- DSCR +10.0/10.0
- ARV discount +7.5/15.0
- Schools +5.5/10.0
- Livability +3.1/5.0
- Rent growth +2.5/5.0
- Condition / age +2.2/5.0
- Appreciation +0.0/10.0
$48,500
🖨 Deal sheet 📄 Offer letter ✓ Due diligence
Listing remarks MLS
New build at an old price. Very affordable living that you can call your own. Open floorplan with a split bedroom design for privacy. Great earth tones to accommodate any decor, come and take a look at this brand new home.
Key facts
- Washer and dryer
- Primary suite
- Newer generator
Tags
Property features AI
Finance
- HOA & community: Land lease: $650
Exterior
- Parking: No garage
- Utilities: Public water connected; Sewer connected; Electric service
- Home design: Single-story; Single wide mobile home; Commodore model; Resale property
- Construction: Frame construction; Vinyl siding; Blown-in insulation; Block and slab foundation; Existing/previously built
- Exterior features: Gravel driveway; Rectangular lot
Interior
- Kitchen: Gas oven; Gas range; Dishwasher; Refrigerator
- Bedrooms: 2 main level bedrooms
- Flooring: Carpet; Laminate; Varied flooring
- Bathrooms: 2 full bathrooms (both on main level)
- Heating & cooling: Gas forced air heating
- Interior features: Partially furnished; Kitchen/family room combo; Living/dining room; Primary suite with bath in primary bedroom; Main level primary
- Laundry & utility: Main level laundry; Washer; Dryer; Gas water heater
Neighborhood map
What this means for you Summary
Snapshot
- This is a 2-bed/2.0-bath single-family listed at $48k. Condition is rated fair.
Deal economics
- At list price, monthly cash flow is $943 ($11k/yr) — positive.
- The deal already cash-flows at list — no discount required.
- Meets the 1% rule at list price ($2k rent vs $48k).
Location & tenants
- Location reads 62/100 on livability (#872 in NY) — a middle-class / working-renter tenant base. Strengths: crime A+, housing A+; Watch: schools D+, amenities F, commute F.
- Iroquois Central School District (rural): math 57% / reading 68% proficiency, ranked #178 of 590 in NY (top 30%) — acceptable for families but not a draw, mixed tenant base, ~2y average lease; only 10% free/reduced lunch — higher-income household profile.
- Market conditions: 90 active listings in the ZIP; 1,244 units permitted in Erie County in 2024 (563 in 5+ unit buildings).
Forward outlook
- Local home prices are declining (-3.0%/yr); year-one equity from $335 of loan paydown is wiped out by about $1k of value loss. Plan a longer hold.
- At projected returns (-3.0% appreciation + 3.0% rent growth), your $14k cash investment doubles in ~2 years — after that, you're playing with house money.
Negotiation context
- Only 14 days on market — expect competitive offers; lowballing is unlikely to land.
- 2 sale attempts since 6y ago with the ask held roughly flat each time — persistent listings suggest the price (not the market) is what's stuck; bring a comps-based counter.
- Current owner paid $39k; 24% above their basis — modest negotiation headroom, anchor on the comps not their cost.
Questions for the listing agent
- Have any recent inspections been done? Can we get a copy of the seller's disclosures and any deferred-maintenance estimates?
- Is there a deadline driving the sale (1031 exchange, divorce, estate, relocation)? That informs how much negotiation room exists.
- Schools are D-rated, which usually means shorter tenancies and higher turnover. Who's the typical renter profile here, and what's been the actual vacancy rate?
- What's the average days-on-market for RENTAL listings here right now (not sales)? A rising rental-DOM trend means longer vacancies and softer asking-rent achievability than the comps imply.
- What's the recent tenant-quality profile in this submarket — average credit score on applications, eviction rate, late-payment / NSF rate, and stable-employment percentage? A property-management company in the area should have these aggregated.
- How much new for-sale + rental construction is in the pipeline within 1–3 miles? Heavy new supply typically softens prices + rents 12–24 months out; constrained supply supports both.
Investment metrics
- 1% rule
- 3.34% ✓
- Cap rate
- 29.63%
- Cash-on-cash
- 83.33%
- DSCR
- 4.71
- GRM
- 2.5
CMA / ARV
No comps found within radius.
Projected returns pro-forma
-3.0% appreciation · 3.0% rent growth · sell at horizon
- IRR
- 83.7%
- Equity multiple
- 4.85×
- Total profit
- $52,228
- Equity at exit
- $7,232
- IRR
- 86.9%
- Equity multiple
- 10.05×
- Total profit
- $122,918
- Equity at exit
- $4,193
Cash invested: $13,580 (down + closing). Projections, not guarantees.
Landlord ↔ Tenant lean methodology
- Overall (STATE)
- 15 Strongly Tenant-Friendly
- State New York
- 15 Strongly Tenant-Friendly · D+10
- County
- — inherits STATE
- City
- — inherits STATE
ZIP-level market 14052
- Active inventory
- 90
- Price-to-rent
- 2.5×
Monthly cashflow live
- Estimated rent
- $1,618 medium interval (Pro) →
- Mortgage (P&I)
- −$254
- Tax est. 1.5%
- −$61 /mo · $728/yr
- Insurance
- −$20
- HOA
- −$0
- Vacancy / Maint / Mgmt
- −$340
- Net cashflow
- $943
Break-even live
UW: 25.0% down · 7.5% · 30yr · 1.5% tax · 5.0% vac · 8.0% maint · 8.0% mgmt
Financing live
Cash to close
- Down payment
- $12,125
- Closing costs
- $1,455
- Reserves months
- —
- Total cash needed
- —
Loan-product check · same deal, 3 products live
Conventional
25% down · 7.5% · 30yr
- Down + closing
- —
- Monthly P&I
- —
- Monthly cashflow
- —
- DSCR
- —
- Eligible?
- —
Personal DTI + credit; lowest rate.
DSCR
20% down · 8.5% · 30yr
- Down + closing
- —
- Monthly P&I
- —
- Monthly cashflow
- —
- DSCR
- —
- Eligible?
- —
No personal income docs; deal must DSCR.
Hard money
10% down · 12.0% · 12mo
- Down + closing
- —
- Monthly P&I
- —
- Monthly cashflow
- —
- DSCR
- —
- Eligible?
- —
Short-term bridge; refi at stabilization.
Listing history 11 events
-
2026-06-18days on market $48,500 Active 14 DOM
-
2026-06-17days on market $48,500 Active 13 DOM
-
2026-06-16days on market $48,500 Active 12 DOM
-
2026-06-15days on market $48,500 Active 11 DOM
-
2026-06-13days on market $48,500 Active 9 DOM
-
2026-06-13days on market $48,500 Active 8 DOM
-
2026-06-10days on market $48,500 Active 6 DOM
-
2026-06-09days on market $48,500 Active 5 DOM
-
2026-06-08days on market $48,500 Active 4 DOM
-
2026-06-07remarks 699-char remark
-
2026-06-07$48,500 Active 3 DOM
ⓘ Source: listings_history table (triggers on properties + properties_extension) + one-shot
backfill from property_details.listing_events for pre-trigger history.
Climate risk First Street
- Flood 1/10 Low FEMA zone X (unshaded) · 0% chance over 30 yrs
- Wildfire 1/10 Low
- Heat 2/10 Low 7 d/yr ≥91°F today · 16 d/yr by 30 yrs out
- Wind 1/10 Low
- Air quality 2/10 Low 1 unhealthy d/yr today · 2 by 30 yrs out
Nearby sold comps map
Loading sold comps map…
Walkable amenities ~0.75 mi
Loading nearby amenities…
Taxation est. · year 1
- Rental income
- $19,416
- − Mortgage interest
- −$2,717
- − Property taxes
- −$728
- − Insurance
- −$242
- − Repairs & maintenance
- −$1,553
- − Management
- −$1,553
- − Depreciation
- −$1,411
- Taxable income
- $11,212
- Est. tax owed @ 24.0%
- −$2,691
- After-tax cash flow
- $8,626/yr
For passive investors: Depreciation is non-cash, so a rental often shows a tax loss while cash-flowing — sheltering income. Rental losses are passive: they offset passive income freely, and up to $25,000/yr can offset ordinary (W-2) income if you actively participate and your MAGI is under $100k (phasing out to $0 by $150k); unused losses carry forward. On sale, claimed depreciation is recaptured at up to 25%, and gains may owe capital-gains tax (a 1031 exchange can defer both). Figures are a year-1 estimate at your 24.0% rate — not tax advice; consult a CPA.
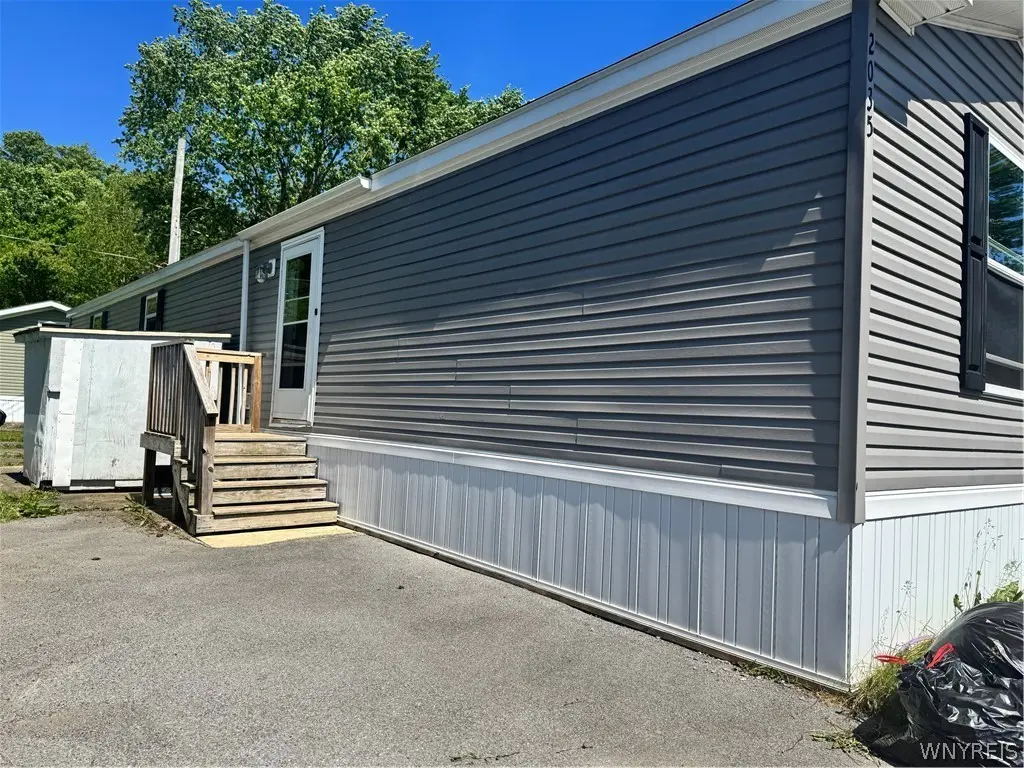
Condition & rehab AI · 12 photos
This 2020-built home offers a good starting point with a fair condition, but minor repairs and updates to the exterior and interior can significantly enhance its value.
Repairs flagged
- Minor Wooden deck and stairs — Worn wooden deck and stairs need minor repair.
Value-add opportunities
- Resale Paint interior walls — Fresh paint enhances curb appeal and interior aesthetics.
- Both Replace wooden deck and stairs — A new deck and stairs improve safety and add value for both resale and rental.
Renovation cost estimate screening
| Repair item | Severity | Est. cost |
|---|---|---|
| Wooden deck and stairs · Worn wooden deck and stairs need minor repair. | Minor | $500–3,000 |
| Total estimated repair cost · 1 items | $500–3,000 |
Value-add ROI direction
- Resale Paint interior walls — Fresh paint enhances curb appeal and interior aesthetics. ↑
- Both Replace wooden deck and stairs — A new deck and stairs improve safety and add value for both resale and rental. ↑
ⓘ Cost ranges are severity-bucket heuristics (US national rule-of-thumb). Get contractor quotes + a written scope before underwriting a rehab budget.
Schools (NCES district)
- District
- Iroquois Central School District
- NCES district ID
- 3615360
- Math proficiency
- 57% ▼ -17.00%
- Reading proficiency
- 68% ▲ 8.00%
- Median HH income
- $74,111
- Composite
- 55.41/100
- National rank
- #1251
- State rank
- #178 of 590 in NY
Livability — Billington Heights
- Score
- 62/100
- State rank
- #872
- US rank
- #16864
Category grades
Schools grade is shown separately in the Schools card above.
Census & demographics
- Population (ZIP)
- 17,501
Population outlook (Erie County) Hauer SSP2
- Today (2025)
- 933,037 people
- By 2030
- 935,181 · +0.2%
- By 2040
- 928,531 · -0.5%
- By 2050
- 905,725 · -2.9%
- By 2075
- 834,037 · -10.6%
- By 2100
- 708,033 · -24.1%
Race, ethnicity, and origin ACS 2023
- Neighborhood character
- Predominantly White (95%)
- Race & ethnicity
- White 95% Two or more races 3% Hispanic / Latino 3%
- Common ancestry
- Romanian 13% Lithuanian 3% Slovak 2%
- Foreign-born
- 2% · Canada
- Languages at home
- 96% English-only · Arabic 2% Spanish 1%
Political lean MEDSL · Erie
- 2024 margin
- Lean D (+9.7) · D 54.8% · R 45.2%
- 2008→2024 swing
- -7.9pp toward R · 2008: 17.5pp · 2024: 9.7pp
- All cycles
- 2024: D+9.7 2020: D+14.7 2016: D+4.8 2012: D+15.6 2008: D+17.5
Not yet ingested
- Civics
- —
Market trends
- HPI YoY
- ▼ -212.44%
- Current HPI
- 327.8237
- Rent YoY
- —
- Metro
- —
- State GDP YoY
- ▲ 2.60%
- F500 in state
- 92
Industry mix (Fortune 500 HQ in NY)
| Industry | F500 HQs | Revenue |
|---|---|---|
| Financial Services | 10 | $950B |
|
||
| Consumer Goods | 9 | $162B |
|
||
| Insurance | 4 | $225B |
|
||
| Telecommunications | 2 | $144B |
|
||
| Pharmaceuticals | 2 | $112B |
|
||
| Media / Entertainment | 2 | $69B |
|
||
Price history
+7.8% since first listed4 events — show timeline
- 2026-06-04 Listed $48,500 WNYREIS
- 2020-08-08 Sold (MLS) $39,000 WNYREIS
- 2020-06-03 Pending — WNYREIS
- 2020-06-01 Listed $45,000 WNYREIS
Cash-flow waterfall
monthlySold comps — $/sqft
last 12 mo · ≤1 miLoading sold comps…