12218 Columbine Ln · Glade Spring, VA
Flood risk 1/10 · Minimal
- FEMA flood zone
- X (unshaded)
- Chance of flooding over 30 yrs
- 0.0%
- Est. flood insurance / yr
- $473 – $860
Fire risk 3/10 · Minor
- Est. fire insurance / yr
- $666 – $1,236
Heat risk 3/10 · Minor
- Hot days now (above 94°F)
- 7 days/yr
- Hot days in 30 yrs
- 21 days/yr
Wind risk 2/10 · Minimal
- Chance of severe wind over 30 yrs
- 0.0%
Air-quality risk 1/10 · Minimal
- Unhealthy air days now
- 0 days/yr
- Unhealthy air days in 30 yrs
- 0 days/yr
Risk factors via First Street. Map © Google.
Why this score? — see what drove the D- grade
The composite is a weighted blend of 9 inputs, each scored 0–100. Each bar is that input's sub-score; the figure is the points it added to the 100-point composite (weight × sub-score).
- ARV discount +13.6/15.0
- Schools +6.2/10.0
- Appreciation +5.7/10.0
- Cash flow +5.4/30.0
- Livability +3.1/5.0
- Rent growth +2.5/5.0
- Condition / age +2.5/5.0
- 1% rule +0.0/10.0
- DSCR +0.0/10.0
$225,000
🖨 Deal sheet 📄 Offer letter ✓ Due diligence
Listing remarks
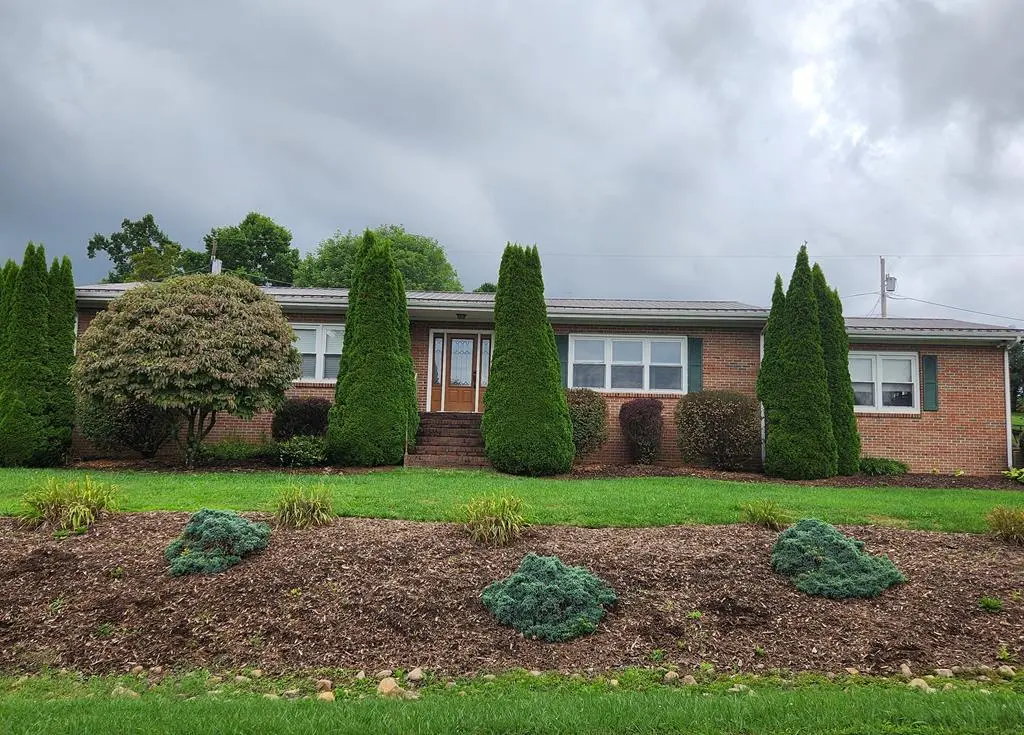
One level living!!! Welcome to this well-maintained brick ranch home. Located in a well-established neighborhood, this home offers 3 bedrooms and 2 baths with a fenced in backyard. This home has had many updates including new exterior doors, new heat pump, and new metal roof in 2019, new carpet in the bedrooms in 2021, a roof was added to the back patio in 2023, and an outbuilding that was added in 2023 which conveys with the property. Don't let this get away!
Key facts
- New heat pump
- New metal roof
- New exterior doors
Tags
Property features AI
Exterior
- Parking: 1-car garage
- Security: Smoke detector(s)
- Utilities: Public water; Septic tank sewer; Propane service
- Home design: Single-family residence; One story; Residential property
- Construction: Brick construction
- Exterior features: Metal roof; Irregular, level lot; Subdivision: Greenside
Interior
- Kitchen: Dishwasher; Electric range; Refrigerator
- Flooring: Carpet; Vinyl; Wood
- Bathrooms: 2 full bathrooms
- Heating & cooling: Heat pump; Propane heating; Central cooling with ceiling fans
- Interior features: Dishwasher; Electric range; Refrigerator; Ceiling fan(s); Smoke detector(s); Crawl space basement
Neighborhood map
What this means for you Summary
Snapshot
- This is a 2-bed/2.0-bath single-family listed at $225k.
Deal economics
- At list price, monthly cash flow is $-485 ($-6k/yr) — negative.
- To cash-flow at today's rent, offer at most $139k (38.1% below list).
- To meet the 1% rule (rent ≥ 1% of price), the offer needs to be $109k (51.5% below list).
- Recommended offer: $109k (51.5% below list) — sets the bar for 1% rule.
Location & tenants
- Location reads 62/100 on livability (#399 in VA) — a middle-class / working-renter tenant base. Strengths: cost of living A+, housing A+; Watch: health & safety C-, crime D-, amenities F.
- Washington County Public School District (rural): math 68% / reading 79% proficiency, ranked #15 of 131 in VA (top 12%) — strong family-tenant draw, lease renewals of 3-5y typical.
- Zoned schools: Meadowview Elementary (math 63% / reading 74%, grade B+, #357 of 1,108 statewide, top 33%, 551 students, 89% FRL); Glade Spring Middle (math 70% / reading 74%, grade A, #65 of 342 statewide, top 21%, 254 students, 80% FRL); Patrick Henry High (math 62% / reading 82%, grade B+, #134 of 319 statewide, top 45%, 366 students, 66% FRL) — zoned schools average 78% FRL vs 42% district-wide (36 pts higher); higher-poverty schools than district average — tighter screening recommended.
- Market conditions: 34 active listings in the ZIP; 99 units permitted in Washington County in 2024 (0 in 5+ unit buildings).
Forward outlook
- In year one you build about $5k of equity ($2k loan paydown + $3k appreciation (1.4% local appreciation)).
- Washington County population projected at -14% by 2050 — secular population decline; favor cash flow + early exit over multi-decade hold.
- By year 7, paydown + projected appreciation supports a ~$30k cash-out refi (75% LTV) — recoverable capital for the next deal without selling this one.
Negotiation context
- It's been on market 48 days — a 3% lower offer ($218k) is reasonable based on typical stale-listing flexibility.
- 3 sale attempts since 2y ago with the ask held roughly flat each time — persistent listings suggest the price (not the market) is what's stuck; bring a comps-based counter.
Questions for the listing agent
- What do current leases actually rent for vs. the listed asking? Can we see a recent rent roll and the last 12 months of T-12 income?
- It's been on market 48 days. Have you received any prior offers? Is the seller open to a 52% concession, seller financing, or rate buy-down credit?
- Built in 1976 — when were the roof, HVAC, electrical panel, plumbing, and water heater last replaced?
- Is there a deadline driving the sale (1031 exchange, divorce, estate, relocation)? That informs how much negotiation room exists.
- Schools are A-rated — typically a magnet for longer-tenancy family renters. What's the average tenant stay here, and is there a school-zone premium baked into asking?
- Crime grade is D in this area — have there been break-ins, vandalism, or insurance claims at this property in the last 3 years? What carrier currently insures it and at what premium?
- The area grade is low — what's the realistic commute time and amenity access for the typical tenant pool here? Any planned neighborhood developments (good or bad) we should know about?
- What's the average days-on-market for RENTAL listings here right now (not sales)? A rising rental-DOM trend means longer vacancies and softer asking-rent achievability than the comps imply.
- What's the recent tenant-quality profile in this submarket — average credit score on applications, eviction rate, late-payment / NSF rate, and stable-employment percentage? A property-management company in the area should have these aggregated.
- How much new for-sale + rental construction is in the pipeline within 1–3 miles? Heavy new supply typically softens prices + rents 12–24 months out; constrained supply supports both.
Investment metrics
- 1% rule
- 0.48% ✗
- Cap rate
- 3.70%
- Cash-on-cash
- -9.24%
- DSCR
- 0.59
- GRM
- 17.2
CMA / ARV
- ARV (median comp)
- $260,104
- List price
- $225,000
- Delta
- -13.50%
- Verdict
- UNDERPRICED
- Comps
- 20 within 1.0 mi
Show comp detail 2 sales within ~0.75 mi
| Address | Dist | Beds/Ba | Sqft | Sold | Price | $/sf | Match |
|---|---|---|---|---|---|---|---|
| 33304 Hillman Hwy | 0.64mi | 3/2.0 (+1) | 1,568 (+5%) | 13mo | $288,500 | $184 | 46 |
| 615 Monte Vista Dr | 0.45mi | 3/2.0 (+1) | 1,671 (+12%) | 11mo | $310,000 | $186 | 45 |
Match score weights: distance 35% · size 25% · config 20% · recency 20%. Top-matched comps best support the ARV.
Projected returns pro-forma
1.36% appreciation · 3.0% rent growth · sell at horizon
- IRR
- -7.0%
- Equity multiple
- 0.64×
- Total profit
- $-22,876
- Equity at exit
- $81,004
- IRR
- -1.6%
- Equity multiple
- 0.79×
- Total profit
- $-12,999
- Equity at exit
- $110,967
Cash invested: $63,000 (down + closing). Projections, not guarantees.
Landlord ↔ Tenant lean methodology
- Overall (STATE)
- 55 Moderately Landlord-Leaning
- State Virginia
- 55 Moderately Landlord-Leaning · D+2
- County
- — inherits STATE
- City
- — inherits STATE
ZIP-level market 24340
- Home prices YoY
- 0.8%
- Active inventory
- 34
- Price-to-rent
- 17.2×
Monthly cashflow live
- Estimated rent
- $1,091 medium interval (Pro) →
- Mortgage (P&I)
- −$1,180
- Tax from tax record
- −$73 /mo · $881/yr
- Insurance
- −$94
- HOA
- −$0
- Vacancy / Maint / Mgmt
- −$229
- Net cashflow
- $-485
Break-even live
UW: 25.0% down · 7.5% · 30yr · 1.5% tax · 5.0% vac · 8.0% maint · 8.0% mgmt
Financing live
Cash to close
- Down payment
- $56,250
- Closing costs
- $6,750
- Reserves months
- —
- Total cash needed
- —
Loan-product check · same deal, 3 products live
Conventional
25% down · 7.5% · 30yr
- Down + closing
- —
- Monthly P&I
- —
- Monthly cashflow
- —
- DSCR
- —
- Eligible?
- —
Personal DTI + credit; lowest rate.
DSCR
20% down · 8.5% · 30yr
- Down + closing
- —
- Monthly P&I
- —
- Monthly cashflow
- —
- DSCR
- —
- Eligible?
- —
No personal income docs; deal must DSCR.
Hard money
10% down · 12.0% · 12mo
- Down + closing
- —
- Monthly P&I
- —
- Monthly cashflow
- —
- DSCR
- —
- Eligible?
- —
Short-term bridge; refi at stabilization.
Listing history 18 events
-
2026-06-19days on market $225,000 Active 48 DOM
-
2026-06-18days on market $225,000 Active 47 DOM
-
2026-06-17days on market $225,000 Active 46 DOM
-
2026-06-16days on market $225,000 Active 45 DOM
-
2026-06-15days on market $225,000 Active 44 DOM
-
2026-06-14days on market $225,000 Active 42 DOM
-
2026-06-13days on market $225,000 Active 41 DOM
-
2026-06-10days on market $225,000 Active 39 DOM
-
2026-06-09days on market $225,000 Active 38 DOM
-
2026-06-08days on market $225,000 Active 37 DOM
-
2026-06-07days on market $225,000 Active 36 DOM
-
2026-06-02days on market $225,000 Active 31 DOM
-
2026-06-01days on market $225,000 Active 30 DOM
-
2026-05-31days on market $225,000 Active 29 DOM
-
2026-05-30days on market $225,000 Active 28 DOM
-
2026-05-08historical Active Under Contract 465-char remark
-
2026-05-02$225,000 Active 465-char remark
-
2024-07-30$249,000 Active
ⓘ Source: listings_history table (triggers on properties + properties_extension) + one-shot
backfill from property_details.listing_events for pre-trigger history.
Tax reassessment forecast VA · Resets to sale price
- Current annual tax
- $881 · $73/mo
- Projected year-2 tax
- $1,845 · $154/mo
- Expected delta
- +$964/yr (+$80/mo · 109.5%)
ⓘ Screening estimate from a state-policy table — verify with the county assessor before closing.
Climate risk First Street
- Flood 1/10 Low FEMA zone X (unshaded) · 0% chance over 30 yrs
- Wildfire 3/10 Moderate
- Heat 3/10 Moderate 7 d/yr ≥94°F today · 21 d/yr by 30 yrs out
- Wind 2/10 Low 0% chance of damaging wind over 30 yrs
- Air quality 1/10 Low 0 unhealthy d/yr today · 0 by 30 yrs out
Nearby sold comps map
Loading sold comps map…
Walkable amenities ~0.75 mi
Loading nearby amenities…
Taxation est. · year 1
- Rental income
- $13,089
- − Mortgage interest
- −$12,603
- − Property taxes
- −$881
- − Insurance
- −$1,125
- − Repairs & maintenance
- −$1,047
- − Management
- −$1,047
- − Depreciation
- −$6,545
- Taxable loss
- −$10,160
- Est. tax savings @ 24.0%
- +$2,438
- After-tax cash flow
- $-3,386/yr
For passive investors: Depreciation is non-cash, so a rental often shows a tax loss while cash-flowing — sheltering income. Rental losses are passive: they offset passive income freely, and up to $25,000/yr can offset ordinary (W-2) income if you actively participate and your MAGI is under $100k (phasing out to $0 by $150k); unused losses carry forward. On sale, claimed depreciation is recaptured at up to 25%, and gains may owe capital-gains tax (a 1031 exchange can defer both). Figures are a year-1 estimate at your 24.0% rate — not tax advice; consult a CPA.
Schools (NCES district)
- District
- Washington County Public School District
- NCES district ID
- 5103900
- Math proficiency
- 68% ▼ -23.00%
- Reading proficiency
- 79% ▼ -7.00%
- Median HH income
- $42,412
- Composite
- 61.5/100
- National rank
- #754
- State rank
- #15 of 131 in VA
Livability — Glade Spring
- Score
- 62/100
- State rank
- #399
- US rank
- #16421
Category grades
Schools grade is shown separately in the Schools card above.
Census & demographics
- Population (ZIP)
- 6,173
Population outlook (Washington County) Hauer SSP2
- Today (2025)
- 53,266 people
- By 2030
- 52,284 · -1.8%
- By 2040
- 49,415 · -7.2%
- By 2050
- 45,683 · -14.2%
- By 2075
- 37,258 · -30.1%
- By 2100
- 27,983 · -47.5%
Race, ethnicity, and origin ACS 2023
- Neighborhood character
- Predominantly White (97%)
- Race & ethnicity
- White 97% Black 2% Two or more races 1%
- Common ancestry
- Italian 1% Serbian 1% Slovak 1%
- Foreign-born
- 1% · Canada
- Languages at home
- 98% English-only · Spanish 1% Arabic 1%
Political lean MEDSL · Washington
- 2024 margin
- Solid R (+53.3) · D 23.0% · R 76.3%
- 2008→2024 swing
- -20.6pp toward R · 2008: -32.7pp · 2024: -53.3pp
- All cycles
- 2024: R+53.3 2020: R+52.5 2016: R+53.5 2012: R+43.2 2008: R+32.7
Not yet ingested
- Civics
- —
Market trends
- HPI YoY
- ▲ 1.36%
- Current HPI
- 180.6398
- Rent YoY
- —
- Metro
- —
- State GDP YoY
- ▲ 2.40%
- F500 in state
- 50
Industry mix (Fortune 500 HQ in VA)
| Industry | F500 HQs | Revenue |
|---|---|---|
| Aerospace / Defense | 4 | $236B |
|
||
| Technology / Defense | 3 | $32B |
|
||
| Financial Services | 2 | $176B |
|
||
| Utilities | 2 | $27B |
|
||
| Insurance | 2 | $25B |
|
||
| Technology | 2 | $15B |
|
||
Price history
-9.6% since first listed4 events — show timeline
- 2026-05-25 Relisted — SWVAR
- 2026-05-08 Contingent — SWVAR
- 2026-05-02 Listed $225,000 SWVAR
- 2024-07-30 Listed $249,000 SWVAR
Property tax history
+2.4%/yrLatest (2026): $881 · +0.0% YoY. Source: county tax records.
Cash-flow waterfall
monthlySold comps — $/sqft
last 12 mo · ≤1 miLoading sold comps…