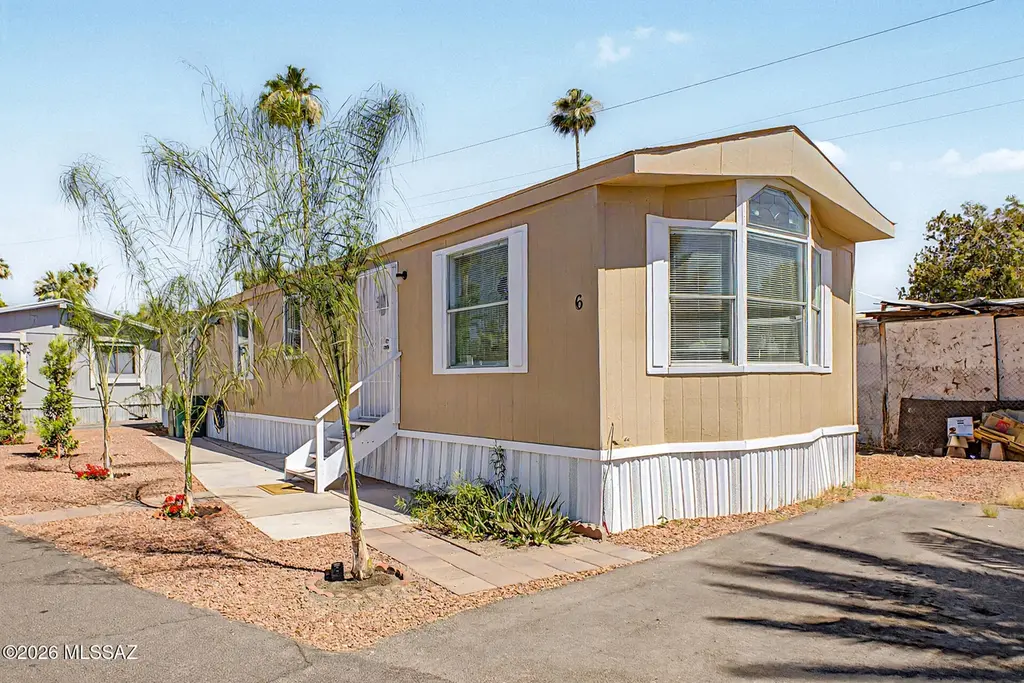
5505 N Shannon Rd #6 · Flowing Wells, AZ
Flood risk 1/10 · Minimal
- FEMA flood zone
- X (unshaded)
- Chance of flooding over 30 yrs
- 0.0%
- Est. flood insurance / yr
- $507 – $1,088
Fire risk 8/10 · Major
- Est. fire insurance / yr
- $610 – $1,132
Heat risk 8/10 · Major
- Hot days now (above 107°F)
- 7 days/yr
- Hot days in 30 yrs
- 19 days/yr
Wind risk 1/10 · Minimal
- Chance of severe wind over 30 yrs
- —
Air-quality risk 1/10 · Minimal
- Unhealthy air days now
- 0 days/yr
- Unhealthy air days in 30 yrs
- 0 days/yr
Risk factors via First Street. Map © Google.
Why this score? — see what drove the B- grade
The composite is a weighted blend of 9 inputs, each scored 0–100. Each bar is that input's sub-score; the figure is the points it added to the 100-point composite (weight × sub-score).
- Cash flow +30.0/30.0
- 1% rule +10.0/10.0
- DSCR +10.0/10.0
- ARV discount +7.5/15.0
- Condition / age +3.8/5.0
- Livability +3.7/5.0
- Rent growth +2.6/5.0
- Schools +2.2/10.0
- Appreciation +0.0/10.0
$49,900
🖨 Deal sheet 📄 Offer letter ✓ Due diligence
Listing remarks
Charming and well-maintained 3-bedroom, 2-bath manufactured home. Bright and inviting floor plan with a spacious living area, attractive landscaping, and pride of ownership throughout. Conveniently located within a well-kept community and ready for its new owner. Residents enjoy access to a community pool.
Key facts
- Community pool
- Spacious living area
- 21.21 acre lot
Tags
Property features AI
Finance
- Other: Zoned Tucson - MH1
- HOA & community: Community pool; Community park; Road maintenance by HOA
Exterior
- Utilities: Water from a water company; Sewer connected
- Home design: Mobile home; One story; Entry faces east/west
- Construction: Siding and wood frame construction; Shingle roof; Built area approximately 1,024
- Exterior features: Screened patio/porch; Decorative gravel; East/West exposure; Paved road
Interior
- Kitchen: Gas cooktop; Gas oven; Refrigerator
- Flooring: Ceramic tile
- Bathrooms: 2 full bathrooms
- Heating & cooling: Has heating
- Interior features: Bay windows; Exhaust fan
- Laundry & utility: Laundry closet
Neighborhood map
What this means for you Summary
Snapshot
- This is a 3-bed/2.0-bath manufactured listed at $50k. Condition is rated good.
Deal economics
- At list price, monthly cash flow is $935 ($11k/yr) — positive.
- The deal already cash-flows at list — no discount required.
- Meets the 1% rule at list price ($2k rent vs $50k).
- Recommended offer: $49k (1.5% below list) — sets the bar for market timing.
- Cap rate 28.8% vs local median 6.1% in Flowing Wells — top-decile yield for the area; either an underpriced asset or a hidden risk that comps aren't pricing in. Stress-test before assuming the spread holds.
Location & tenants
- Location reads 73/100 on livability (#21 in AZ) — a middle-class / working-renter tenant base. Strengths: commute A+, cost of living A+, health & safety A+; Watch: crime F, amenities F, employment F.
- Flowing Wells Unified District (4405) (suburban): math 23% / reading 30% proficiency, ranked #143 of 249 in AZ (top 57%) — low school quality limits family demand, transient renter base, plan for 1-2y turnover; 64% free/reduced lunch — lower-income household profile, screen leases tightly.
- Zoned schools: Laguna Elementary School (math 12% / reading 17%, grade F, #898 of 1,109 statewide, top 83%, 394 students, 92% FRL); Flowing Wells Junior High School (math 24% / reading 28%, grade F, #100 of 218 statewide, top 47%, 818 students, 74% FRL); Flowing Wells High School (math 22% / reading 24%, grade F, #208 of 381 statewide, top 55%, 1,694 students, 65% FRL).
- Market conditions: Rents flat; 177 active listings in the ZIP; 11 comparable units currently listed for rent nearby; rentals leasing fast (median 12d on market — plan ~1-2 weeks tenant-placement turnaround); lower-income renter base — watch delinquency; 5,268 units permitted in Pima County in 2024 (996 in 5+ unit buildings).
- At $1,620/mo this rent would consume 52% of the median local household income ($37k/yr) (locally 4240% of renters already pay >50% of income on rent) — very limited rent-growth headroom before tenants either downsize or default.
Forward outlook
- Local home prices are declining (-3.0%/yr); year-one equity from $345 of loan paydown is wiped out by about $1k of value loss. Plan a longer hold.
- Pima County population projected at +8% by 2050 — modest demand growth; plan on rents tracking national, not racing it.
- At projected returns (-3.0% appreciation + 0.3% rent growth), your $14k cash investment doubles in ~2 years — after that, you're playing with house money.
Negotiation context
- It's been on market 17 days — a 2% lower offer ($49k) is reasonable based on typical stale-listing flexibility.
Risks & watch-outs
- Climate carrying-cost: severe wildfire risk; extreme-heat days projected 7→19/yr by 2055 (HVAC capex compounding) — expect insurance premiums to compound above CPI over the hold.
Questions for the listing agent
- Is there a deadline driving the sale (1031 exchange, divorce, estate, relocation)? That informs how much negotiation room exists.
- Schools are D-rated, which usually means shorter tenancies and higher turnover. Who's the typical renter profile here, and what's been the actual vacancy rate?
- Crime grade is F in this area — have there been break-ins, vandalism, or insurance claims at this property in the last 3 years? What carrier currently insures it and at what premium?
- What's the average days-on-market for RENTAL listings here right now (not sales)? A rising rental-DOM trend means longer vacancies and softer asking-rent achievability than the comps imply.
- What's the recent tenant-quality profile in this submarket — average credit score on applications, eviction rate, late-payment / NSF rate, and stable-employment percentage? A property-management company in the area should have these aggregated.
- How much new for-sale + rental construction is in the pipeline within 1–3 miles? Heavy new supply typically softens prices + rents 12–24 months out; constrained supply supports both.
Investment metrics
- 1% rule
- 3.25% ✓
- Cap rate
- 28.78%
- Cash-on-cash
- 80.31%
- DSCR
- 4.57
- GRM
- 2.6
CMA / ARV
- ARV (on-the-fly)
- $142,336
- Comps found
- 9
Show comp detail 9 sales within ~0.75 mi
| Address | Dist | Beds/Ba | Sqft | Sold | Price | $/sf | Match |
|---|---|---|---|---|---|---|---|
| 3058 W Emerald Cir | 0.41mi | 3/2.0 | 1,024 (0%) | 12mo | $204,180 | $199 | 71 |
| 5421 N Royal Palm Dr | 0.32mi | 3/2.0 | 980 (-4%) | 14mo | $205,000 | $209 | 66 |
| 5445 N Shannon Rd #7 | 0.09mi | 3/1.5 | 884 (-14%) | 6mo | $47,600 | $54 | 66 |
| 3202 W Jusnic Cir | 0.15mi | 3/2.0 | 1,080 (+6%) | 22mo | $218,000 | $202 | 65 |
| 3035 W Carnauba St | 0.22mi | 3/2.0 | 1,152 (+12%) | 12mo | $160,000 | $139 | 59 |
| 2718 W Palmyra St | 0.42mi | 3/1.5 | 980 (-4%) | 16mo | $115,000 | $117 | 58 |
| 5451 N Royal Palm Dr | 0.31mi | 2/1.5 (-1) | 887 (-13%) | 6mo | $88,000 | $99 | 52 |
| 5011 N Davis Ave | 0.66mi | 2/2.0 (-1) | 896 (-12%) | 1mo | $60,000 | $67 | 43 |
| 4973 N Diamond Pl | 0.71mi | 3/2.0 | 980 (-4%) | 20mo | $179,500 | $183 | 43 |
Match score weights: distance 35% · size 25% · config 20% · recency 20%. Top-matched comps best support the ARV.
Projected returns pro-forma
-3.0% appreciation · 0.3% rent growth · sell at horizon
- IRR
- 77.4%
- Equity multiple
- 4.38×
- Total profit
- $47,206
- Equity at exit
- $7,440
- IRR
- 80.3%
- Equity multiple
- 8.25×
- Total profit
- $101,229
- Equity at exit
- $4,314
Cash invested: $13,972 (down + closing). Projections, not guarantees.
Landlord ↔ Tenant lean methodology
- Overall (STATE)
- 87 Strongly Landlord-Friendly
- State Arizona
- 87 Strongly Landlord-Friendly · R+3
- County
- — inherits STATE
- City
- — inherits STATE
ZIP-level market 85705
- Rents YoY
- 0.3%
- Active inventory
- 177
- Price-to-rent
- 2.6×
Monthly cashflow live
- Estimated rent
- $1,620 high interval (Pro) →
- Mortgage (P&I)
- −$262
- Tax est. 1.5%
- −$62 /mo · $748/yr
- Insurance
- −$21
- HOA
- −$0
- Vacancy / Maint / Mgmt
- −$340
- Net cashflow
- $935
Break-even live
UW: 25.0% down · 7.5% · 30yr · 1.5% tax · 5.0% vac · 8.0% maint · 8.0% mgmt
Financing live
Cash to close
- Down payment
- $12,475
- Closing costs
- $1,497
- Reserves months
- —
- Total cash needed
- —
Loan-product check · same deal, 3 products live
Conventional
25% down · 7.5% · 30yr
- Down + closing
- —
- Monthly P&I
- —
- Monthly cashflow
- —
- DSCR
- —
- Eligible?
- —
Personal DTI + credit; lowest rate.
DSCR
20% down · 8.5% · 30yr
- Down + closing
- —
- Monthly P&I
- —
- Monthly cashflow
- —
- DSCR
- —
- Eligible?
- —
No personal income docs; deal must DSCR.
Hard money
10% down · 12.0% · 12mo
- Down + closing
- —
- Monthly P&I
- —
- Monthly cashflow
- —
- DSCR
- —
- Eligible?
- —
Short-term bridge; refi at stabilization.
Rent comps 11 comps
| Address | Beds | Baths | Sqft | Rent | $/sqft | DOM | Units | Dist |
|---|---|---|---|---|---|---|---|---|
| 2774 W Firebrook Rd Tucson, AZ | 2.0 | 2.0 | 1066 | $1,550 | $1.45 | 3d | 1 | 0.44mi |
| 3001 W Coriander Dr Tucson, AZ | 2.0 | 2.0 | 1090 | $1,650 | $1.51 | 43d | 1 | 0.64mi |
| 2531 W Glenbrook Way Tucson, AZ | 2.0 | 2.0 | 1066 | $1,795 | $1.68 | 43d | 1 | 0.70mi |
| 4957 N Sunrise Ave Unit 2 Tucson, AZ | 2.0 | 1.0 | 803 | $1,075 | $1.34 | 14d | 1 | 0.78mi |
| 6491 N Lena Way Tucson, AZ | 3.0 | 2.0 | 1349 | $2,195 | $1.63 | 3d | 1 | 1.23mi |
| 5750 N La Cholla Blvd Tucson, AZ | 2.0–3.0 | 2.0 | 1453 | $2,172 | $1.49 | 1d | 11 | 1.33mi |
| 3500 W Orange Grove Rd Tucson, AZ | 3.0 | 2.0 | 1200 | $1,669 | $1.39 | 23d | 1 | 1.35mi |
| 3500 W Orange Grove Rd Tucson, AZ | 2.0 | 2.0 | 1000 | $1,555 | $1.55 | 21d | 1 | 1.35mi |
| 2255 W Orange Grove Rd Tucson, AZ | 1.0–3.0 | 1.0–2.0 | 858 | $1,649 | $1.92 | 11d | 7 | 1.36mi |
| 1925 W River Rd Tucson, AZ | 1.0–3.0 | 1.0–2.0 | 1049 | $2,076 | $1.98 | 1d | 32 | 1.45mi |
| 5416 N Bramble Brook Ln Tucson, AZ | 3.0 | 2.0 | 1483 | $1,850 | $1.25 | 3d | 1 | 1.45mi |
Listing history 13 events
-
2026-06-18days on market $49,900 Active 17 DOM
-
2026-06-17days on market $49,900 Active 16 DOM
-
2026-06-16days on market $49,900 Active 15 DOM
-
2026-06-15days on market $49,900 Active 14 DOM
-
2026-06-13days on market $49,900 Active 12 DOM
-
2026-06-10days on market $49,900 Active 9 DOM
-
2026-06-09days on market $49,900 Active 8 DOM
-
2026-06-08days on market $49,900 Active 7 DOM
-
2026-06-07days on market $49,900 Active 6 DOM
-
2026-06-05days on market $49,900 Active 3 DOM
-
2026-06-03days on market $49,900 Active 2 DOM
-
2026-06-02remarks 307-char remark
-
2026-06-02$49,900 Active 1 DOM
ⓘ Source: listings_history table (triggers on properties + properties_extension) + one-shot
backfill from property_details.listing_events for pre-trigger history.
Climate risk First Street
- Flood 1/10 Low FEMA zone X (unshaded) · 0% chance over 30 yrs
- Wildfire 8/10 Severe
- Heat 8/10 Severe 7 d/yr ≥107°F today · 19 d/yr by 30 yrs out
- Wind 1/10 Low
- Air quality 1/10 Low 0 unhealthy d/yr today · 0 by 30 yrs out
Nearby sold comps map
Loading sold comps map…
Walkable amenities ~0.75 mi
Loading nearby amenities…
Taxation est. · year 1
- Rental income
- $19,441
- − Mortgage interest
- −$2,795
- − Property taxes
- −$748
- − Insurance
- −$250
- − Repairs & maintenance
- −$1,555
- − Management
- −$1,555
- − Depreciation
- −$1,452
- Taxable income
- $11,086
- Est. tax owed @ 24.0%
- −$2,661
- After-tax cash flow
- $8,560/yr
For passive investors: Depreciation is non-cash, so a rental often shows a tax loss while cash-flowing — sheltering income. Rental losses are passive: they offset passive income freely, and up to $25,000/yr can offset ordinary (W-2) income if you actively participate and your MAGI is under $100k (phasing out to $0 by $150k); unused losses carry forward. On sale, claimed depreciation is recaptured at up to 25%, and gains may owe capital-gains tax (a 1031 exchange can defer both). Figures are a year-1 estimate at your 24.0% rate — not tax advice; consult a CPA.
Condition & rehab AI · 12 photos
This well-maintained 3-bedroom, 2-bath manufactured home is ready for its new owner. It features a spacious floor plan, standard appliances, and a well-maintained exterior. Minor updates to the exterior siding and air conditioning unit would significantly enhance its value.
Value-add opportunities
- Both Paint exterior siding — Enhances curb appeal and value
- Both Replace air conditioning unit — Improves comfort and energy efficiency
Renovation cost estimate screening
Value-add ROI direction
- Both Paint exterior siding — Enhances curb appeal and value ↑
- Both Replace air conditioning unit — Improves comfort and energy efficiency ↑
ⓘ Cost ranges are severity-bucket heuristics (US national rule-of-thumb). Get contractor quotes + a written scope before underwriting a rehab budget.
Schools (NCES district)
- District
- Flowing Wells Unified District (4405)
- NCES district ID
- 0403010
- Math proficiency
- 23% ▼ -19.00%
- Reading proficiency
- 30% ▼ -14.00%
- Median HH income
- $33,361
- Composite
- 21.69/100
- National rank
- #8271
- State rank
- #143 of 249 in AZ
Livability — Flowing Wells
- Score
- 73/100
- State rank
- #21
- US rank
- #5288
Category grades
Schools grade is shown separately in the Schools card above.
Census & demographics
- Census place
- Flowing Wells, AZ
- County
- Pima County · 1,012,107 people
- Metro
- Tucson, AZ
- Population (ZIP)
- 54,700
- Household income
- $37,194
- Rent vs Own
- Severe rent burden
- 4240.0
Population outlook (Pima County) Hauer SSP2
- Today (2025)
- 1,066,056 people
- By 2030
- 1,086,684 · +1.9%
- By 2040
- 1,117,160 · +4.8%
- By 2050
- 1,149,778 · +7.9%
- By 2075
- 1,271,480 · +19.3%
- By 2100
- 1,321,160 · +23.9%
Race, ethnicity, and origin ACS 2023
- Neighborhood character
- Diverse neighborhood (Simpson 0.63)
- Race & ethnicity
- Hispanic / Latino 45% White 41% Two or more races 18% Asian 4% Black 3% Native American 3%
- Hispanic origin (detail)
- Mexican 41%
- Common ancestry
- Portuguese 2% Romanian 2% Lithuanian 2%
- Foreign-born
- 18% · Canada, China, Vietnam
- Languages at home
- 65% English-only · Spanish 30% Chinese 1% Vietnamese 1%
Political lean MEDSL · Pima
- 2024 margin
- D (+15.2) · D 57.0% · R 41.8% · Other 1.2%
- 2008→2024 swing
- +9.1pp toward D · 2008: 6.1pp · 2024: 15.2pp
- All cycles
- 2024: D+15.2 2020: D+18.7 2016: D+13.5 2012: D+5.8 2008: D+6.1
Not yet ingested
- Civics
- —
Market trends
- HPI YoY
- ▼ -163.31%
- Current HPI
- 283.0647
- Rent YoY
- ▲ 0.30%
- Metro
- Tucson, AZ
- State GDP YoY
- ▲ 4.54%
- F500 in state
- 20
Industry mix (Fortune 500 HQ in AZ)
| Industry | F500 HQs | Revenue |
|---|---|---|
| Technology | 2 | $13B |
|
||
| Mining / Metals | 1 | $23B |
|
||
| Environmental Services | 1 | $16B |
|
||
| Metals / Steel | 1 | $14B |
|
||
| Technology Distribution | 1 | $9B |
|
||
| Homebuilding | 1 | $8B |
|
||
Price history
1 event — show timeline
- 2026-05-30 Listed $49,900 MLSSAZ
Cash-flow waterfall
monthlySold comps — $/sqft
last 12 mo · ≤1 miLoading sold comps…