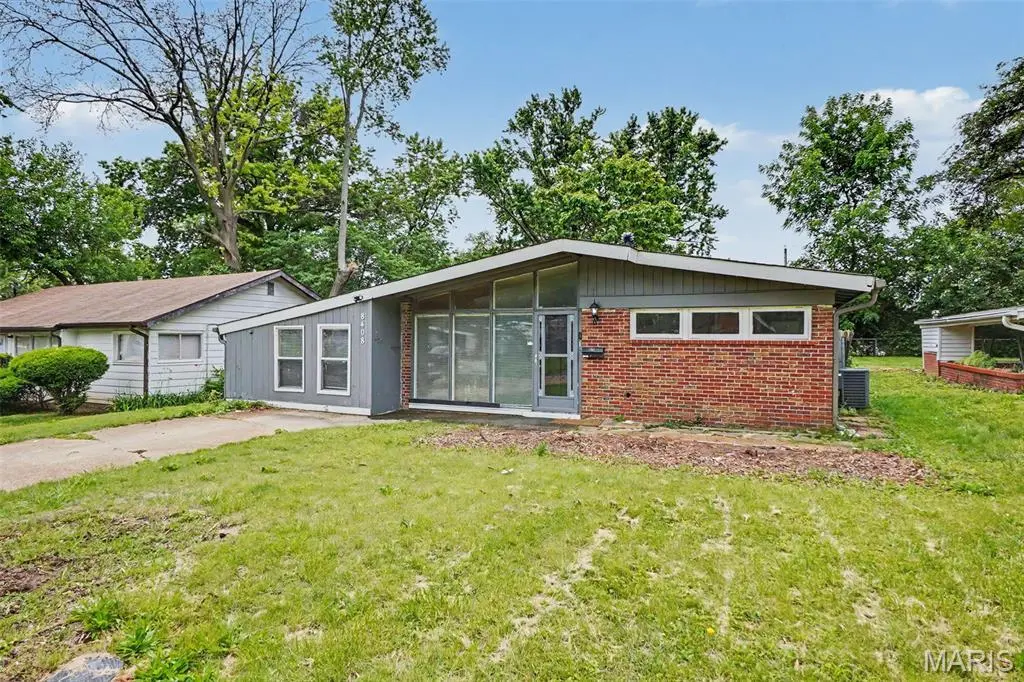
8408 Chalons Ct · Berkeley, MO
Flood risk 1/10 · Minimal
- FEMA flood zone
- X (unshaded)
- Chance of flooding over 30 yrs
- 0.0%
- Est. flood insurance / yr
- $507 – $1,088
Fire risk 1/10 · Minimal
- Est. fire insurance / yr
- $1,054 – $1,958
Heat risk 4/10 · Minor
- Hot days now (above 106°F)
- 7 days/yr
- Hot days in 30 yrs
- 21 days/yr
Wind risk 2/10 · Minimal
- Chance of severe wind over 30 yrs
- 1.0%
Air-quality risk 3/10 · Minor
- Unhealthy air days now
- 3 days/yr
- Unhealthy air days in 30 yrs
- 5 days/yr
Risk factors via First Street. Map © Google.
Why this score? — see what drove the D- grade
The composite is a weighted blend of 9 inputs, each scored 0–100. Each bar is that input's sub-score; the figure is the points it added to the 100-point composite (weight × sub-score).
- Cash flow +16.3/30.0
- DSCR +5.1/10.0
- ARV discount +4.4/15.0
- 1% rule +3.5/10.0
- Rent growth +2.9/5.0
- Livability +2.7/5.0
- Condition / age +2.5/5.0
- Schools +1.2/10.0
- Appreciation +0.0/10.0
$175,000
🖨 Deal sheet 📄 Offer letter ✓ Due diligence
Listing remarks MLS
This newly renovated brick ranch house is cozy and spacious with 4 bedrooms, 1 full bathroom. It is in a gorgeous and quiet neighborhood with a large backyard. Enter the front door and you are welcomed home by the living room. The beautiful porcelain tiles carry through the living room, hallway and kitchen. New luxury vinyl flooring flows throughout 3 bedrooms and family room. The bathroom and laundry room were remodeled with bright polished porcelain tiles. Enjoy the updated open kitchen with the new counter and newly painted closets. The other features include all new interior paint, all brand-new lights, a new water heater, zoned heating systems, new electricity panel. Expand your entertainment space outside to the patio overlooking the fenced, large backyard with a storage shed for all your lawn care tools. Centrally Located in Frostwood subdivision near N.Haley Road and Highway 170 and 270.
Key facts
- 8,359 sq ft lot
- Built 1953
- Listed 16 days
Property features AI
Finance
- Other: Private ownership; Living area approximately 1,722 (estimated)
- Financial info: Seller may consider concessions; Lease not considered
Exterior
- Parking: Driveway parking
- Utilities: Public water; Public sewer; Electricity connected; Natural gas connected
- Home design: Single-family residence; One-story house; Updated / remodeled condition; Slab foundation
- Construction: Brick veneer exterior; Shingle roof
- Exterior features: Front porch; Patio; Back and front yard; Chain link and privacy fencing; Equipment shed / storage shed
Interior
- Kitchen: Electric cooktop; Electric oven; Refrigerator; Garbage disposal; Eat-in layout open to living room
- Bedrooms: Four main-level bedrooms (sizes include 11x9, 11x9, 11x8, 16x10). One bedroom counted by municipality does not have a closet
- Flooring: Carpet; Ceramic tile
- Bathrooms: One full bathroom on the main level
- Heating & cooling: Forced air heating (natural gas) with zoned system; Central air conditioning (electric)
- Interior features: Open floorplan with kitchen/dining combo; Eat-in kitchen; Large living room open to dining and kitchen; Family room with wood-burning fireplace; Accessible central living area, common area, and entrance; 9 total rooms
- Laundry & utility: Main-level laundry (9x8)
Neighborhood map
What this means for you Summary
Snapshot
- This is a 4-bed/1.0-bath single-family listed at $175k.
Deal economics
- At list price, monthly cash flow is $97 ($1k/yr) — positive.
- The deal already cash-flows at list — no discount required.
- To meet the 1% rule (rent ≥ 1% of price), the offer needs to be $148k (15.5% below list).
- Recommended offer: $148k (15.5% below list) — sets the bar for 1% rule.
- Cap rate 7.0% vs local median 10.1% in Berkeley — below-typical yield; the buyer is paying a premium for something (appreciation thesis, condition, location) that the cap rate doesn't capture.
Location & tenants
- Location reads 54/100 on livability (#774 in MO) — a working-class tenant base; expect higher turnover. Strengths: cost of living A+, housing A; Watch: health & safety C-, crime F, amenities F.
- Ferguson-Florissant R-II (suburban): math 7% / reading 20% proficiency, ranked #311 of 324 in MO (top 96%) — low school quality limits family demand, transient renter base, plan for 1-2y turnover; 70% free/reduced lunch — lower-income household profile, screen leases tightly.
- Zoned schools: Walnut Grove Elem. (342 students, 99% FRL); Mccluer High (math 0% / reading 17%, grade F, #511 of 521 statewide, top 98%, 1,181 students, 100% FRL) — zoned schools average 99% FRL vs 70% district-wide (30 pts higher); higher-poverty schools than district average — tighter screening recommended.
- Market conditions: Rents rising (+1.6%/yr); 70 active listings in the ZIP; 13 comparable units currently listed for rent nearby; rentals at typical pace (median 24d on market — plan ~3-4 weeks tenant-placement turnaround); lower-income renter base — watch delinquency; 920 units permitted in St. Louis County in 2024 (250 in 5+ unit buildings).
- This rent runs 40% of the median local income ($45k/yr) — at the standard rent-burdened threshold; future hikes will face affordability resistance.
Forward outlook
- Local home prices are declining (-3.0%/yr); year-one equity from $1k of loan paydown is wiped out by about $5k of value loss. Plan a longer hold.
Negotiation context
- It's been on market 17 days — a 2% lower offer ($172k) is reasonable based on typical stale-listing flexibility.
- 3 sale attempts since 4y ago; this cycle's ask is 40% above the opening price — seller raised mid-cycle; expect resistance to lowballs.
- Current owner paid $48k; list at $175k implies a 265% gain — meaningful room to come down on a strong offer.
Risks & watch-outs
- Watch-outs: built in 1953 — expect roof / HVAC / electrical / plumbing capex.
Questions for the listing agent
- Built in 1953 — when were the roof, HVAC, electrical panel, plumbing, and water heater last replaced?
- Is there a deadline driving the sale (1031 exchange, divorce, estate, relocation)? That informs how much negotiation room exists.
- Schools are F-rated, which usually means shorter tenancies and higher turnover. Who's the typical renter profile here, and what's been the actual vacancy rate?
- Crime grade is F in this area — have there been break-ins, vandalism, or insurance claims at this property in the last 3 years? What carrier currently insures it and at what premium?
- The area grade is low — what's the realistic commute time and amenity access for the typical tenant pool here? Any planned neighborhood developments (good or bad) we should know about?
- What's the average days-on-market for RENTAL listings here right now (not sales)? A rising rental-DOM trend means longer vacancies and softer asking-rent achievability than the comps imply.
- What's the recent tenant-quality profile in this submarket — average credit score on applications, eviction rate, late-payment / NSF rate, and stable-employment percentage? A property-management company in the area should have these aggregated.
- How much new for-sale + rental construction is in the pipeline within 1–3 miles? Heavy new supply typically softens prices + rents 12–24 months out; constrained supply supports both.
Investment metrics
- 1% rule
- 0.85% ✗
- Cap rate
- 6.96%
- Cash-on-cash
- 2.37%
- DSCR
- 1.11
- GRM
- 9.9
CMA / ARV
- ARV (on-the-fly)
- $163,590
- Comps found
- 12
Show comp detail 12 sales within ~0.75 mi
| Address | Dist | Beds/Ba | Sqft | Sold | Price | $/sf | Match |
|---|---|---|---|---|---|---|---|
| 8354 Latty Ave | 0.29mi | 4/2.0 | 1,758 (+2%) | 5mo | $189,900 | $108 | 75 |
| 8613 Elwyn Dr | 0.38mi | 3/2.0 (-1) | 1,660 (-4%) | 8mo | $144,900 | $87 | 60 |
| 8408 Buckthorn Dr | 0.43mi | 4/2.0 | 1,648 (-4%) | 10mo | $89,900 | $55 | 60 |
| 6701 Alder Ave | 0.27mi | 4/1.5 | 1,536 (-11%) | 10mo | $145,400 | $95 | 59 |
| 7241 Berkridge Dr | 0.60mi | 3/1.5 (-1) | 1,680 (-2%) | 6mo | $184,900 | $110 | 56 |
| 47 Young Dr | 0.73mi | 3/1.0 (-1) | 1,690 (-2%) | 11mo | $149,900 | $89 | 49 |
| 225 Sadonia Ave | 0.48mi | 3/2.5 (-1) | 1,496 (-13%) | 4mo | $105,000 | $70 | 42 |
| 968 Buckeye Dr | 0.64mi | 3/2.0 (-1) | 1,980 (+15%) | 2mo | $179,995 | $91 | 34 |
| 8723 Nyflot Ave | 0.71mi | 3/2.0 (-1) | 1,505 (-13%) | 5mo | $180,000 | $120 | 32 |
| 902 Ford Dr | 0.68mi | 3/2.0 (-1) | 1,514 (-12%) | 9mo | $189,900 | $125 | 32 |
| 962 Buckeye Dr | 0.66mi | 3/1.5 (-1) | 1,967 (+14%) | 10mo | $179,900 | $91 | 30 |
| 37 Grether Ave | 0.75mi | 3/1.5 (-1) | 1,484 (-14%) | 12mo | $159,900 | $108 | 25 |
Match score weights: distance 35% · size 25% · config 20% · recency 20%. Top-matched comps best support the ARV.
Projected returns pro-forma
-3.0% appreciation · 1.61% rent growth · sell at horizon
- IRR
- -14.0%
- Equity multiple
- 0.50×
- Total profit
- $-24,303
- Equity at exit
- $26,093
- IRR
- -7.4%
- Equity multiple
- 0.56×
- Total profit
- $-21,629
- Equity at exit
- $15,131
Cash invested: $49,000 (down + closing). Projections, not guarantees.
Landlord ↔ Tenant lean methodology
- Overall (STATE)
- 81 Strongly Landlord-Friendly
- State Missouri
- 81 Strongly Landlord-Friendly · R+10
- County
- — inherits STATE
- City
- — inherits STATE
ZIP-level market 63134
- Rents YoY
- 1.6%
- Active inventory
- 70
- Price-to-rent
- 9.9×
Monthly cashflow live
- Estimated rent
- $1,479 high interval (Pro) →
- Mortgage (P&I)
- −$918
- Tax from tax record
- −$81 /mo · $974/yr
- Insurance
- −$73
- HOA
- −$0
- Vacancy / Maint / Mgmt
- −$311
- Net cashflow
- $97
Break-even live
UW: 25.0% down · 7.5% · 30yr · 1.5% tax · 5.0% vac · 8.0% maint · 8.0% mgmt
Financing live
Cash to close
- Down payment
- $43,750
- Closing costs
- $5,250
- Reserves months
- —
- Total cash needed
- —
Loan-product check · same deal, 3 products live
Conventional
25% down · 7.5% · 30yr
- Down + closing
- —
- Monthly P&I
- —
- Monthly cashflow
- —
- DSCR
- —
- Eligible?
- —
Personal DTI + credit; lowest rate.
DSCR
20% down · 8.5% · 30yr
- Down + closing
- —
- Monthly P&I
- —
- Monthly cashflow
- —
- DSCR
- —
- Eligible?
- —
No personal income docs; deal must DSCR.
Hard money
10% down · 12.0% · 12mo
- Down + closing
- —
- Monthly P&I
- —
- Monthly cashflow
- —
- DSCR
- —
- Eligible?
- —
Short-term bridge; refi at stabilization.
Rent comps 13 comps
| Address | Beds | Baths | Sqft | Rent | $/sqft | DOM | Units | Dist |
|---|---|---|---|---|---|---|---|---|
| 8412 Chalons Ct Saint Louis, MO | 3.0 | 1.0 | 1380 | $1,370 | $0.99 | 23d | 1 | 0.03mi |
| 8330 Woodhurst Dr Saint Louis, MO | 3.0 | 1.0 | 1120 | $1,000 | $0.89 | 7d | 1 | 0.15mi |
| 8418 Bayberry Dr Saint Louis, MO | 3.0 | 2.0 | 1288 | $1,350 | $1.05 | 21d | 1 | 0.23mi |
| 8437 January Ave Saint Louis, MO | 3.0 | 2.0 | 1288 | $1,350 | $1.05 | 43d | 1 | 0.32mi |
| 6698 Amora Ave Berkeley, MO | 2.0–3.0 | 1.5 | 1625 | $1,500 | $0.92 | 43d | 1 | 0.39mi |
| 260 Sadonia Ave Saint Louis, MO | 3.0 | 2.0 | 1088 | $1,623 | $1.49 | 20d | 1 | 0.40mi |
| 6452 Evergreen Blvd Saint Louis, MO | 3.0 | 2.0 | 1288 | $1,500 | $1.16 | 23d | 1 | 0.44mi |
| 8439 Alder Ave Saint Louis, MO | 3.0 | 1.5 | 1176 | $1,425 | $1.21 | 23d | 1 | 0.45mi |
| 6867 Thurston Ave Saint Louis, MO | 3.0 | 2.0 | 1243 | $1,580 | $1.27 | 43d | 1 | 0.54mi |
| 153 Bascom Dr Saint Louis, MO | 3.0 | 1.0 | 1076 | $1,195 | $1.11 | 19d | 1 | 0.63mi |
| 11 Anistasia Dr Saint Louis, MO | 3.0 | 1.5 | 1120 | $1,345 | $1.20 | 23d | 1 | 0.85mi |
| 1131 N Florissant Rd Saint Louis, MO | 3.0 | 1.0 | 1580 | $1,390 | $0.88 | 23d | 1 | 0.92mi |
| 1455 S New Florissant Rd Florissant, MO | 4.0 | 1.0 | 1584 | $1,721 | $1.09 | 43d | 1 | 1.03mi |
Listing history 15 events
-
2026-06-18days on market $175,000 Active 17 DOM
-
2026-06-17days on market $175,000 Active 16 DOM
-
2026-06-16days on market $175,000 Active 15 DOM
-
2026-06-15days on market $175,000 Active 14 DOM
-
2026-06-13days on market $175,000 Active 12 DOM
-
2026-06-13pricedays on market $175,000 Active 11 DOM
-
2026-06-09days on market $200,000 Active 8 DOM
-
2026-06-08days on market $200,000 Active 7 DOM
-
2026-06-07days on market $200,000 Active 6 DOM
-
2026-06-05days on market $200,000 Active 3 DOM
-
2026-06-03days on market $200,000 Active 2 DOM
-
2026-06-02statusdays on market $200,000 Active 1 DOM
-
2026-06-01days on market $200,000 Coming Soon 3 DOM
-
2026-05-31remarks 695-char remark
-
2026-05-31$200,000 Coming Soon 2 DOM
ⓘ Source: listings_history table (triggers on properties + properties_extension) + one-shot
backfill from property_details.listing_events for pre-trigger history.
Tax reassessment forecast MO · Resets to sale price
- Current annual tax
- $974 · $81/mo
- Projected year-2 tax
- $1,698 · $141/mo
- Expected delta
- +$724/yr (+$60/mo · 74.4%)
ⓘ Screening estimate from a state-policy table — verify with the county assessor before closing.
Climate risk First Street
- Flood 1/10 Low FEMA zone X (unshaded) · 0% chance over 30 yrs
- Wildfire 1/10 Low
- Heat 4/10 Moderate 7 d/yr ≥106°F today · 21 d/yr by 30 yrs out
- Wind 2/10 Low 100% chance of damaging wind over 30 yrs
- Air quality 3/10 Moderate 3 unhealthy d/yr today · 5 by 30 yrs out
Nearby sold comps map
Loading sold comps map…
Walkable amenities ~0.75 mi
Loading nearby amenities…
Taxation est. · year 1
- Rental income
- $17,748
- − Mortgage interest
- −$9,803
- − Property taxes
- −$974
- − Insurance
- −$875
- − Repairs & maintenance
- −$1,420
- − Management
- −$1,420
- − Depreciation
- −$5,091
- Taxable loss
- −$1,834
- Est. tax savings @ 24.0%
- +$440
- After-tax cash flow
- $1,600/yr
For passive investors: Depreciation is non-cash, so a rental often shows a tax loss while cash-flowing — sheltering income. Rental losses are passive: they offset passive income freely, and up to $25,000/yr can offset ordinary (W-2) income if you actively participate and your MAGI is under $100k (phasing out to $0 by $150k); unused losses carry forward. On sale, claimed depreciation is recaptured at up to 25%, and gains may owe capital-gains tax (a 1031 exchange can defer both). Figures are a year-1 estimate at your 24.0% rate — not tax advice; consult a CPA.
Schools (NCES district)
- District
- Ferguson-Florissant R-II
- NCES district ID
- 2912010
- Math proficiency
- 7% ▼ -9.00%
- Reading proficiency
- 20% ▼ -6.00%
- Median HH income
- $44,610
- Composite
- 11.96/100
- National rank
- #9666
- State rank
- #311 of 324 in MO
Livability — Berkeley
- Score
- 54/100
- State rank
- #774
- US rank
- #23800
Category grades
Schools grade is shown separately in the Schools card above.
Census & demographics
- Census place
- Berkeley, MO
- County
- Saint Louis County · 888,823 people
- City population
- 13,059
- Metro
- St. Louis, MO-IL
- Population (ZIP)
- 13,059
- Household income
- $44,680
- Rent vs Own
- Severe rent burden
- 655.0
Population outlook (St. Louis County) Hauer SSP2
- Today (2025)
- 1,025,227 people
- By 2030
- 1,028,023 · +0.3%
- By 2040
- 1,020,940 · -0.4%
- By 2050
- 1,007,280 · -1.8%
- By 2075
- 987,277 · -3.7%
- By 2100
- 921,984 · -10.1%
Race, ethnicity, and origin ACS 2023
- Neighborhood character
- Predominantly Black (66%)
- Race & ethnicity
- Black 66% White 17% Hispanic / Latino 13% Two or more races 7%
- Hispanic origin (detail)
- Mexican 8%
- Common ancestry
- Lithuanian 1%
- Foreign-born
- 6% · Canada
- Languages at home
- 86% English-only · Spanish 11%
Political lean MEDSL · St. Louis
- 2024 margin
- Strong D (+23.4) · D 60.8% · R 37.4% · Other 1.7%
- 2008→2024 swing
- +3.5pp toward D · 2008: 19.9pp · 2024: 23.4pp
- All cycles
- 2024: D+23.4 2020: D+24.0 2016: D+16.2 2012: D+13.7 2008: D+19.9
Not yet ingested
- Civics
- —
Market trends
- HPI YoY
- ▼ -164.02%
- Current HPI
- 226.9524
- Rent YoY
- ▲ 1.61%
- Metro
- St. Louis, MO-IL
- State GDP YoY
- ▲ 1.84%
- F500 in state
- 20
Industry mix (Fortune 500 HQ in MO)
| Industry | F500 HQs | Revenue |
|---|---|---|
| Healthcare | 1 | $163B |
|
||
| Insurance | 1 | $21B |
|
||
| Industrial Technology | 1 | $17B |
|
||
| Retail | 1 | $16B |
|
||
| Industrial Distribution | 1 | $10B |
|
||
| Utilities | 1 | $9B |
|
||
Price history
+109.1% since first listed14 events — show timeline
- 2023-06-12 Sold (Public Records) — Public Records
- 2023-06-08 Sold (MLS) — MARIS as Distributed by MLS Grid
- 2023-05-16 Pending — MARIS as Distributed by MLS Grid
- 2023-05-04 Price Changed $115,000 MARIS as Distributed by MLS Grid
- 2023-04-25 Price Changed $119,000 MARIS as Distributed by MLS Grid
- 2023-04-12 Listed $125,000 MARIS as Distributed by MLS Grid
- 2022-06-28 Sold (Public Records) $48,000 Public Records
- 2022-06-27 Pending — MARIS as Distributed by MLS Grid
- 2022-06-21 Sold (MLS) — MARIS as Distributed by MLS Grid
- 2022-06-13 Contingent — MARIS as Distributed by MLS Grid
- 2022-06-03 Relisted — MARIS as Distributed by MLS Grid
- 2022-06-02 Contingent — MARIS as Distributed by MLS Grid
- 2022-05-28 Listed $55,000 MARIS as Distributed by MLS Grid
- 1989-05-01 Sold (Public Records) — Public Records
Property tax history
-0.9%/yrLatest (2022): $974 · +0.7% YoY. Source: county tax records.
Cash-flow waterfall
monthlySold comps — $/sqft
last 12 mo · ≤1 miLoading sold comps…