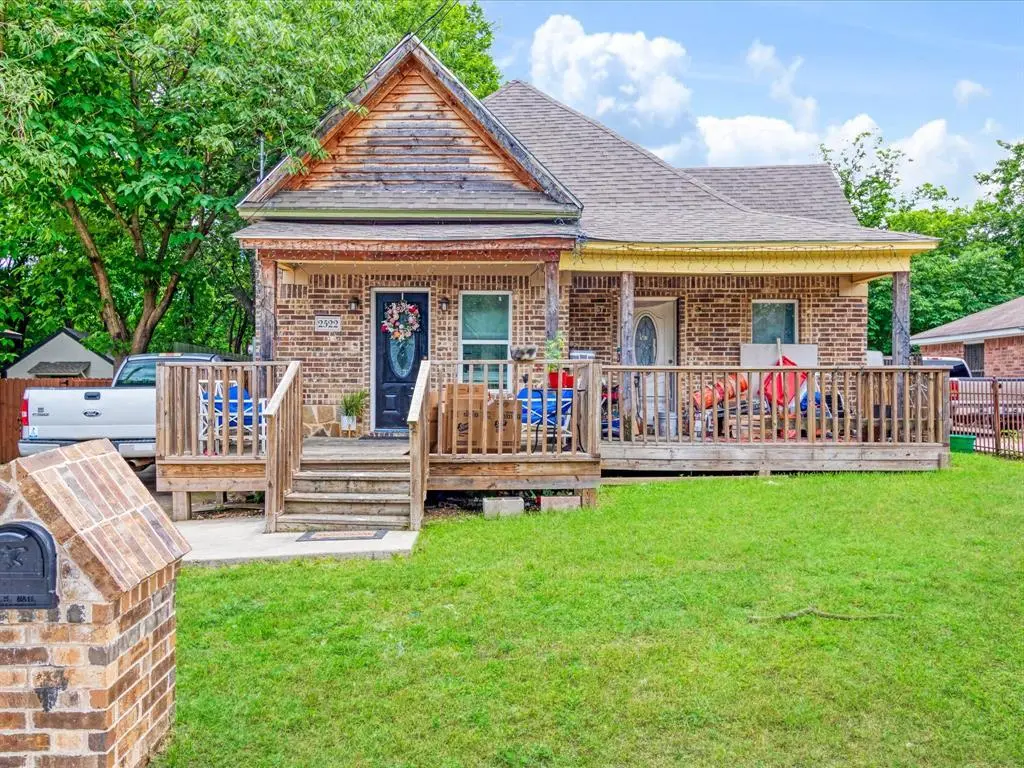
2522 Wilhurt Ave · Dallas, TX
Flood risk 1/10 · Minimal
- FEMA flood zone
- X (unshaded)
- Chance of flooding over 30 yrs
- 0.0%
- Est. flood insurance / yr
- $507 – $1,088
Fire risk 3/10 · Minor
- Est. fire insurance / yr
- $1,222 – $2,270
Heat risk 7/10 · Major
- Hot days now (above 109°F)
- 7 days/yr
- Hot days in 30 yrs
- 25 days/yr
Wind risk 6/10 · Moderate
- Chance of severe wind over 30 yrs
- 27.0%
Air-quality risk 2/10 · Minimal
- Unhealthy air days now
- 1 days/yr
- Unhealthy air days in 30 yrs
- 2 days/yr
Risk factors via First Street. Map © Google.
Why this score? — see what drove the C- grade
The composite is a weighted blend of 9 inputs, each scored 0–100. Each bar is that input's sub-score; the figure is the points it added to the 100-point composite (weight × sub-score).
- ARV discount +15.0/15.0
- Cash flow +13.4/30.0
- 1% rule +5.8/10.0
- DSCR +4.0/10.0
- Livability +4.0/5.0
- Rent growth +3.6/5.0
- Schools +2.8/10.0
- Condition / age +2.5/5.0
- Appreciation +0.0/10.0
$160,000
🖨 Deal sheet 📄 Offer letter ✓ Due diligence
Listing remarks
Investor special with TONS of potential! Brick 4 bedroom 2 bath situated on a spacious lot many nearby homes being renovated or newer homes being built, This property features high ceilings, granite countertops, and stylish kitchen backsplash. The stand out is the massive ALL CONCRETE BACKYARD area, providing endless possibilities for entertaining, parking, workshop space outdoor living or future additions. The home also includes large deck space that add even more potential for customization. Property does need TLC and foundation repair, making it the perfect opportunity for a flipper or investor ready to bring this home to it full potential. Great bones. Sold AS-IS. buyer and buyer's agen
Key facts
- Large deck space
- High ceilings
- Granite countertops
Tags
Property features AI
Finance
- Other: Possession at closing/funding; Listing status: Active; Special listing conditions: Standard
- Financial info: Listing terms: Cash or Conventional; Loan type listed as treat as clear; No second mortgage indicated
- HOA & community: No association (no HOA)
Exterior
- Parking: Driveway; Alley access; Additional parking (no garage or covered/carport spaces)
- Security: Smoke detector(s)
- Utilities: City water; City sewer; Not in a municipal utility district
- Home design: Single-family residence; Residential property; One story; Not attached to another property; Year built: 1940; Unknown encumbrance(s) noted
- Construction: Brick and wood construction; Pillar/post/pier foundation; Composition/shingle/other roof
- Exterior features: Covered deck; Deck; Wood fencing; Other fencing
Interior
- Kitchen: Granite counters; Electric cooktop; Disposal
- Bedrooms: 4 bedrooms, all on the main level (primary bedroom on level 1)
- Flooring: Ceramic tile; Vinyl; Other flooring
- Bathrooms: 2 full bathrooms (both on the main level)
- Heating & cooling: Central air; Ceiling fan(s); Window unit(s); Electric heating
- Interior features: Open floorplan; Granite counters; Disposal; Electric cooktop; Other built-in appliances; One living area; One dining area; Total rooms: 8; Levels: One
- Laundry & utility: Full-size washer/dryer area; Other utility features
Neighborhood map
What this means for you Summary
Snapshot
- This is a 3-bed/1.0-bath single-family listed at $160k.
Deal economics
- At list price, monthly cash flow is $4 ($48/yr) — positive.
- The deal already cash-flows at list — no discount required.
- Meets the 1% rule at list price ($2k rent vs $160k).
- Recommended offer: $158k (1.5% below list) — sets the bar for market timing.
- Cap rate 6.3% vs local median 2.3% in Dallas — top-decile yield for the area; either an underpriced asset or a hidden risk that comps aren't pricing in. Stress-test before assuming the spread holds.
Location & tenants
- Location reads 81/100 on livability (#24 in TX, #1,380 nationally) — a professional / high-income tenant draw. Strengths: amenities A+, commute A+, housing A+; Watch: crime F.
- Dallas ISD (urban): math 31% / reading 36% proficiency, ranked #559 of 826 in TX (top 68%) — families likely to look elsewhere, expect single-tenant / working-renter base with shorter leases; 83% free/reduced lunch — lower-income household profile, screen leases tightly.
- Zoned schools: Whitney M Young Jr El (math 12% / reading 12%, grade F, #4,207 of 4,322 statewide, top 98%, 313 students, 91% FRL).
- Zoned-school proficiency averages 12% at this address vs 34% district-wide (-22 pts) — the specific schools serving this property underperform the Dallas ISD average; the district grade overstates school quality for this exact location.
- Market conditions: Rents rising fast (+4.2%/yr); 249 active listings in the ZIP; 31 comparable units currently listed for rent nearby; rentals at typical pace (median 22d on market — plan ~3-4 weeks tenant-placement turnaround); lower-income renter base — watch delinquency; 12,577 units permitted in Dallas County in 2024 (6,829 in 5+ unit buildings).
- At $1,730/mo this rent would consume 50% of the median local household income ($41k/yr) (locally 2465% of renters already pay >50% of income on rent) — very limited rent-growth headroom before tenants either downsize or default.
Forward outlook
- Local home prices are declining (-3.0%/yr); year-one equity from $1k of loan paydown is wiped out by about $5k of value loss. Plan a longer hold.
- Dallas County population projected at +35% by 2050 — long-run rental-demand tailwind backs the buy-and-hold thesis.
Negotiation context
- It's been on market 19 days — a 2% lower offer ($158k) is reasonable based on typical stale-listing flexibility.
Risks & watch-outs
- Watch-outs: property tax is 3.4% of price; built in 1940 — expect roof / HVAC / electrical / plumbing capex.
- Climate carrying-cost: major wind risk, 27% chance of damaging wind over 30y; extreme-heat days projected 7→25/yr by 2055 (HVAC capex compounding) — expect insurance premiums to compound above CPI over the hold.
Questions for the listing agent
- Built in 1940 — when were the roof, HVAC, electrical panel, plumbing, and water heater last replaced?
- Property tax is high relative to price — has the assessment been appealed recently, and will the sale trigger a re-assessment?
- Is there a deadline driving the sale (1031 exchange, divorce, estate, relocation)? That informs how much negotiation room exists.
- Crime grade is F in this area — have there been break-ins, vandalism, or insurance claims at this property in the last 3 years? What carrier currently insures it and at what premium?
- What's the average days-on-market for RENTAL listings here right now (not sales)? A rising rental-DOM trend means longer vacancies and softer asking-rent achievability than the comps imply.
- What's the recent tenant-quality profile in this submarket — average credit score on applications, eviction rate, late-payment / NSF rate, and stable-employment percentage? A property-management company in the area should have these aggregated.
- How much new for-sale + rental construction is in the pipeline within 1–3 miles? Heavy new supply typically softens prices + rents 12–24 months out; constrained supply supports both.
Investment metrics
- 1% rule
- 1.08% ✓
- Cap rate
- 6.32%
- Cash-on-cash
- 0.11%
- DSCR
- 1.00
- GRM
- 7.7
CMA / ARV
- ARV (on-the-fly)
- $195,308
- Comps found
- 12
Show comp detail 12 sales within ~0.75 mi
| Address | Dist | Beds/Ba | Sqft | Sold | Price | $/sf | Match |
|---|---|---|---|---|---|---|---|
| 2662 Wilhurt Ave | 0.22mi | 3/2.0 | 1,300 (+4%) | 1mo | $225,000 | $173 | 78 |
| 2407 Volga Ave | 0.33mi | 3/2.0 | 1,274 (+2%) | 3mo | $199,900 | $157 | 74 |
| 2427 Hudspeth Ave | 0.40mi | 3/1.0 | 1,192 (-4%) | 1mo | $179,000 | $150 | 73 |
| 4324 Tacoma St | 0.49mi | 3/1.0 | 1,208 (-3%) | 3mo | $185,000 | $153 | 70 |
| 2148 Kathleen Ave | 0.54mi | 3/2.0 | 1,250 (+0%) | 1mo | $259,500 | $208 | 69 |
| 2621 Volga Ave | 0.29mi | 3/1.0 | 1,340 (+8%) | 6mo | $120,000 | $90 | 69 |
| 2665 Locust Ave | 0.24mi | 3/2.0 | 1,076 (-14%) | 3mo | $131,200 | $122 | 60 |
| 2703 Marjorie Ave | 0.50mi | 4/2.0 (+1) | 1,320 (+6%) | 1mo | $259,000 | $196 | 57 |
| 2218 Kathleen Ave | 0.47mi | 2/1.0 (-1) | 1,128 (-9%) | 2mo | $155,900 | $138 | 56 |
| 2725 Custer Dr | 0.31mi | 3/2.0 | 1,073 (-14%) | 5mo | $195,000 | $182 | 54 |
| 3432 Kellogg Ave | 0.66mi | 3/2.0 | 1,351 (+9%) | 3mo | $190,000 | $141 | 48 |
| 2628 Lea Crest Dr | 0.56mi | 3/2.0 | 1,100 (-12%) | 4mo | $217,500 | $198 | 48 |
Match score weights: distance 35% · size 25% · config 20% · recency 20%. Top-matched comps best support the ARV.
Projected returns pro-forma
-3.0% appreciation · 4.2% rent growth · sell at horizon
- IRR
- -14.4%
- Equity multiple
- 0.48×
- Total profit
- $-23,374
- Equity at exit
- $23,857
- IRR
- -3.2%
- Equity multiple
- 0.77×
- Total profit
- $-10,391
- Equity at exit
- $13,834
Cash invested: $44,800 (down + closing). Projections, not guarantees.
Landlord ↔ Tenant lean methodology
- Overall (STATE)
- 87 Strongly Landlord-Friendly
- State Texas
- 87 Strongly Landlord-Friendly · R+5
- County
- — inherits STATE
- City
- — inherits STATE
ZIP-level market 75216
- Home prices YoY
- -29.7%
- Rents YoY
- 4.2%
- Active inventory
- 249
- Price-to-rent
- 7.7×
Monthly cashflow live
- Estimated rent
- $1,730 high interval (Pro) →
- Mortgage (P&I)
- −$839
- Tax from tax record
- −$457 /mo · $5,481/yr
- Insurance
- −$67
- HOA
- −$0
- Vacancy / Maint / Mgmt
- −$363
- Net cashflow
- $4
Break-even live
UW: 25.0% down · 7.5% · 30yr · 1.5% tax · 5.0% vac · 8.0% maint · 8.0% mgmt
Financing live
Cash to close
- Down payment
- $40,000
- Closing costs
- $4,800
- Reserves months
- —
- Total cash needed
- —
Loan-product check · same deal, 3 products live
Conventional
25% down · 7.5% · 30yr
- Down + closing
- —
- Monthly P&I
- —
- Monthly cashflow
- —
- DSCR
- —
- Eligible?
- —
Personal DTI + credit; lowest rate.
DSCR
20% down · 8.5% · 30yr
- Down + closing
- —
- Monthly P&I
- —
- Monthly cashflow
- —
- DSCR
- —
- Eligible?
- —
No personal income docs; deal must DSCR.
Hard money
10% down · 12.0% · 12mo
- Down + closing
- —
- Monthly P&I
- —
- Monthly cashflow
- —
- DSCR
- —
- Eligible?
- —
Short-term bridge; refi at stabilization.
Rent comps 31 comps
| Address | Beds | Baths | Sqft | Rent | $/sqft | DOM | Units | Dist |
|---|---|---|---|---|---|---|---|---|
| 4306 Landrum Ave Dallas, TX | 3.0 | 2.0 | 1226 | $1,695 | $1.38 | 6d | 1 | 0.27mi |
| 4306 Landrum Ave Dallas, TX | 3.0 | 2.0 | 1226 | $1,695 | $1.38 | 2d | 1 | 0.27mi |
| 2503 Stovall Dr Dallas, TX | 2.0 | 2.0 | 768 | $2,300 | $2.99 | 43d | 1 | 0.60mi |
| 2538 Stovall Dr Dallas, TX | 3.0 | 1.0 | 986 | $1,625 | $1.65 | 5d | 1 | 0.62mi |
| 2303 Deer Path Dr Dallas, TX | 2.0 | 1.0 | 790 | $1,650 | $2.09 | 7d | 1 | 0.69mi |
| 3320 Mundy Dr Dallas, TX | 3.0 | 2.0 | 1010 | $1,695 | $1.68 | 43d | 1 | 0.70mi |
| 3206 Kellogg Ave Dallas, TX | 3.0 | 1.5 | 1076 | $1,800 | $1.67 | 43d | 1 | 0.75mi |
| 3024 Modree Ave Dallas, TX | 3.0 | 2.0 | 1149 | $1,700 | $1.48 | 43d | 1 | 0.80mi |
| 4836 Sunnyvale St Dallas, TX | 1.0–3.0 | 1.0–2.0 | 515 | $1,512 | $2.94 | 43d | 7 | 0.84mi |
| 2751 E Ledbetter Dr Dallas, TX | 1.0–3.0 | 1.0–1.5 | 794 | $1,410 | $1.78 | 43d | 3 | 0.85mi |
| 4417 S Lancaster Rd Dallas, TX | 2.0 | 1.0–2.0 | 874 | $1,595 | $1.82 | 2d | 1 | 0.86mi |
| 3930 S Denley Dr Dallas, TX | 3.0 | 2.0 | 1135 | $1,900 | $1.67 | 7d | 1 | 0.87mi |
| 2625 E Illinois Ave Dallas, TX | 2.0 | 1.0 | 750 | $1,050 | $1.40 | 19d | 1 | 0.93mi |
| 2625 E Illinois Ave Dallas, TX | 2.0 | 1.0 | 750 | $1,050 | $1.40 | 4d | 1 | 0.93mi |
| 2625 E Illinois Ave Dallas, TX | 1.0–2.0 | 1.0 | 700 | $1,050 | $1.50 | 12d | 18 | 0.93mi |
| 2625 E Illinois Ave Unit 102 Dallas, TX | 2.0 | 1.0 | 750 | $1,050 | $1.40 | 24d | 1 | 0.95mi |
| 4105 Balch Dr Dallas, TX | 3.0 | 2.5 | 1464 | $1,650 | $1.13 | 43d | 1 | 0.95mi |
| 1717 Hemphill Dr Dallas, TX | 3.0 | 1.0 | 1222 | $1,695 | $1.39 | 24d | 1 | 0.95mi |
| 3015 E Ledbetter Dr Dallas, TX | 2.0–3.0 | 2.0 | 1030 | $1,475 | $1.43 | 3d | 1 | 0.96mi |
| 2723 Kellogg Ave Dallas, TX | 3.0 | 2.0 | 1255 | $1,700 | $1.35 | 7d | 1 | 1.00mi |
| 3035 E Ledbetter Dr Dallas, TX | 1.0–2.0 | 1.0 | 643 | $1,275 | $1.98 | 3d | 1 | 1.02mi |
| 1618 Marfa Ave Dallas, TX | 3.0 | 2.0 | 1100 | $1,900 | $1.73 | 43d | 1 | 1.04mi |
| 2023 E Illinois Ave Dallas, TX | 2.0 | 1.5 | 1304 | $1,695 | $1.30 | 22d | 1 | 1.09mi |
| 1334 Marfa Ave Dallas, TX | 3.0 | 2.0 | 1100 | $1,475 | $1.34 | 43d | 1 | 1.29mi |
| 5160 Cardiff St Dallas, TX | 4.0 | 2.0 | 1251 | $1,950 | $1.56 | 4d | 1 | 1.29mi |
| 4934 Kildare Ave Dallas, TX | 3.0 | 2.0 | 1118 | $1,595 | $1.43 | 24d | 1 | 1.30mi |
| 5175 Cardiff St Dallas, TX | 3.0 | 1.0 | 1248 | $1,650 | $1.32 | 43d | 1 | 1.32mi |
| 3130 Stag Rd Dallas, TX | 1.0–3.0 | 1.0–2.0 | 831 | $1,469 | $1.77 | 43d | 3 | 1.42mi |
| 3460 South Loop 12 Dallas, TX | 2.0 | 1.5 | 867 | $1,150 | $1.33 | 6d | 1 | 1.47mi |
| 3460 South Loop 12 Dallas, TX | 1.0–2.0 | 1.0–1.5 | 758 | $1,150 | $1.52 | 12d | 2 | 1.47mi |
| 3460 South Loop 12 Dallas, TX | 3.0 | 2.0 | 1048 | $1,350 | $1.29 | 24d | 1 | 1.47mi |
Listing history 14 events
-
2026-06-18days on market $160,000 Active 19 DOM
-
2026-06-17days on market $160,000 Active 18 DOM
-
2026-06-16days on market $160,000 Active 17 DOM
-
2026-06-15days on market $160,000 Active 16 DOM
-
2026-06-13days on market $160,000 Active 14 DOM
-
2026-06-09days on market $160,000 Active 10 DOM
-
2026-06-08days on market $160,000 Active 9 DOM
-
2026-06-07days on market $160,000 Active 8 DOM
-
2026-06-04days on market $160,000 Active 5 DOM
-
2026-06-03days on market $160,000 Active 4 DOM
-
2026-06-02days on market $160,000 Active 3 DOM
-
2026-06-01days on market $160,000 Active 2 DOM
-
2026-05-31remarks 699-char remark
-
2026-05-31$160,000 Active 1 DOM
ⓘ Source: listings_history table (triggers on properties + properties_extension) + one-shot
backfill from property_details.listing_events for pre-trigger history.
Tax reassessment forecast TX · Resets to sale price
- Current annual tax
- $5,481 · $457/mo
- Projected year-2 tax
- $5,481 · $457/mo
- Expected delta
- $0/yr ($0/mo · 0.0%)
ⓘ Screening estimate from a state-policy table — verify with the county assessor before closing.
Climate risk First Street
- Flood 1/10 Low FEMA zone X (unshaded) · 0% chance over 30 yrs
- Wildfire 3/10 Moderate
- Heat 7/10 Severe 7 d/yr ≥109°F today · 25 d/yr by 30 yrs out
- Wind 6/10 Major 27% chance of damaging wind over 30 yrs
- Air quality 2/10 Low 1 unhealthy d/yr today · 2 by 30 yrs out
Nearby sold comps map
Loading sold comps map…
Walkable amenities ~0.75 mi
Loading nearby amenities…
Taxation est. · year 1
- Rental income
- $20,757
- − Mortgage interest
- −$8,962
- − Property taxes
- −$5,481
- − Insurance
- −$800
- − Repairs & maintenance
- −$1,661
- − Management
- −$1,661
- − Depreciation
- −$4,655
- Taxable loss
- −$2,462
- Est. tax savings @ 24.0%
- +$591
- After-tax cash flow
- $639/yr
For passive investors: Depreciation is non-cash, so a rental often shows a tax loss while cash-flowing — sheltering income. Rental losses are passive: they offset passive income freely, and up to $25,000/yr can offset ordinary (W-2) income if you actively participate and your MAGI is under $100k (phasing out to $0 by $150k); unused losses carry forward. On sale, claimed depreciation is recaptured at up to 25%, and gains may owe capital-gains tax (a 1031 exchange can defer both). Figures are a year-1 estimate at your 24.0% rate — not tax advice; consult a CPA.
Schools (NCES district)
- District
- Dallas ISD
- NCES district ID
- 4816230
- Math proficiency
- 31% ▼ -16.00%
- Reading proficiency
- 36% ▼ -4.00%
- Median HH income
- $42,881
- Composite
- 28.41/100
- National rank
- #6763
- State rank
- #559 of 826 in TX
Livability — Dallas
- Score
- 81/100
- State rank
- #24
- US rank
- #1380
Category grades
Schools grade is shown separately in the Schools card above.
Census & demographics
- Census place
- Dallas, TX
- County
- Dallas County · 2,612,404 people
- City population
- 1,168,437
- Metro
- Dallas-Fort Worth-Arlington, TX
- Population (ZIP)
- 55,894
- Household income
- $41,386
- Rent vs Own
- Severe rent burden
- 2465.0
Population outlook (Dallas County) Hauer SSP2
- Today (2025)
- 2,979,839 people
- By 2030
- 3,191,823 · +7.1%
- By 2040
- 3,619,611 · +21.5%
- By 2050
- 4,026,915 · +35.1%
- By 2075
- 4,957,073 · +66.4%
- By 2100
- 5,508,725 · +84.9%
Race, ethnicity, and origin ACS 2023
- Neighborhood character
- Majority Black (51%)
- Race & ethnicity
- Black 51% Hispanic / Latino 44% Two or more races 14% White 3%
- Hispanic origin (detail)
- Mexican 40%
- Common ancestry
- Hispanic 1%
- Foreign-born
- 17% · Canada
- Languages at home
- 62% English-only · Spanish 37%
Political lean MEDSL · Dallas
- 2024 margin
- Strong D (+22.2) · D 60.2% · R 38.0% · Other 1.8%
- 2008→2024 swing
- +6.9pp toward D · 2008: 15.3pp · 2024: 22.2pp
- All cycles
- 2024: D+22.2 2020: D+31.6 2016: D+26.2 2012: D+15.4 2008: D+15.3
Not yet ingested
- Civics
- —
Market trends
- HPI YoY
- ▼ -126.35%
- Current HPI
- 299.1825
- Rent YoY
- ▲ 4.20%
- Metro
- Dallas-Fort Worth-Arlington, TX
- State GDP YoY
- ▲ 3.95%
- F500 in state
- 110
Industry mix (Fortune 500 HQ in TX)
| Industry | F500 HQs | Revenue |
|---|---|---|
| Energy | 16 | $1,198B |
|
||
| Technology | 5 | $198B |
|
||
| Engineering / Construction | 4 | $72B |
|
||
| Energy Services | 3 | $60B |
|
||
| Utilities | 3 | $41B |
|
||
| Healthcare | 2 | $330B |
|
||
Price history
2 events — show timeline
- 2026-05-30 Listed $160,000 NTREIS
- 2019-10-09 Sold (Public Records) — Public Records
Property tax history
+14.9%/yrLatest (2025): $5,481 · +4.2% YoY. Source: county tax records.
Cash-flow waterfall
monthlySold comps — $/sqft
last 12 mo · ≤1 miLoading sold comps…