5875 Castle Lk · San Antonio, TX
Flood risk 1/10 · Minimal
- FEMA flood zone
- X (unshaded)
- Chance of flooding over 30 yrs
- 0.0%
- Est. flood insurance / yr
- $507 – $1,088
Fire risk 1/10 · Minimal
- Est. fire insurance / yr
- $1,222 – $2,270
Heat risk 8/10 · Major
- Hot days now (above 108°F)
- 7 days/yr
- Hot days in 30 yrs
- 22 days/yr
Wind risk 8/10 · Major
- Chance of severe wind over 30 yrs
- 80.0%
Air-quality risk 2/10 · Minimal
- Unhealthy air days now
- 0 days/yr
- Unhealthy air days in 30 yrs
- 1 days/yr
Risk factors via First Street. Map © Google.
Why this score? — see what drove the C- grade
The composite is a weighted blend of 9 inputs, each scored 0–100. Each bar is that input's sub-score; the figure is the points it added to the 100-point composite (weight × sub-score).
- Cash flow +15.8/30.0
- ARV discount +15.0/15.0
- 1% rule +6.1/10.0
- DSCR +4.9/10.0
- Livability +4.0/5.0
- Condition / age +2.5/5.0
- Schools +2.4/10.0
- Rent growth +1.1/5.0
- Appreciation +0.0/10.0
$149,000
🖨 Deal sheet 📄 Offer letter ✓ Due diligence
Listing remarks MLS
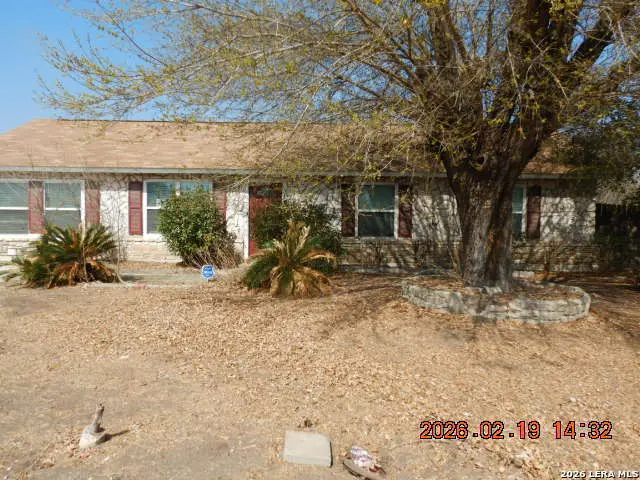
Upgraded home on nice corner lot featuring 3 bedrooms and 2 full baths. Converted garage lends itself to be a flexible room. Large backyard with oversized workshop. This home is ready for new occupants.
Key facts
- Flexible room
- Large backyard
- Oversized workshop
Tags
Neighborhood map
What this means for you Summary
Snapshot
- This is a 3-bed/1.5-bath single-family listed at $149k.
Deal economics
- At list price, monthly cash flow is $69 ($822/yr) — positive.
- The deal already cash-flows at list — no discount required.
- Meets the 1% rule at list price ($2k rent vs $149k).
- Recommended offer: $140k (6.0% below list) — sets the bar for market timing.
- Cap rate 6.8% vs local median 3.8% in San Antonio — top-decile yield for the area; either an underpriced asset or a hidden risk that comps aren't pricing in. Stress-test before assuming the spread holds.
Location & tenants
- Location reads 80/100 on livability (#31 in TX, #1,616 nationally) — a professional / high-income tenant draw. Strengths: amenities A+, commute A+, cost of living A+; Watch: schools C-, crime F.
- Judson ISD (suburban): math 21% / reading 33% proficiency, ranked #660 of 826 in TX (top 80%) — low school quality limits family demand, transient renter base, plan for 1-2y turnover.
- Market conditions: Rents falling (-5.6%/yr); 131 active listings in the ZIP; 40 comparable units currently listed for rent nearby; rentals at typical pace (median 24d on market — plan ~3-4 weeks tenant-placement turnaround); 8,308 units permitted in Bexar County in 2024 (2,506 in 5+ unit buildings).
- This rent runs 35% of the median local income ($57k/yr) — at the standard rent-burdened threshold; future hikes will face affordability resistance.
Forward outlook
- Local home prices are declining (-3.0%/yr); year-one equity from $1k of loan paydown is wiped out by about $4k of value loss. Plan a longer hold.
- Bexar County population projected at +50% by 2050 — long-run rental-demand tailwind backs the buy-and-hold thesis.
Negotiation context
- It's been on market 66 days — a 6% lower offer ($140k) is reasonable based on typical stale-listing flexibility.
- 2 sale attempts since 7y ago with the ask held roughly flat each time — persistent listings suggest the price (not the market) is what's stuck; bring a comps-based counter.
Risks & watch-outs
- Watch-outs: property tax is 3.1% of price.
- Climate carrying-cost: severe wind risk, 80% chance of damaging wind over 30y; extreme-heat days projected 7→22/yr by 2055 (HVAC capex compounding) — expect insurance premiums to compound above CPI over the hold.
Questions for the listing agent
- It's been on market 66 days. Have you received any prior offers? Is the seller open to a 6% concession, seller financing, or rate buy-down credit?
- Built in 1970 — when were the roof, HVAC, electrical panel, plumbing, and water heater last replaced?
- Property tax is high relative to price — has the assessment been appealed recently, and will the sale trigger a re-assessment?
- Why hasn't it sold? Are there any deal-killer items the seller is aware of (foundation, flood, title, zoning, code violations)?
- Is there a deadline driving the sale (1031 exchange, divorce, estate, relocation)? That informs how much negotiation room exists.
- Crime grade is F in this area — have there been break-ins, vandalism, or insurance claims at this property in the last 3 years? What carrier currently insures it and at what premium?
- What's the average days-on-market for RENTAL listings here right now (not sales)? A rising rental-DOM trend means longer vacancies and softer asking-rent achievability than the comps imply.
- What's the recent tenant-quality profile in this submarket — average credit score on applications, eviction rate, late-payment / NSF rate, and stable-employment percentage? A property-management company in the area should have these aggregated.
- How much new for-sale + rental construction is in the pipeline within 1–3 miles? Heavy new supply typically softens prices + rents 12–24 months out; constrained supply supports both.
Investment metrics
- 1% rule
- 1.11% ✓
- Cap rate
- 6.84%
- Cash-on-cash
- 1.97%
- DSCR
- 1.09
- GRM
- 7.5
CMA / ARV
- ARV (median comp)
- $189,076
- List price
- $149,000
- Delta
- -21.20%
- Verdict
- UNDERPRICED
- Comps
- 20 within 1.0 mi
Show comp detail 12 sales within ~0.75 mi
| Address | Dist | Beds/Ba | Sqft | Sold | Price | $/sf | Match |
|---|---|---|---|---|---|---|---|
| 4706 Castle Stream Dr | 0.41mi | 3/2.0 | 1,190 (-8%) | 2mo | $144,999 | $122 | 64 |
| 5882 Castle Run | 0.11mi | 3/2.0 | 1,476 (+14%) | 10mo | $259,900 | $176 | 62 |
| 6027 Bluestem Way | 0.53mi | 3/2.0 | 1,197 (-8%) | 0mo | $235,000 | $196 | 60 |
| 6826 Hibiscus Fls | 0.26mi | 3/2.0 | 1,445 (+12%) | 10mo | $220,000 | $152 | 58 |
| 4875 Castle Arms | 0.57mi | 3/2.0 | 1,238 (-4%) | 10mo | $184,999 | $149 | 56 |
| 4835 Castle Sword | 0.48mi | 3/2.0 | 1,200 (-7%) | 11mo | $185,000 | $154 | 54 |
| 5623 Midcrown | 0.58mi | 3/2.0 | 1,393 (+8%) | 7mo | $270,000 | $194 | 52 |
| 4819 Castle Lance | 0.64mi | 4/2.0 (+1) | 1,200 (-7%) | 2mo | $209,000 | $174 | 49 |
| 7231 Lavaca Blf | 0.71mi | 3/2.0 | 1,450 (+12%) | 0mo | $215,000 | $148 | 45 |
| 7115 Azalea Sq | 0.54mi | 3/2.0 | 1,454 (+12%) | 10mo | $240,000 | $165 | 44 |
| 7335 Bluebonnet Bay | 0.67mi | 3/2.0 | 1,414 (+9%) | 12mo | $235,000 | $166 | 42 |
| 5622 Raven | 0.70mi | 3/2.0 | 1,450 (+12%) | 6mo | $245,000 | $169 | 41 |
Match score weights: distance 35% · size 25% · config 20% · recency 20%. Top-matched comps best support the ARV.
Projected returns pro-forma
-3.0% appreciation · 0.0% rent growth · sell at horizon
- IRR
- -17.2%
- Equity multiple
- 0.41×
- Total profit
- $-24,463
- Equity at exit
- $22,216
- IRR
- -17.6%
- Equity multiple
- 0.19×
- Total profit
- $-33,748
- Equity at exit
- $12,883
Cash invested: $41,720 (down + closing). Projections, not guarantees.
Landlord ↔ Tenant lean methodology
- Overall (STATE)
- 87 Strongly Landlord-Friendly
- State Texas
- 87 Strongly Landlord-Friendly · R+5
- County
- — inherits STATE
- City
- — inherits STATE
ZIP-level market 78218
- Home prices YoY
- -16.1%
- Rents YoY
- -5.6%
- Active inventory
- 131
- Price-to-rent
- 7.5×
Monthly cashflow live
- Estimated rent
- $1,649 high interval (Pro) →
- Mortgage (P&I)
- −$781
- Tax from tax record
- −$391 /mo · $4,689/yr
- Insurance
- −$62
- HOA
- −$0
- Vacancy / Maint / Mgmt
- −$346
- Net cashflow
- $69
Break-even live
UW: 25.0% down · 7.5% · 30yr · 1.5% tax · 5.0% vac · 8.0% maint · 8.0% mgmt
Financing live
Cash to close
- Down payment
- $37,250
- Closing costs
- $4,470
- Reserves months
- —
- Total cash needed
- —
Loan-product check · same deal, 3 products live
Conventional
25% down · 7.5% · 30yr
- Down + closing
- —
- Monthly P&I
- —
- Monthly cashflow
- —
- DSCR
- —
- Eligible?
- —
Personal DTI + credit; lowest rate.
DSCR
20% down · 8.5% · 30yr
- Down + closing
- —
- Monthly P&I
- —
- Monthly cashflow
- —
- DSCR
- —
- Eligible?
- —
No personal income docs; deal must DSCR.
Hard money
10% down · 12.0% · 12mo
- Down + closing
- —
- Monthly P&I
- —
- Monthly cashflow
- —
- DSCR
- —
- Eligible?
- —
Short-term bridge; refi at stabilization.
Rent comps 40 comps
| Address | Beds | Baths | Sqft | Rent | $/sqft | DOM | Units | Dist |
|---|---|---|---|---|---|---|---|---|
| 5874 Castle Run San Antonio, TX | 4.0 | 2.0 | 1273 | $1,300 | $1.02 | 14d | 1 | 0.13mi |
| 6918 Pumpkin Cv San Antonio, TX | 3.0 | 2.0 | 1378 | $1,695 | $1.23 | 1d | 1 | 0.42mi |
| 6431 Nolina Pass San Antonio, TX | 3.0 | 2.0 | 1516 | $2,150 | $1.42 | 23d | 1 | 0.48mi |
| 6422 Hibiscus Fls San Antonio, TX | 3.0 | 2.0 | 1417 | $1,675 | $1.18 | 23d | 1 | 0.50mi |
| 4862 Castle Arms San Antonio, TX | 3.0 | 2.0 | 1350 | $1,295 | $0.96 | 43d | 1 | 0.52mi |
| 4903 Orchid Star San Antonio, TX | 3.0 | 2.0 | 1737 | $1,590 | $0.92 | 23d | 1 | 0.52mi |
| 4822 Orchid Star San Antonio, TX | 3.0 | 2.5 | 1450 | $1,435 | $0.99 | 23d | 1 | 0.54mi |
| 6026 Cielo Rnch San Antonio, TX | 3.0 | 2.0 | 1800 | $1,800 | $1.00 | 43d | 1 | 0.54mi |
| 6026 Bluestem Way San Antonio, TX | 3.0 | 2.0 | 1510 | $1,697 | $1.12 | 4d | 1 | 0.56mi |
| 6126 Plumbago Pl San Antonio, TX | 3.0 | 2.0 | 1436 | $1,595 | $1.11 | 43d | 1 | 0.58mi |
| 6231 Antares San Antonio, TX | 3.0 | 2.5 | 1822 | $1,750 | $0.96 | 16d | 1 | 0.59mi |
| 4843 Castle Shield San Antonio, TX | 3.0 | 1.0 | 1032 | $1,350 | $1.31 | 23d | 1 | 0.61mi |
| 4807 Heather Pass San Antonio, TX | 3.0 | 2.5 | 1554 | $1,475 | $0.95 | 23d | 1 | 0.62mi |
| 4807 Heather Pass San Antonio, TX | 3.0 | 2.5 | 1554 | $1,475 | $0.95 | 10d | 1 | 0.62mi |
| 4863 Castle Shield San Antonio, TX | 3.0 | 1.0 | 1472 | $1,400 | $0.95 | 4d | 1 | 0.63mi |
| 7238 Azalea Sq San Antonio, TX | 3.0 | 2.5 | 1547 | $1,550 | $1.00 | 4d | 1 | 0.65mi |
| 7238 Azalea Sq San Antonio, TX | 3.0 | 3.0 | 1547 | $1,650 | $1.07 | 43d | 1 | 0.65mi |
| 5911 Rolling Gln San Antonio, TX | 3.0 | 2.0 | 1512 | $1,600 | $1.06 | 23d | 1 | 0.66mi |
| 6222 Fieldrun San Antonio, TX | 3.0 | 2.5 | 1831 | $2,000 | $1.09 | 23d | 1 | 0.67mi |
| 7214 Lavaca Blf San Antonio, TX | 4.0 | 2.0 | 1631 | $1,800 | $1.10 | 43d | 1 | 0.69mi |
| 7231 Lavaca Blf San Antonio, TX | 3.0 | 2.0 | 1450 | $1,550 | $1.07 | 7d | 1 | 0.71mi |
| 7238 Rosada Way San Antonio, TX | 3.0 | 2.0 | 1276 | $1,650 | $1.29 | 43d | 1 | 0.73mi |
| 7527 Spanish Dagger San Antonio, TX | 3.0 | 2.0 | 1407 | $1,700 | $1.21 | 43d | 1 | 0.76mi |
| 7507 Whispine San Antonio, TX | 4.0 | 2.5 | 1847 | $1,900 | $1.03 | 23d | 1 | 0.76mi |
| 7350 Rosada Way San Antonio, TX | 4.0 | 2.5 | 1681 | $1,750 | $1.04 | 13d | 1 | 0.77mi |
| 5918 Poesta San Antonio, TX | 3.0 | 2.0 | 1307 | $1,650 | $1.26 | 43d | 1 | 0.77mi |
| 7539 Spanish Dagger San Antonio, TX | 3.0 | 2.5 | 1645 | $1,830 | $1.11 | 23d | 1 | 0.78mi |
| 7523 Whispine San Antonio, TX | 3.0 | 2.0 | 1307 | $1,720 | $1.32 | 23d | 1 | 0.79mi |
| 7607 Millchase San Antonio, TX | 3.0 | 2.0 | 1407 | $1,700 | $1.21 | 17d | 1 | 0.81mi |
| 5811 Camier Cv San Antonio, TX | 3.0 | 2.5 | 1645 | $1,830 | $1.11 | 23d | 1 | 0.81mi |
| 5414 Stoneshire San Antonio, TX | 3.0 | 2.0 | 1469 | $2,000 | $1.36 | 10d | 1 | 0.81mi |
| 5827 Camier Cv San Antonio, TX | 3.0 | 2.0 | 1307 | $1,650 | $1.26 | 23d | 1 | 0.82mi |
| 7615 Millchase San Antonio, TX | 4.0 | 2.5 | 1847 | $1,900 | $1.03 | 10d | 1 | 0.82mi |
| 6903 Cozy Run San Antonio, TX | 3.0 | 2.0 | 1243 | $1,550 | $1.25 | 14d | 1 | 0.83mi |
| 5903 Camier Cv San Antonio, TX | 3.0 | 2.0 | 1307 | $1,695 | $1.30 | 4d | 1 | 0.83mi |
| 5907 Camier Cv San Antonio, TX | 4.0 | 2.5 | 1847 | $1,900 | $1.03 | 43d | 1 | 0.84mi |
| 5915 Camier Cv San Antonio, TX | 3.0 | 2.0 | 1307 | $1,720 | $1.32 | 10d | 1 | 0.84mi |
| 6003 Camier Cv San Antonio, TX | 3.0 | 2.0 | 1307 | $1,650 | $1.26 | 17d | 1 | 0.87mi |
| 5414 Midcrown Dr Unit 710 San Antonio, TX | 2.0 | 2.0 | 998 | $1,039 | $1.04 | 2d | 1 | 0.88mi |
| 6023 Camier Cv San Antonio, TX | 3.0 | 2.0 | 1407 | $1,745 | $1.24 | 23d | 1 | 0.89mi |
Listing history 20 events
-
2026-06-18days on market $149,000 Active 66 DOM
-
2026-06-17days on market $149,000 Active 65 DOM
-
2026-06-16days on market $149,000 Active 64 DOM
-
2026-06-15days on market $149,000 Active 63 DOM
-
2026-06-13days on market $149,000 Active 61 DOM
-
2026-06-09statusdays on market $149,000 Active 57 DOM
-
2026-06-08days on market $149,000 Back on Market 56 DOM
-
2026-06-07days on market $149,000 Back on Market 55 DOM
-
2026-06-04days on market $149,000 Back on Market 52 DOM
-
2026-06-03days on market $149,000 Back on Market 51 DOM
-
2026-06-02days on market $149,000 Back on Market 50 DOM
-
2026-06-01days on market $149,000 Back on Market 49 DOM
-
2026-05-31days on market $149,000 Back on Market 48 DOM
-
2026-05-11historical Active Option 202-char remark
Show marketing remark (202 chars)
Upgraded home on nice corner lot featuring 3 bedrooms and 2 full baths. Converted garage lends itself to be a flexible room. Large backyard with oversized workshop. This home is ready for new occupants.
-
2026-04-13$149,000 New 202-char remark
Show marketing remark (202 chars)
Upgraded home on nice corner lot featuring 3 bedrooms and 2 full baths. Converted garage lends itself to be a flexible room. Large backyard with oversized workshop. This home is ready for new occupants.
-
2019-07-08soldstatus
-
2019-07-03soldstatus Sold 300-char remark
Show marketing remark (300 chars)
Lovely Fully renovated home on corner lot...Updates include Kitchen, baths, flooring, electrical, paint, siding and roof (decking/rafters)..Large patio, Large workshop in back yard for projects ...enclosed garage can be second living, office or bedroom (no closet)..close to HWY 35 and Ft Sam Houston
-
2019-06-18status Pending 300-char remark
Show marketing remark (300 chars)
Lovely Fully renovated home on corner lot...Updates include Kitchen, baths, flooring, electrical, paint, siding and roof (decking/rafters)..Large patio, Large workshop in back yard for projects ...enclosed garage can be second living, office or bedroom (no closet)..close to HWY 35 and Ft Sam Houston
-
2019-05-23historical Active Option 300-char remark
Show marketing remark (300 chars)
Lovely Fully renovated home on corner lot...Updates include Kitchen, baths, flooring, electrical, paint, siding and roof (decking/rafters)..Large patio, Large workshop in back yard for projects ...enclosed garage can be second living, office or bedroom (no closet)..close to HWY 35 and Ft Sam Houston
-
2019-05-20$159,999 New 300-char remark
Show marketing remark (300 chars)
Lovely Fully renovated home on corner lot...Updates include Kitchen, baths, flooring, electrical, paint, siding and roof (decking/rafters)..Large patio, Large workshop in back yard for projects ...enclosed garage can be second living, office or bedroom (no closet)..close to HWY 35 and Ft Sam Houston
ⓘ Source: listings_history table (triggers on properties + properties_extension) + one-shot
backfill from property_details.listing_events for pre-trigger history.
Tax reassessment forecast TX · Resets to sale price
- Current annual tax
- $4,689 · $391/mo
- Projected year-2 tax
- $4,689 · $391/mo
- Expected delta
- $0/yr ($0/mo · 0.0%)
ⓘ Screening estimate from a state-policy table — verify with the county assessor before closing.
Climate risk First Street
- Flood 1/10 Low FEMA zone X (unshaded) · 0% chance over 30 yrs
- Wildfire 1/10 Low
- Heat 8/10 Severe 7 d/yr ≥108°F today · 22 d/yr by 30 yrs out
- Wind 8/10 Severe 80% chance of damaging wind over 30 yrs
- Air quality 2/10 Low 0 unhealthy d/yr today · 1 by 30 yrs out
Nearby sold comps map
Loading sold comps map…
Walkable amenities ~0.75 mi
Loading nearby amenities…
Taxation est. · year 1
- Rental income
- $19,788
- − Mortgage interest
- −$8,346
- − Property taxes
- −$4,689
- − Insurance
- −$745
- − Repairs & maintenance
- −$1,583
- − Management
- −$1,583
- − Depreciation
- −$4,335
- Taxable loss
- −$1,493
- Est. tax savings @ 24.0%
- +$358
- After-tax cash flow
- $1,180/yr
For passive investors: Depreciation is non-cash, so a rental often shows a tax loss while cash-flowing — sheltering income. Rental losses are passive: they offset passive income freely, and up to $25,000/yr can offset ordinary (W-2) income if you actively participate and your MAGI is under $100k (phasing out to $0 by $150k); unused losses carry forward. On sale, claimed depreciation is recaptured at up to 25%, and gains may owe capital-gains tax (a 1031 exchange can defer both). Figures are a year-1 estimate at your 24.0% rate — not tax advice; consult a CPA.
Schools (NCES district)
- District
- Judson ISD
- NCES district ID
- 4824990
- Math proficiency
- 21% ▼ -21.00%
- Reading proficiency
- 33% ▼ -7.00%
- Median HH income
- $57,542
- Composite
- 24.39/100
- National rank
- #7689
- State rank
- #660 of 826 in TX
Livability — San Antonio
- Score
- 80/100
- State rank
- #31
- US rank
- #1616
Category grades
Schools grade is shown separately in the Schools card above.
Census & demographics
- Census place
- San Antonio, TX
- County
- Bexar County · 1,990,555 people
- City population
- 1,806,925
- Metro
- San Antonio-New Braunfels, TX
- Population (ZIP)
- 39,428
- Household income
- $57,285
- Rent vs Own
- Severe rent burden
- 2508.0
Population outlook (Bexar County) Hauer SSP2
- Today (2025)
- 2,336,851 people
- By 2030
- 2,560,728 · +9.6%
- By 2040
- 3,020,569 · +29.3%
- By 2050
- 3,493,522 · +49.5%
- By 2075
- 4,668,459 · +99.8%
- By 2100
- 5,533,242 · +136.8%
Race, ethnicity, and origin ACS 2023
- Neighborhood character
- Diverse neighborhood (Simpson 0.64)
- Race & ethnicity
- Hispanic / Latino 53% Two or more races 26% White 25% Black 14% Asian 3% Native American 2%
- Hispanic origin (detail)
- Mexican 41% Puerto Rican 3%
- Common ancestry
- Serbian 2% Italian 1% Romanian 1%
- Foreign-born
- 18% · Canada, Vietnam, China
- Languages at home
- 60% English-only · Spanish 34% Vietnamese 1% Other Asian/Pacific 1%
Political lean MEDSL · Bexar
- 2024 margin
- Lean D (+9.8) · D 54.3% · R 44.6% · Other 1.1%
- 2008→2024 swing
- +4.2pp toward D · 2008: 5.6pp · 2024: 9.8pp
- All cycles
- 2024: D+9.8 2020: D+18.2 2016: D+13.5 2012: D+4.6 2008: D+5.6
Not yet ingested
- Civics
- —
Market trends
- HPI YoY
- ▼ -52.17%
- Current HPI
- 271.2807
- Rent YoY
- ▼ -5.56%
- Metro
- San Antonio-New Braunfels, TX
- State GDP YoY
- ▲ 3.95%
- F500 in state
- 110
Industry mix (Fortune 500 HQ in TX)
| Industry | F500 HQs | Revenue |
|---|---|---|
| Energy | 16 | $1,198B |
|
||
| Technology | 5 | $198B |
|
||
| Engineering / Construction | 4 | $72B |
|
||
| Energy Services | 3 | $60B |
|
||
| Utilities | 3 | $41B |
|
||
| Healthcare | 2 | $330B |
|
||
Price history
-6.9% since first listed7 events — show timeline
- 2026-05-11 Contingent — LERA
- 2026-04-13 Listed $149,000 LERA
- 2019-07-08 Sold (Public Records) — Public Records
- 2019-07-03 Sold (MLS) — LERA
- 2019-06-18 Pending — LERA
- 2019-05-23 Contingent — LERA
- 2019-05-20 Listed $159,999 LERA
Property tax history
+14.3%/yrLatest (2025): $4,689 · +1.5% YoY. Source: county tax records.
Cash-flow waterfall
monthlySold comps — $/sqft
last 12 mo · ≤1 miLoading sold comps…