2302 Maki Rd #25 · Plant City, FL
Flood risk 1/10 · Minimal
- FEMA flood zone
- X (unshaded)
- Chance of flooding over 30 yrs
- 0.0%
- Est. flood insurance / yr
- $507 – $1,088
Fire risk 3/10 · Minor
- Est. fire insurance / yr
- $947 – $1,759
Heat risk 9/10 · Severe
- Hot days now (above 108°F)
- 7 days/yr
- Hot days in 30 yrs
- 26 days/yr
Wind risk 9/10 · Severe
- Chance of severe wind over 30 yrs
- 99.0%
Air-quality risk 3/10 · Minor
- Unhealthy air days now
- 2 days/yr
- Unhealthy air days in 30 yrs
- 3 days/yr
Risk factors via First Street. Map © Google.
Why this score? — see what drove the C grade
The composite is a weighted blend of 9 inputs, each scored 0–100. Each bar is that input's sub-score; the figure is the points it added to the 100-point composite (weight × sub-score).
- Cash flow +23.3/30.0
- 1% rule +8.6/10.0
- DSCR +7.5/10.0
- ARV discount +7.5/15.0
- Schools +4.2/10.0
- Livability +3.8/5.0
- Condition / age +2.5/5.0
- Rent growth +2.4/5.0
- Appreciation +0.0/10.0
$119,900
🖨 Deal sheet 📄 Offer letter ✓ Due diligence
Listing remarks
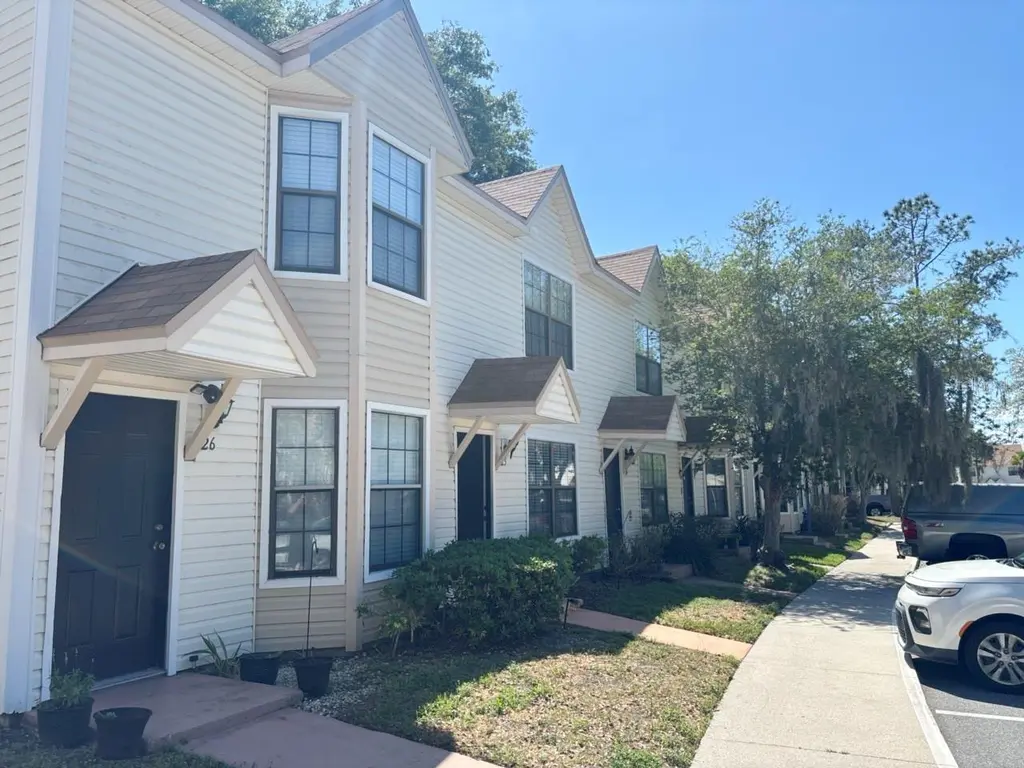
Welcome to this charming 2-bedroom, 1.5-bath townhome in the desirable Kentwood Park community of Plant City. Featuring a bright, open floorplan, the spacious first level offers a comfortable living area, convenient half bath, and a well-appointed kitchen with sleek white appliances—perfect for everyday living and entertaining. Upstairs, you’ll find two generously sized bedrooms along with a full bath complete with a large vanity and relaxing bathtub. Enjoy Florida living with access to the community pool and clubhouse, all included in the low HOA fee. Ideally located near shopping, dining, and local amenities, with easy access to Interstate 4, this home provides a seamless comm
Key facts
- Clubhouse
- Community pool
- $211 HOA
Tags
Property features AI
Finance
- Other: Taxes listed (not included per instructions)
- Financial info: Total annual fees $2,538; Lease restrictions apply
- HOA & community: Monthly HOA $211.50 (includes pool, grounds maintenance, trash); HOA approval required; Association: Ameri-Tech Community Management Ronny Dunner; Community features: Deed restrictions, pool, sidewalks; Pets allowed (max weight 25 lbs)
Exterior
- Utilities: Public water; Public sewer; Cable available; Sewer connected
- Home design: Condominium; Residential property; Two-level building; Faces east; First-floor unit
- Construction: Vinyl siding and frame construction; Shingle roof; Slab foundation; Built as part of a multi-unit building (building number 25)
- Exterior features: Sidewalk
Interior
- Kitchen: Dishwasher; Range; Range hood; Refrigerator
- Bedrooms: 2 bedrooms
- Flooring: Carpet; Ceramic tile
- Bathrooms: 1 full bath; 1 half bath
- Heating & cooling: Central heating; Central air conditioning
- Interior features: Ceiling fans; Living room/dining room combo; Solid surface counters
- Laundry & utility: Laundry closet
Neighborhood map
What this means for you Summary
Snapshot
- This is a 2-bed/2.0-bath condo listed at $120k.
Deal economics
- At list price, monthly cash flow is $220 ($3k/yr) — positive.
- The deal already cash-flows at list — no discount required.
- Meets the 1% rule at list price ($2k rent vs $120k).
- Recommended offer: $116k (3.0% below list) — sets the bar for market timing.
Location & tenants
- Location reads 76/100 on livability (#227 in FL, #3,587 nationally) — a middle-class / working-renter tenant base. Strengths: amenities A+, cost of living A+, housing A+; Watch: employment C-, schools D+, commute F.
- Hillsborough (suburban): math 47% / reading 50% proficiency, ranked #41 of 73 in FL (top 56%) — families likely to look elsewhere, expect single-tenant / working-renter base with shorter leases.
- Market conditions: Rents soft (-0.6%/yr); 181 active listings in the ZIP; 12 comparable units currently listed for rent nearby; rentals at typical pace (median 25d on market — plan ~3-4 weeks tenant-placement turnaround); 9,053 units permitted in Hillsborough County in 2024 (4,555 in 5+ unit buildings).
- This rent runs 32% of the median local income ($60k/yr) — at the standard rent-burdened threshold; future hikes will face affordability resistance.
Forward outlook
- Local home prices are declining (-3.0%/yr); year-one equity from $829 of loan paydown is wiped out by about $4k of value loss. Plan a longer hold.
- Hillsborough County population projected at +37% by 2050 — long-run rental-demand tailwind backs the buy-and-hold thesis.
Negotiation context
- It's been on market 56 days — a 3% lower offer ($116k) is reasonable based on typical stale-listing flexibility.
- 4 sale attempts since 14y ago; this cycle's ask has dropped $20k (14%) from the opening price — seller is motivated, your offer sets the floor, not the list.
- Current owner paid $40k; list at $120k implies a 201% gain — meaningful room to come down on a strong offer.
Risks & watch-outs
- Climate carrying-cost: severe wind risk, 99% chance of damaging wind over 30y; extreme-heat days projected 7→26/yr by 2055 (HVAC capex compounding) — expect insurance premiums to compound above CPI over the hold.
Questions for the listing agent
- It's been on market 56 days. Have you received any prior offers? Is the seller open to a 3% concession, seller financing, or rate buy-down credit?
- What does the HOA fee cover, when was the last increase, and are there any pending special assessments or reserve-fund shortfalls?
- Any open or pending special assessments — roof, HVAC, plumbing, elevator, façade? What's the per-unit balance and payoff schedule, and is the seller paying it off at close or rolling it to the buyer?
- Is there a deadline driving the sale (1031 exchange, divorce, estate, relocation)? That informs how much negotiation room exists.
- Schools are D-rated, which usually means shorter tenancies and higher turnover. Who's the typical renter profile here, and what's been the actual vacancy rate?
- What's the average days-on-market for RENTAL listings here right now (not sales)? A rising rental-DOM trend means longer vacancies and softer asking-rent achievability than the comps imply.
- What's the recent tenant-quality profile in this submarket — average credit score on applications, eviction rate, late-payment / NSF rate, and stable-employment percentage? A property-management company in the area should have these aggregated.
- How much new apartment / multifamily construction is in the pipeline within 1–3 miles? Heavy new supply (>2% of stock underway) typically softens rents 12–24 months out; light construction supports rent growth.
Investment metrics
- 1% rule
- 1.36% ✓
- Cap rate
- 8.49%
- Cash-on-cash
- 7.85%
- DSCR
- 1.35
- GRM
- 6.1
CMA / ARV
No comps found within radius.
Projected returns pro-forma
-3.0% appreciation · 0.0% rent growth · sell at horizon
- IRR
- -8.4%
- Equity multiple
- 0.70×
- Total profit
- $-10,038
- Equity at exit
- $17,877
- IRR
- -4.6%
- Equity multiple
- 0.75×
- Total profit
- $-8,471
- Equity at exit
- $10,367
Cash invested: $33,572 (down + closing). Projections, not guarantees.
Landlord ↔ Tenant lean methodology
- Overall (STATE)
- 87 Strongly Landlord-Friendly
- State Florida
- 87 Strongly Landlord-Friendly · R+3
- County
- — inherits STATE
- City
- — inherits STATE
ZIP-level market 33563
- Home prices YoY
- -23.2%
- Rents YoY
- -0.6%
- Active inventory
- 181
- Price-to-rent
- 6.1×
Monthly cashflow live
- Estimated rent
- $1,628 high interval (Pro) →
- Mortgage (P&I)
- −$629
- Tax from tax record
- −$177 /mo · $2,123/yr
- Insurance
- −$50
- HOA
- −$211
- Vacancy / Maint / Mgmt
- −$342
- Net cashflow
- $220
Break-even live
UW: 25.0% down · 7.5% · 30yr · 1.5% tax · 5.0% vac · 8.0% maint · 8.0% mgmt
Financing live
Cash to close
- Down payment
- $29,975
- Closing costs
- $3,597
- Reserves months
- —
- Total cash needed
- —
Loan-product check · same deal, 3 products live
Conventional
25% down · 7.5% · 30yr
- Down + closing
- —
- Monthly P&I
- —
- Monthly cashflow
- —
- DSCR
- —
- Eligible?
- —
Personal DTI + credit; lowest rate.
DSCR
20% down · 8.5% · 30yr
- Down + closing
- —
- Monthly P&I
- —
- Monthly cashflow
- —
- DSCR
- —
- Eligible?
- —
No personal income docs; deal must DSCR.
Hard money
10% down · 12.0% · 12mo
- Down + closing
- —
- Monthly P&I
- —
- Monthly cashflow
- —
- DSCR
- —
- Eligible?
- —
Short-term bridge; refi at stabilization.
Rent comps 12 comps
| Address | Beds | Baths | Sqft | Rent | $/sqft | DOM | Units | Dist |
|---|---|---|---|---|---|---|---|---|
| 2302 Maki Rd Plant City, FL | 2.0 | 1.5–2.0 | 1123 | $1,522 | $1.36 | 24d | 3 | 0.13mi |
| 2302 Maki Rd Plant City, FL | 2.0 | 1.5 | 908 | $1,550 | $1.71 | 16d | 2 | 0.13mi |
| 1001 Fairwinds Cir Plant City, FL | 1.0–3.0 | 1.0–2.0 | 943 | $1,690 | $1.79 | 24d | 11 | 0.56mi |
| 1017 Damascus Rd Plant City, FL | 3.0 | 2.0 | 846 | $1,750 | $2.07 | 24d | 1 | 0.60mi |
| 305 W Grant St Plant City, FL | 2.0–3.0 | 2.0 | 973 | $1,450 | $1.49 | 5d | 2 | 0.83mi |
| 501 W Ball St Unit Hun303 Plant City, FL | 1.0 | 1.0 | 614 | $1,399 | $2.28 | 24d | 1 | 1.21mi |
| 501 W Ball St Unit Bal12135 Plant City, FL | 2.0 | 1.0 | 624 | $1,499 | $2.40 | 24d | 1 | 1.21mi |
| 501 W Ball St Unit War814 Plant City, FL | 2.0 | 1.0 | 614 | $1,499 | $2.44 | 11d | 1 | 1.21mi |
| 501 W Ball St Unit 609-02 Plant City, FL | 2.0 | 1.0 | 780 | $1,499 | $1.92 | 3d | 1 | 1.21mi |
| 501 W Ball St Unit 705-13 Plant City, FL | 2.0 | 1.0 | 780 | $1,499 | $1.92 | 22d | 1 | 1.21mi |
| 3202 Elsanta St Plant City, FL | 1.0–2.0 | 1.0–2.0 | 912 | $2,020 | $2.21 | 1d | 36 | 1.35mi |
| 809 1/2 W Warren St Plant City, FL | 3.0 | 2.0 | 947 | $1,650 | $1.74 | 24d | 1 | 1.42mi |
HOA detail condo
- Monthly dues
- $211 · $2,532/yr
- Likely covers
- pool
- Assessments
- None detected in remarks — confirm with the listing agent.
Listing history 25 events
-
2026-06-19price $119,900 Active 56 DOM
-
2026-06-18days on market $129,900 Active 56 DOM
-
2026-06-17days on market $129,900 Active 55 DOM
-
2026-06-16days on market $129,900 Active 54 DOM
-
2026-06-15days on market $129,900 Active 53 DOM
-
2026-06-13days on market $129,900 Active 51 DOM
-
2026-06-13days on market $129,900 Active 50 DOM
-
2026-06-09days on market $129,900 Active 47 DOM
-
2026-06-08days on market $129,900 Active 46 DOM
-
2026-06-07days on market $129,900 Active 45 DOM
-
2026-06-04days on market $129,900 Active 42 DOM
-
2026-06-03days on market $129,900 Active 41 DOM
-
2026-06-02days on market $129,900 Active 40 DOM
-
2026-06-01days on market $129,900 Active 39 DOM
-
2026-05-31days on market $129,900 Active 38 DOM
-
2026-04-23$139,900 Active 802-char remark
-
2025-05-05historical
-
2025-03-05$165,000 Active
-
2024-02-20price $154,947
-
2024-02-10price $151,547
-
2024-02-02price $152,547
-
2024-01-16$158,947 Active
-
2012-06-12soldstatus $39,900
-
2012-06-07soldstatus $39,900
-
2012-02-23$39,900
ⓘ Source: listings_history table (triggers on properties + properties_extension) + one-shot
backfill from property_details.listing_events for pre-trigger history.
Tax reassessment forecast FL · Resets to sale price
- Current annual tax
- $2,123 · $177/mo
- Projected year-2 tax
- $2,123 · $177/mo
- Expected delta
- $0/yr ($0/mo · 0.0%)
ⓘ Screening estimate from a state-policy table — verify with the county assessor before closing.
Climate risk First Street
- Flood 1/10 Low FEMA zone X (unshaded) · 0% chance over 30 yrs
- Wildfire 3/10 Moderate
- Heat 9/10 Extreme 7 d/yr ≥108°F today · 26 d/yr by 30 yrs out
- Wind 9/10 Extreme 99% chance of damaging wind over 30 yrs
- Air quality 3/10 Moderate 2 unhealthy d/yr today · 3 by 30 yrs out
Nearby sold comps map
Loading sold comps map…
Walkable amenities ~0.75 mi
Loading nearby amenities…
Taxation est. · year 1
- Rental income
- $19,539
- − Mortgage interest
- −$6,716
- − Property taxes
- −$2,123
- − Insurance
- −$600
- − Repairs & maintenance
- −$1,563
- − Management
- −$1,563
- − HOA
- −$2,532
- − Depreciation
- −$3,488
- Taxable income
- $954
- Est. tax owed @ 24.0%
- −$229
- After-tax cash flow
- $2,407/yr
For passive investors: Depreciation is non-cash, so a rental often shows a tax loss while cash-flowing — sheltering income. Rental losses are passive: they offset passive income freely, and up to $25,000/yr can offset ordinary (W-2) income if you actively participate and your MAGI is under $100k (phasing out to $0 by $150k); unused losses carry forward. On sale, claimed depreciation is recaptured at up to 25%, and gains may owe capital-gains tax (a 1031 exchange can defer both). Figures are a year-1 estimate at your 24.0% rate — not tax advice; consult a CPA.
Schools (NCES district)
- District
- Hillsborough
- NCES district ID
- 1200870
- Math proficiency
- 47% ▼ -8.00%
- Reading proficiency
- 50% ▼ -4.00%
- Median HH income
- $50,622
- Composite
- 41.6/100
- National rank
- #3435
- State rank
- #41 of 73 in FL
Livability — Plant City
- Score
- 76/100
- State rank
- #227
- US rank
- #3587
Category grades
Schools grade is shown separately in the Schools card above.
Census & demographics
- Census place
- Plant City, FL
- County
- Hillsborough County · 1,540,968 people
- City population
- 68,525
- Metro
- Tampa-St. Petersburg-Clearwater, FL
- Population (ZIP)
- 25,896
- Household income
- $60,131
- Rent vs Own
- Severe rent burden
- 932.0
Population outlook (Hillsborough County) Hauer SSP2
- Today (2025)
- 1,607,022 people
- By 2030
- 1,733,968 · +7.9%
- By 2040
- 1,979,565 · +23.2%
- By 2050
- 2,203,427 · +37.1%
- By 2075
- 2,667,893 · +66.0%
- By 2100
- 2,891,558 · +79.9%
Race, ethnicity, and origin ACS 2023
- Neighborhood character
- Diverse neighborhood (Simpson 0.64)
- Race & ethnicity
- White 43% Hispanic / Latino 39% Black 15% Two or more races 15% Native American 2%
- Hispanic origin (detail)
- Mexican 24% Puerto Rican 5% Cuban 1%
- Common ancestry
- Lithuanian 2% Italian 1% Slovak 1%
- Foreign-born
- 16% · Canada, Jamaica
- Languages at home
- 66% English-only · Spanish 34%
Political lean MEDSL · Hillsborough
- 2024 margin
- Toss-up / Even · D 47.8% · R 50.9% · Other 1.3%
- 2008→2024 swing
- -10.2pp toward R · 2008: 7.1pp · 2024: -3.1pp
- All cycles
- 2024: R+3.1 2020: D+6.9 2016: D+6.8 2012: D+6.7 2008: D+7.1
Not yet ingested
- Civics
- —
Market trends
- HPI YoY
- ▼ -103.29%
- Current HPI
- 342.5789
- Rent YoY
- ▼ -0.57%
- Metro
- Tampa-St. Petersburg-Clearwater, FL
- State GDP YoY
- ▲ 3.28%
- F500 in state
- 36
Industry mix (Fortune 500 HQ in FL)
| Industry | F500 HQs | Revenue |
|---|---|---|
| Industrial Technology | 2 | $29B |
|
||
| Insurance | 2 | $17B |
|
||
| Retail | 1 | $60B |
|
||
| Technology Distribution | 1 | $58B |
|
||
| Homebuilding | 1 | $35B |
|
||
| Technology Manufacturing | 1 | $35B |
|
||
Price history
+200.5% since first listed12 events — show timeline
- 2026-06-18 Price Changed $119,900 Stellar MLS as Distributed by MLS Grid
- 2026-05-21 Price Changed $129,900 Stellar MLS as Distributed by MLS Grid
- 2026-04-23 Listed $139,900 Stellar MLS as Distributed by MLS Grid
- 2025-05-05 Listing Removed — Stellar MLS as Distributed by MLS Grid
- 2025-03-05 Listed $165,000 Stellar MLS as Distributed by MLS Grid
- 2024-02-20 Price Changed $154,947 Stellar MLS as Distributed by MLS Grid
- 2024-02-10 Price Changed $151,547 Stellar MLS as Distributed by MLS Grid
- 2024-02-02 Price Changed $152,547 Stellar MLS as Distributed by MLS Grid
- 2024-01-16 Listed $158,947 Stellar MLS as Distributed by MLS Grid
- 2012-06-12 Sold (Public Records) $39,900 Public Records
- 2012-06-07 Sold (MLS) $39,900 Stellar MLS as Distributed by MLS Grid
- 2012-02-23 Listed $39,900 Stellar MLS as Distributed by MLS Grid
Property tax history
+14.4%/yrLatest (2025): $2,123 · +2.2% YoY. Source: county tax records.
Cash-flow waterfall
monthlySold comps — $/sqft
last 12 mo · ≤1 miLoading sold comps…