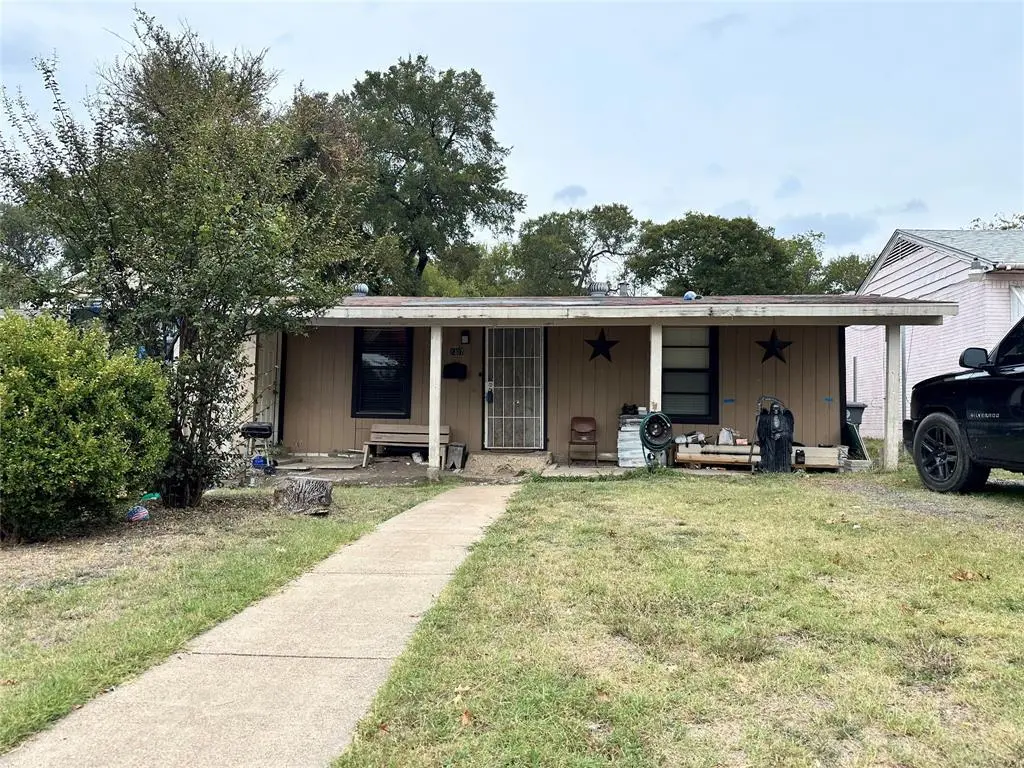
1307 Neptune Rd · Dallas, TX
Flood risk 1/10 · Minimal
- FEMA flood zone
- X (unshaded)
- Chance of flooding over 30 yrs
- 0.0%
- Est. flood insurance / yr
- $507 – $1,088
Fire risk 1/10 · Minimal
- Est. fire insurance / yr
- $1,222 – $2,270
Heat risk 7/10 · Major
- Hot days now (above 110°F)
- 7 days/yr
- Hot days in 30 yrs
- 24 days/yr
Wind risk 6/10 · Moderate
- Chance of severe wind over 30 yrs
- 27.0%
Air-quality risk 2/10 · Minimal
- Unhealthy air days now
- 1 days/yr
- Unhealthy air days in 30 yrs
- 2 days/yr
Risk factors via First Street. Map © Google.
Why this score? — see what drove the B- grade
The composite is a weighted blend of 9 inputs, each scored 0–100. Each bar is that input's sub-score; the figure is the points it added to the 100-point composite (weight × sub-score).
- Cash flow +24.0/30.0
- ARV discount +15.0/15.0
- DSCR +7.7/10.0
- 1% rule +7.3/10.0
- Livability +4.0/5.0
- Rent growth +3.6/5.0
- Schools +2.8/10.0
- Condition / age +2.5/5.0
- Appreciation +0.0/10.0
$140,000
🖨 Deal sheet 📄 Offer letter ✓ Due diligence
Listing remarks MLS
Take a look at this less than $200k single-family home with a huge back yard for your family and friend's reunion. AC unit and furnace replaced around 07-2025 and water heater 03-2025. Don't lose this opportunity.
Key facts
- Attached apartment
- Huge back yard
- Backyard apartment
Tags
Neighborhood map
What this means for you Summary
Snapshot
- This is a 2-bed/1.0-bath single-family listed at $140k.
Deal economics
- At list price, monthly cash flow is $274 ($3k/yr) — positive.
- The deal already cash-flows at list — no discount required.
- Meets the 1% rule at list price ($2k rent vs $140k).
- Recommended offer: $123k (12.0% below list) — sets the bar for market timing.
- Cap rate 8.6% vs local median 2.3% in Dallas — top-decile yield for the area; either an underpriced asset or a hidden risk that comps aren't pricing in. Stress-test before assuming the spread holds.
Location & tenants
- Location reads 81/100 on livability (#24 in TX, #1,380 nationally) — a professional / high-income tenant draw. Strengths: amenities A+, commute A+, housing A+; Watch: schools C-, crime F.
- Dallas ISD (urban): math 31% / reading 36% proficiency, ranked #559 of 826 in TX (top 68%) — families likely to look elsewhere, expect single-tenant / working-renter base with shorter leases; 83% free/reduced lunch — lower-income household profile, screen leases tightly.
- Market conditions: Rents rising fast (+4.2%/yr); 249 active listings in the ZIP; 10 comparable units currently listed for rent nearby; rentals at typical pace (median 25d on market — plan ~3-4 weeks tenant-placement turnaround); 40% of comp listings sitting > 30 days — soft ceiling on asking rent; lower-income renter base — watch delinquency; 12,577 units permitted in Dallas County in 2024 (6,829 in 5+ unit buildings).
- At $1,726/mo this rent would consume 50% of the median local household income ($41k/yr) (locally 2465% of renters already pay >50% of income on rent) — very limited rent-growth headroom before tenants either downsize or default.
Forward outlook
- Local home prices are declining (-3.0%/yr); year-one equity from $968 of loan paydown is wiped out by about $4k of value loss. Plan a longer hold.
- Dallas County population projected at +35% by 2050 — long-run rental-demand tailwind backs the buy-and-hold thesis.
- At projected returns (-3.0% appreciation + 4.2% rent growth), your $39k cash investment doubles in ~10 years — after that, you're playing with house money.
Negotiation context
- It's been on market 211 days — a 12% lower offer ($123k) is reasonable based on typical stale-listing flexibility.
Risks & watch-outs
- Watch-outs: property tax is 2.5% of price; built in 1952 — expect roof / HVAC / electrical / plumbing capex.
- Climate carrying-cost: major wind risk, 27% chance of damaging wind over 30y; extreme-heat days projected 7→24/yr by 2055 (HVAC capex compounding) — expect insurance premiums to compound above CPI over the hold.
Questions for the listing agent
- It's been on market 211 days. Have you received any prior offers? Is the seller open to a 12% concession, seller financing, or rate buy-down credit?
- Built in 1952 — when were the roof, HVAC, electrical panel, plumbing, and water heater last replaced?
- Property tax is high relative to price — has the assessment been appealed recently, and will the sale trigger a re-assessment?
- Why hasn't it sold? Are there any deal-killer items the seller is aware of (foundation, flood, title, zoning, code violations)?
- Is there a deadline driving the sale (1031 exchange, divorce, estate, relocation)? That informs how much negotiation room exists.
- Crime grade is F in this area — have there been break-ins, vandalism, or insurance claims at this property in the last 3 years? What carrier currently insures it and at what premium?
- What's the average days-on-market for RENTAL listings here right now (not sales)? A rising rental-DOM trend means longer vacancies and softer asking-rent achievability than the comps imply.
- What's the recent tenant-quality profile in this submarket — average credit score on applications, eviction rate, late-payment / NSF rate, and stable-employment percentage? A property-management company in the area should have these aggregated.
- How much new for-sale + rental construction is in the pipeline within 1–3 miles? Heavy new supply typically softens prices + rents 12–24 months out; constrained supply supports both.
Investment metrics
- 1% rule
- 1.23% ✓
- Cap rate
- 8.64%
- Cash-on-cash
- 8.39%
- DSCR
- 1.37
- GRM
- 6.8
CMA / ARV
- ARV (median comp)
- $195,819
- List price
- $140,000
- Delta
- -28.51%
- Verdict
- UNDERPRICED
- Comps
- 20 within 1.0 mi
Show comp detail 10 sales within ~0.75 mi
| Address | Dist | Beds/Ba | Sqft | Sold | Price | $/sf | Match |
|---|---|---|---|---|---|---|---|
| 1318 Waweenoc Ave | 0.16mi | 2/1.0 | 789 (-10%) | 8mo | $199,900 | $253 | 71 |
| 3512 S Ewing Ave | 0.71mi | 2/1.0 | 867 (-1%) | 1mo | $125,000 | $144 | 65 |
| 1823 Atlas Dr | 0.68mi | 2/1.0 | 868 (-0%) | 5mo | $90,000 | $104 | 64 |
| 1202 Waweenoc Ave | 0.13mi | 3/1.0 (+1) | 960 (+10%) | 11mo | $249,900 | $260 | 63 |
| 3603 Maryland Ave | 0.73mi | 2/1.0 | 861 (-1%) | 12mo | $189,000 | $220 | 54 |
| 4516 Idaho Ave | 0.34mi | 3/1.0 (+1) | 967 (+11%) | 10mo | $159,000 | $164 | 53 |
| 1519 Fordham Rd | 0.40mi | 3/2.0 (+1) | 847 (-3%) | 22mo | $199,900 | $236 | 49 |
| 4113 Idaho Ave | 0.35mi | 2/1.0 | 980 (+12%) | 21mo | $159,000 | $162 | 45 |
| 1326 Presidio Ave | 0.72mi | 3/2.0 (+1) | 924 (+6%) | 19mo | $237,000 | $256 | 31 |
| 1442 Hudspeth Ave | 0.63mi | 2/1.0 | 758 (-13%) | 22mo | $190,000 | $251 | 31 |
Match score weights: distance 35% · size 25% · config 20% · recency 20%. Top-matched comps best support the ARV.
Projected returns pro-forma
-3.0% appreciation · 4.2% rent growth · sell at horizon
- IRR
- -2.0%
- Equity multiple
- 0.92×
- Total profit
- $-3,026
- Equity at exit
- $20,874
- IRR
- 9.1%
- Equity multiple
- 1.74×
- Total profit
- $29,113
- Equity at exit
- $12,105
Cash invested: $39,200 (down + closing). Projections, not guarantees.
Landlord ↔ Tenant lean methodology
- Overall (STATE)
- 87 Strongly Landlord-Friendly
- State Texas
- 87 Strongly Landlord-Friendly · R+5
- County
- — inherits STATE
- City
- — inherits STATE
ZIP-level market 75216
- Home prices YoY
- -29.7%
- Rents YoY
- 4.2%
- Active inventory
- 249
- Price-to-rent
- 6.8×
Monthly cashflow live
- Estimated rent
- $1,726 high interval (Pro) →
- Mortgage (P&I)
- −$734
- Tax from tax record
- −$297 /mo · $3,565/yr
- Insurance
- −$58
- HOA
- −$0
- Vacancy / Maint / Mgmt
- −$362
- Net cashflow
- $274
Break-even live
UW: 25.0% down · 7.5% · 30yr · 1.5% tax · 5.0% vac · 8.0% maint · 8.0% mgmt
Financing live
Cash to close
- Down payment
- $35,000
- Closing costs
- $4,200
- Reserves months
- —
- Total cash needed
- —
Loan-product check · same deal, 3 products live
Conventional
25% down · 7.5% · 30yr
- Down + closing
- —
- Monthly P&I
- —
- Monthly cashflow
- —
- DSCR
- —
- Eligible?
- —
Personal DTI + credit; lowest rate.
DSCR
20% down · 8.5% · 30yr
- Down + closing
- —
- Monthly P&I
- —
- Monthly cashflow
- —
- DSCR
- —
- Eligible?
- —
No personal income docs; deal must DSCR.
Hard money
10% down · 12.0% · 12mo
- Down + closing
- —
- Monthly P&I
- —
- Monthly cashflow
- —
- DSCR
- —
- Eligible?
- —
Short-term bridge; refi at stabilization.
Rent comps 10 comps
| Address | Beds | Baths | Sqft | Rent | $/sqft | DOM | Units | Dist |
|---|---|---|---|---|---|---|---|---|
| 1214 Adelaide Dr Dallas, TX | 3.0 | 1.0 | 1040 | $2,350 | $2.26 | 7d | 1 | 0.42mi |
| 1334 Marfa Ave Dallas, TX | 3.0 | 2.0 | 1100 | $1,475 | $1.34 | 44d | 1 | 0.57mi |
| 3608 S Marsalis Ave Dallas, TX | 2.0 | 1.0 | 907 | $1,400 | $1.54 | 44d | 1 | 0.72mi |
| 1618 Marfa Ave Dallas, TX | 3.0 | 2.0 | 1100 | $1,900 | $1.73 | 44d | 1 | 0.76mi |
| 4417 S Lancaster Rd Dallas, TX | 2.0 | 1.0–2.0 | 874 | $1,595 | $1.82 | 2d | 1 | 0.77mi |
| 4934 Kildare Ave Dallas, TX | 3.0 | 2.0 | 1118 | $1,595 | $1.43 | 24d | 1 | 0.87mi |
| 1435 Whispering Trl Dallas, TX | 3.0 | 1.0 | 1047 | $1,660 | $1.59 | 7d | 1 | 1.07mi |
| 1754 E Red Bird Ln Dallas, TX | 3.0 | 1.5 | 1115 | $1,675 | $1.50 | 7d | 1 | 1.37mi |
| 3702 Conway St Dallas, TX | 2.0–3.0 | 1.5–2.0 | 1033 | $1,445 | $1.40 | 1d | 5 | 1.45mi |
| 3702 Conway St Dallas, TX | 1.0 | 1.0 | 658 | $1,295 | $1.97 | 44d | 3 | 1.45mi |
Listing history 7 events
-
2025-12-16price $140,000 213-char remark
Show marketing remark (213 chars)
Take a look at this less than $200k single-family home with a huge back yard for your family and friend's reunion. AC unit and furnace replaced around 07-2025 and water heater 03-2025. Don't lose this opportunity.
-
2025-12-07price $165,000 213-char remark
Show marketing remark (213 chars)
Take a look at this less than $200k single-family home with a huge back yard for your family and friend's reunion. AC unit and furnace replaced around 07-2025 and water heater 03-2025. Don't lose this opportunity.
-
2025-11-10price $175,000 213-char remark
Show marketing remark (213 chars)
Take a look at this less than $200k single-family home with a huge back yard for your family and friend's reunion. AC unit and furnace replaced around 07-2025 and water heater 03-2025. Don't lose this opportunity.
-
2025-11-03price $186,000 213-char remark
Show marketing remark (213 chars)
Take a look at this less than $200k single-family home with a huge back yard for your family and friend's reunion. AC unit and furnace replaced around 07-2025 and water heater 03-2025. Don't lose this opportunity.
-
2025-10-25$189,000 Active 213-char remark
Show marketing remark (213 chars)
Take a look at this less than $200k single-family home with a huge back yard for your family and friend's reunion. AC unit and furnace replaced around 07-2025 and water heater 03-2025. Don't lose this opportunity.
-
2011-09-12soldstatus
-
1991-02-04soldstatus
ⓘ Source: listings_history table (triggers on properties + properties_extension) + one-shot
backfill from property_details.listing_events for pre-trigger history.
Tax reassessment forecast TX · Resets to sale price
- Current annual tax
- $3,565 · $297/mo
- Projected year-2 tax
- $3,565 · $297/mo
- Expected delta
- $0/yr ($0/mo · 0.0%)
ⓘ Screening estimate from a state-policy table — verify with the county assessor before closing.
Climate risk First Street
- Flood 1/10 Low FEMA zone X (unshaded) · 0% chance over 30 yrs
- Wildfire 1/10 Low
- Heat 7/10 Severe 7 d/yr ≥110°F today · 24 d/yr by 30 yrs out
- Wind 6/10 Major 27% chance of damaging wind over 30 yrs
- Air quality 2/10 Low 1 unhealthy d/yr today · 2 by 30 yrs out
Nearby sold comps map
Loading sold comps map…
Walkable amenities ~0.75 mi
Loading nearby amenities…
Taxation est. · year 1
- Rental income
- $20,713
- − Mortgage interest
- −$7,842
- − Property taxes
- −$3,565
- − Insurance
- −$700
- − Repairs & maintenance
- −$1,657
- − Management
- −$1,657
- − Depreciation
- −$4,073
- Taxable income
- $1,219
- Est. tax owed @ 24.0%
- −$292
- After-tax cash flow
- $2,995/yr
For passive investors: Depreciation is non-cash, so a rental often shows a tax loss while cash-flowing — sheltering income. Rental losses are passive: they offset passive income freely, and up to $25,000/yr can offset ordinary (W-2) income if you actively participate and your MAGI is under $100k (phasing out to $0 by $150k); unused losses carry forward. On sale, claimed depreciation is recaptured at up to 25%, and gains may owe capital-gains tax (a 1031 exchange can defer both). Figures are a year-1 estimate at your 24.0% rate — not tax advice; consult a CPA.
Schools (NCES district)
- District
- Dallas ISD
- NCES district ID
- 4816230
- Math proficiency
- 31% ▼ -16.00%
- Reading proficiency
- 36% ▼ -4.00%
- Median HH income
- $42,881
- Composite
- 28.41/100
- National rank
- #6763
- State rank
- #559 of 826 in TX
Livability — Dallas
- Score
- 81/100
- State rank
- #24
- US rank
- #1380
Category grades
Schools grade is shown separately in the Schools card above.
Census & demographics
- Census place
- Dallas, TX
- County
- Dallas County · 2,612,404 people
- City population
- 1,168,437
- Metro
- Dallas-Fort Worth-Arlington, TX
- Population (ZIP)
- 55,894
- Household income
- $41,386
- Rent vs Own
- Severe rent burden
- 2465.0
Population outlook (Dallas County) Hauer SSP2
- Today (2025)
- 2,979,839 people
- By 2030
- 3,191,823 · +7.1%
- By 2040
- 3,619,611 · +21.5%
- By 2050
- 4,026,915 · +35.1%
- By 2075
- 4,957,073 · +66.4%
- By 2100
- 5,508,725 · +84.9%
Race, ethnicity, and origin ACS 2023
- Neighborhood character
- Majority Black (51%)
- Race & ethnicity
- Black 51% Hispanic / Latino 44% Two or more races 14% White 3%
- Hispanic origin (detail)
- Mexican 40%
- Common ancestry
- Hispanic 1%
- Foreign-born
- 17% · Canada
- Languages at home
- 62% English-only · Spanish 37%
Political lean MEDSL · Dallas
- 2024 margin
- Strong D (+22.2) · D 60.2% · R 38.0% · Other 1.8%
- 2008→2024 swing
- +6.9pp toward D · 2008: 15.3pp · 2024: 22.2pp
- All cycles
- 2024: D+22.2 2020: D+31.6 2016: D+26.2 2012: D+15.4 2008: D+15.3
Not yet ingested
- Civics
- —
Market trends
- HPI YoY
- ▼ -126.35%
- Current HPI
- 299.1825
- Rent YoY
- ▲ 4.20%
- Metro
- Dallas-Fort Worth-Arlington, TX
- State GDP YoY
- ▲ 3.95%
- F500 in state
- 110
Industry mix (Fortune 500 HQ in TX)
| Industry | F500 HQs | Revenue |
|---|---|---|
| Energy | 16 | $1,198B |
|
||
| Technology | 5 | $198B |
|
||
| Engineering / Construction | 4 | $72B |
|
||
| Energy Services | 3 | $60B |
|
||
| Utilities | 3 | $41B |
|
||
| Healthcare | 2 | $330B |
|
||
Price history
-25.9% since first listed7 events — show timeline
- 2025-12-16 Price Changed $140,000 NTREIS
- 2025-12-07 Price Changed $165,000 NTREIS
- 2025-11-10 Price Changed $175,000 NTREIS
- 2025-11-03 Price Changed $186,000 NTREIS
- 2025-10-25 Listed $189,000 NTREIS
- 2011-09-12 Sold (Public Records) — Public Records
- 1991-02-04 Sold (Public Records) — Public Records
Property tax history
+7.5%/yrLatest (2025): $3,565 · +2.1% YoY. Source: county tax records.
Cash-flow waterfall
monthlySold comps — $/sqft
last 12 mo · ≤1 miLoading sold comps…