11994 W 400 N · Linton, IN
Flood risk 1/10 · Minimal
- FEMA flood zone
- X (unshaded)
- Chance of flooding over 30 yrs
- 0.0%
- Est. flood insurance / yr
- $507 – $1,088
Fire risk 4/10 · Minor
- Est. fire insurance / yr
- $717 – $1,331
Heat risk 4/10 · Minor
- Hot days now (above 105°F)
- 7 days/yr
- Hot days in 30 yrs
- 19 days/yr
Wind risk 2/10 · Minimal
- Chance of severe wind over 30 yrs
- 2.0%
Air-quality risk 3/10 · Minor
- Unhealthy air days now
- 1 days/yr
- Unhealthy air days in 30 yrs
- 3 days/yr
Risk factors via First Street. Map © Google.
Why this score? — see what drove the B- grade
The composite is a weighted blend of 9 inputs, each scored 0–100. Each bar is that input's sub-score; the figure is the points it added to the 100-point composite (weight × sub-score).
- Cash flow +29.7/30.0
- DSCR +10.0/10.0
- 1% rule +8.3/10.0
- ARV discount +7.5/15.0
- Livability +3.6/5.0
- Schools +3.5/10.0
- Rent growth +2.5/5.0
- Condition / age +2.2/5.0
- Appreciation +0.0/10.0
$100,000
🖨 Deal sheet 📄 Offer letter ✓ Due diligence
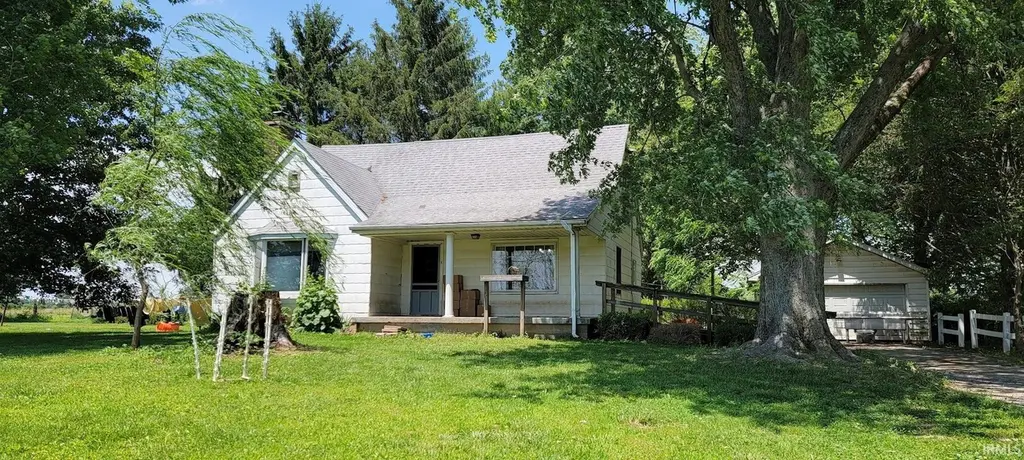
Listing remarks
Older home in the country with 3.5± acres that are just waiting for you to make it your own. Located near Linton, this 3 bedroom, 2 bath home offers about 1,992 finished sq. ft. with an 18x24 detached garage for extra storage, tools, or a small shop. It’s the kind of place that works if you’ve been wanting a little elbow room, a yard big enough for kids, pets, or a garden, and a country setting without a huge price tag. At ONLY $100,000, this one gives you a solid start in the country with enough ground to dream on and a home you can live in while you put your own touches on it over time. This Home is Currently functioning and being Utilized as Home Sweet Home. Home to se
Key facts
- 3.5 acre lot
- 2 garage spots
- Built 1948
Property features AI
Exterior
- Parking: Detached 2-car garage
- Utilities: Private well water; Septic tank sewer
- Home design: Single-family, site-built home; One-story layout
- Construction: Shingle siding and aluminum siding
- Exterior features: Pasture and rolling slope on the lot; 3.5-acre lot
Interior
- Bedrooms: Total of 6 rooms (bedrooms included)
- Bathrooms: Two full bathrooms; One main-level bathroom
- Heating & cooling: Central air conditioning; Natural gas heating; Wood heating
- Interior features: Full unfinished basement
Neighborhood map
What this means for you Summary
Snapshot
- This is a 3-bed/2.0-bath single-family listed at $100k. Condition is rated fair.
Deal economics
- At list price, monthly cash flow is $363 ($4k/yr) — positive.
- The deal already cash-flows at list — no discount required.
- Meets the 1% rule at list price ($1k rent vs $100k).
- Cap rate 10.7% vs local median 5.2% in Linton — top-decile yield for the area; either an underpriced asset or a hidden risk that comps aren't pricing in. Stress-test before assuming the spread holds.
Location & tenants
- Location reads 71/100 on livability (#129 in IN) — a middle-class / working-renter tenant base. Strengths: cost of living A+, housing A+, health & safety A+; Watch: schools D+, amenities F, commute F.
- Linton-Stockton School Corporation (town): math 39% / reading 45% proficiency, ranked #128 of 301 in IN (top 42%) — families likely to look elsewhere, expect single-tenant / working-renter base with shorter leases.
- Market conditions: 66 active listings in the ZIP.
Forward outlook
- Local home prices are declining (-3.0%/yr); year-one equity from $691 of loan paydown is wiped out by about $3k of value loss. Plan a longer hold.
- Greene County population projected at -22% by 2050 — secular population decline; favor cash flow + early exit over multi-decade hold.
- At projected returns (-3.0% appreciation + 3.0% rent growth), your $28k cash investment doubles in ~8 years — after that, you're playing with house money.
Negotiation context
- Only 5 days on market — expect competitive offers; lowballing is unlikely to land.
Risks & watch-outs
- Watch-outs: built in 1948 — expect roof / HVAC / electrical / plumbing capex.
Questions for the listing agent
- Have any recent inspections been done? Can we get a copy of the seller's disclosures and any deferred-maintenance estimates?
- Built in 1948 — when were the roof, HVAC, electrical panel, plumbing, and water heater last replaced?
- Is there a deadline driving the sale (1031 exchange, divorce, estate, relocation)? That informs how much negotiation room exists.
- Schools are D-rated, which usually means shorter tenancies and higher turnover. Who's the typical renter profile here, and what's been the actual vacancy rate?
- What's the average days-on-market for RENTAL listings here right now (not sales)? A rising rental-DOM trend means longer vacancies and softer asking-rent achievability than the comps imply.
- What's the recent tenant-quality profile in this submarket — average credit score on applications, eviction rate, late-payment / NSF rate, and stable-employment percentage? A property-management company in the area should have these aggregated.
- How much new for-sale + rental construction is in the pipeline within 1–3 miles? Heavy new supply typically softens prices + rents 12–24 months out; constrained supply supports both.
Investment metrics
- 1% rule
- 1.33% ✓
- Cap rate
- 10.65%
- Cash-on-cash
- 15.58%
- DSCR
- 1.69
- GRM
- 6.2
CMA / ARV
No comps found within radius.
Projected returns pro-forma
-3.0% appreciation · 3.0% rent growth · sell at horizon
- IRR
- 6.4%
- Equity multiple
- 1.25×
- Total profit
- $6,966
- Equity at exit
- $14,910
- IRR
- 15.8%
- Equity multiple
- 2.28×
- Total profit
- $35,958
- Equity at exit
- $8,646
Cash invested: $28,000 (down + closing). Projections, not guarantees.
Landlord ↔ Tenant lean methodology
- Overall (STATE)
- 90 Strongly Landlord-Friendly
- State Indiana
- 90 Strongly Landlord-Friendly · R+11
- County
- — inherits STATE
- City
- — inherits STATE
ZIP-level market 47441
- Home prices YoY
- -31.3%
- Active inventory
- 66
- Price-to-rent
- 6.2×
Monthly cashflow live
- Estimated rent
- $1,335 medium interval (Pro) →
- Mortgage (P&I)
- −$524
- Tax est. 1.5%
- −$125 /mo · $1,500/yr
- Insurance
- −$42
- HOA
- −$0
- Vacancy / Maint / Mgmt
- −$280
- Net cashflow
- $363
Break-even live
UW: 25.0% down · 7.5% · 30yr · 1.5% tax · 5.0% vac · 8.0% maint · 8.0% mgmt
Financing live
Cash to close
- Down payment
- $25,000
- Closing costs
- $3,000
- Reserves months
- —
- Total cash needed
- —
Loan-product check · same deal, 3 products live
Conventional
25% down · 7.5% · 30yr
- Down + closing
- —
- Monthly P&I
- —
- Monthly cashflow
- —
- DSCR
- —
- Eligible?
- —
Personal DTI + credit; lowest rate.
DSCR
20% down · 8.5% · 30yr
- Down + closing
- —
- Monthly P&I
- —
- Monthly cashflow
- —
- DSCR
- —
- Eligible?
- —
No personal income docs; deal must DSCR.
Hard money
10% down · 12.0% · 12mo
- Down + closing
- —
- Monthly P&I
- —
- Monthly cashflow
- —
- DSCR
- —
- Eligible?
- —
Short-term bridge; refi at stabilization.
Listing history 5 events
-
2026-06-16status $100,000 Pending 5 DOM
-
2026-06-15days on market $100,000 Active 5 DOM
-
2026-06-13days on market $100,000 Active 3 DOM
-
2026-06-12remarks 680-char remark
-
2026-06-12$100,000 Active 2 DOM
ⓘ Source: listings_history table (triggers on properties + properties_extension) + one-shot
backfill from property_details.listing_events for pre-trigger history.
Climate risk First Street
- Flood 1/10 Low FEMA zone X (unshaded) · 0% chance over 30 yrs
- Wildfire 4/10 Moderate
- Heat 4/10 Moderate 7 d/yr ≥105°F today · 19 d/yr by 30 yrs out
- Wind 2/10 Low 2% chance of damaging wind over 30 yrs
- Air quality 3/10 Moderate 1 unhealthy d/yr today · 3 by 30 yrs out
Nearby sold comps map
Loading sold comps map…
Walkable amenities ~0.75 mi
Loading nearby amenities…
Taxation est. · year 1
- Rental income
- $16,019
- − Mortgage interest
- −$5,602
- − Property taxes
- −$1,500
- − Insurance
- −$500
- − Repairs & maintenance
- −$1,281
- − Management
- −$1,281
- − Depreciation
- −$2,909
- Taxable income
- $2,945
- Est. tax owed @ 24.0%
- −$707
- After-tax cash flow
- $3,655/yr
For passive investors: Depreciation is non-cash, so a rental often shows a tax loss while cash-flowing — sheltering income. Rental losses are passive: they offset passive income freely, and up to $25,000/yr can offset ordinary (W-2) income if you actively participate and your MAGI is under $100k (phasing out to $0 by $150k); unused losses carry forward. On sale, claimed depreciation is recaptured at up to 25%, and gains may owe capital-gains tax (a 1031 exchange can defer both). Figures are a year-1 estimate at your 24.0% rate — not tax advice; consult a CPA.
Condition & rehab AI · 12 photos
This older home in the country requires moderate renovations to update the kitchen and bathrooms, paint interior walls, and replace flooring. Landscaping would also improve curb appeal and increase property value.
Repairs flagged
- Major kitchen cabinets — dated and worn
- Major bathroom fixtures — dated and worn
- Major flooring — worn hardwood
- Minor interior walls — some peeling paint
Value-add opportunities
- Resale update kitchen cabinets and fixtures — modernizing the kitchen
- Resale paint interior walls — improving the home's appearance
- Resale replace flooring — modernizing the home's appearance
- Both landscaping — enhancing curb appeal and increasing property value
Renovation cost estimate screening
| Repair item | Severity | Est. cost |
|---|---|---|
| kitchen cabinets · dated and worn | Major | $15,000–50,000 |
| bathroom fixtures · dated and worn | Major | $15,000–50,000 |
| flooring · worn hardwood | Major | $15,000–50,000 |
| interior walls · some peeling paint | Minor | $500–3,000 |
| Total estimated repair cost · 4 items | $45,500–153,000 |
Value-add ROI direction
- Resale update kitchen cabinets and fixtures — modernizing the kitchen ↑
- Resale paint interior walls — improving the home's appearance ↑
- Resale replace flooring — modernizing the home's appearance ↑
- Both landscaping — enhancing curb appeal and increasing property value ↑
ⓘ Cost ranges are severity-bucket heuristics (US national rule-of-thumb). Get contractor quotes + a written scope before underwriting a rehab budget.
Schools (NCES district)
- District
- Linton-Stockton School Corporation
- NCES district ID
- 1805910
- Math proficiency
- 39% ▼ -6.00%
- Reading proficiency
- 45% ▼ -5.00%
- Median HH income
- $40,257
- Composite
- 35.2/100
- National rank
- #4990
- State rank
- #128 of 301 in IN
Livability — Linton
- Score
- 71/100
- State rank
- #129
- US rank
- #6717
Category grades
Schools grade is shown separately in the Schools card above.
Census & demographics
- City population
- 8,755
- Population (ZIP)
- 8,755
Population outlook (Greene County) Hauer SSP2
- Today (2025)
- 30,724 people
- By 2030
- 29,506 · -4.0%
- By 2040
- 26,744 · -13.0%
- By 2050
- 23,879 · -22.3%
- By 2075
- 18,341 · -40.3%
- By 2100
- 13,976 · -54.5%
Race, ethnicity, and origin ACS 2023
- Neighborhood character
- Predominantly White (96%)
- Race & ethnicity
- White 96% Hispanic / Latino 2% Two or more races 1%
- Common ancestry
- Lithuanian 7% Slovak 2% Iranian 1%
- Foreign-born
- 1% · Canada
Political lean MEDSL · Greene
- 2024 margin
- Solid R (+53.7) · D 22.4% · R 76.1% · Other 1.6%
- 2008→2024 swing
- -39.2pp toward R · 2008: -14.5pp · 2024: -53.7pp
- All cycles
- 2024: R+53.7 2020: R+52.2 2016: R+53.4 2012: R+31.4 2008: R+14.5
Not yet ingested
- Civics
- —
Market trends
- HPI YoY
- ▼ -87.46%
- Current HPI
- 191.9718
- Rent YoY
- —
- Metro
- —
- State GDP YoY
- ▲ 2.90%
- F500 in state
- 18
Industry mix (Fortune 500 HQ in IN)
| Industry | F500 HQs | Revenue |
|---|---|---|
| Industrial Machinery | 2 | $37B |
|
||
| Healthcare | 1 | $177B |
|
||
| Pharmaceuticals | 1 | $45B |
|
||
| Metals / Steel | 1 | $18B |
|
||
| Agriculture | 1 | $17B |
|
||
| Packaging | 1 | $12B |
|
||
Price history
1 event — show timeline
- 2026-06-10 Listed $100,000 IRMLS
Cash-flow waterfall
monthlySold comps — $/sqft
last 12 mo · ≤1 miLoading sold comps…