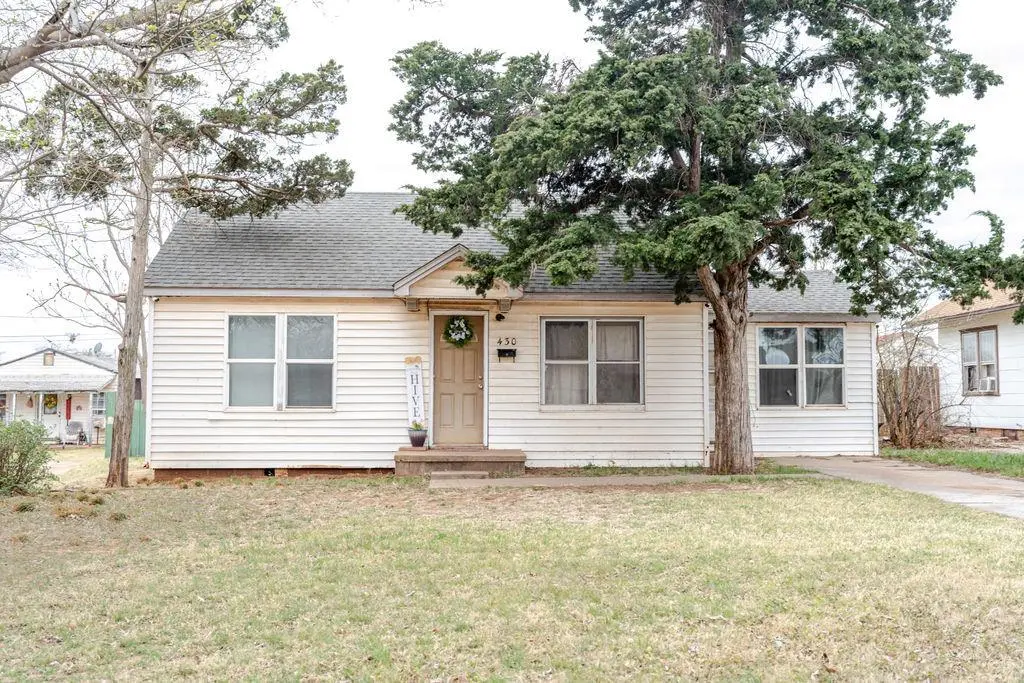
430 S 15th St · Clinton, OK
Flood risk 1/10 · Minimal
- FEMA flood zone
- X (unshaded)
- Chance of flooding over 30 yrs
- 0.0%
- Est. flood insurance / yr
- $507 – $1,088
Fire risk 6/10 · Moderate
- Est. fire insurance / yr
- $2,463 – $4,575
Heat risk 6/10 · Moderate
- Hot days now (above 107°F)
- 7 days/yr
- Hot days in 30 yrs
- 20 days/yr
Wind risk 2/10 · Minimal
- Chance of severe wind over 30 yrs
- 2.0%
Air-quality risk 1/10 · Minimal
- Unhealthy air days now
- 0 days/yr
- Unhealthy air days in 30 yrs
- 0 days/yr
Risk factors via First Street. Map © Google.
Why this score? — see what drove the C+ grade
The composite is a weighted blend of 9 inputs, each scored 0–100. Each bar is that input's sub-score; the figure is the points it added to the 100-point composite (weight × sub-score).
- Cash flow +25.1/30.0
- DSCR +8.2/10.0
- ARV discount +7.5/15.0
- 1% rule +5.5/10.0
- Appreciation +3.8/10.0
- Livability +3.2/5.0
- Rent growth +2.5/5.0
- Condition / age +2.5/5.0
- Schools +1.9/10.0
$80,000
🖨 Deal sheet 📄 Offer letter ✓ Due diligence
Listing remarks
You want to talk about cute! This house already has “HOME” wrote all over it from the front door with the yard lined with upright cedar trees to add green all year long. It sits in a quiet neighborhood in Clinton, Ok. Near Gary Blvd. And Clinton Public Schools. This quaint 3 bedroom/ 1 bath home is waiting for you to come make it yours. Call now to catch this opportunity to make it yours!
Key facts
- Quiet neighborhood
- 7,131 sq ft lot
- Built 1950
Tags
Property features AI
Finance
- Other: Homestead exempt; Located in Clinton Broadway Heights addition
- Financial info: Loan qualification allowed
- HOA & community: No mandatory association dues
Exterior
- Home design: Single family residence; One story; Existing property
- Construction: Vinyl siding; Composition roof; Combination foundation
- Exterior features: Covered porch; Interior lot
Interior
- Bedrooms: 3 bedrooms
- Bathrooms: 1 full bathroom; 1 half bathroom
- Heating & cooling: Window unit cooling
- Interior features: One living area; No fireplace
Neighborhood map
What this means for you Summary
Snapshot
- This is a 2-bed/1.0-bath single-family listed at $80k.
Deal economics
- At list price, monthly cash flow is $175 ($2k/yr) — positive.
- The deal already cash-flows at list — no discount required.
- Meets the 1% rule at list price ($838 rent vs $80k).
- Recommended offer: $75k (6.0% below list) — sets the bar for market timing.
- Cap rate 8.9% vs local median 6.1% in Clinton — top-decile yield for the area; either an underpriced asset or a hidden risk that comps aren't pricing in. Stress-test before assuming the spread holds.
Location & tenants
- Location reads 63/100 on livability (#196 in OK) — a middle-class / working-renter tenant base. Strengths: cost of living A+, housing A-; Watch: crime D+, amenities F, commute F.
- Clinton (town): math 21% / reading 23% proficiency, ranked #149 of 270 in OK (top 55%) — low school quality limits family demand, transient renter base, plan for 1-2y turnover; 67% free/reduced lunch — lower-income household profile, screen leases tightly.
- Zoned schools: Southwest Es (math 20% / reading 14%, grade F, #540 of 845 statewide, top 68%, 468 students, 0% FRL); Clinton Hs (math 8% / reading 22%, grade F, #332 of 447 statewide, top 78%, 629 students, 0% FRL) — zoned schools average 0% FRL vs 67% district-wide (67 pts lower); this property's tenant base skews higher-income than the district average.
- Market conditions: 77 active listings in the ZIP; 28 units permitted in Custer County in 2024 (5 in 5+ unit buildings).
Forward outlook
- Local home prices are declining (-2.4%/yr); year-one equity from $553 of loan paydown is wiped out by about $2k of value loss. Plan a longer hold.
- Custer County population projected at +47% by 2050 — long-run rental-demand tailwind backs the buy-and-hold thesis.
- At projected returns (-2.4% appreciation + 3.0% rent growth), your $22k cash investment doubles in ~10 years — after that, you're playing with house money.
Negotiation context
- It's been on market 79 days — a 6% lower offer ($75k) is reasonable based on typical stale-listing flexibility.
- Current owner paid $16k; list at $80k implies a 385% gain — meaningful room to come down on a strong offer.
Risks & watch-outs
- Watch-outs: built in 1950 — expect roof / HVAC / electrical / plumbing capex.
- Climate carrying-cost: major wildfire risk; extreme-heat days projected 7→20/yr by 2055 (HVAC capex compounding) — expect insurance premiums to compound above CPI over the hold.
Questions for the listing agent
- It's been on market 79 days. Have you received any prior offers? Is the seller open to a 6% concession, seller financing, or rate buy-down credit?
- Built in 1950 — when were the roof, HVAC, electrical panel, plumbing, and water heater last replaced?
- Why hasn't it sold? Are there any deal-killer items the seller is aware of (foundation, flood, title, zoning, code violations)?
- Is there a deadline driving the sale (1031 exchange, divorce, estate, relocation)? That informs how much negotiation room exists.
- Schools are F-rated, which usually means shorter tenancies and higher turnover. Who's the typical renter profile here, and what's been the actual vacancy rate?
- Crime grade is D in this area — have there been break-ins, vandalism, or insurance claims at this property in the last 3 years? What carrier currently insures it and at what premium?
- What's the average days-on-market for RENTAL listings here right now (not sales)? A rising rental-DOM trend means longer vacancies and softer asking-rent achievability than the comps imply.
- What's the recent tenant-quality profile in this submarket — average credit score on applications, eviction rate, late-payment / NSF rate, and stable-employment percentage? A property-management company in the area should have these aggregated.
- How much new for-sale + rental construction is in the pipeline within 1–3 miles? Heavy new supply typically softens prices + rents 12–24 months out; constrained supply supports both.
Investment metrics
- 1% rule
- 1.05% ✓
- Cap rate
- 8.93%
- Cash-on-cash
- 9.40%
- DSCR
- 1.42
- GRM
- 8.0
CMA / ARV
- ARV (on-the-fly)
- $44,544
- Comps found
- 2
Show comp detail 2 sales within ~0.75 mi
| Address | Dist | Beds/Ba | Sqft | Sold | Price | $/sf | Match |
|---|---|---|---|---|---|---|---|
| 1316 W Modelle Ave | 0.12mi | 2/1.0 | 852 (+11%) | 10mo | $49,500 | $58 | 68 |
| 1510 Orient Ave | 0.49mi | 2/1.0 | 875 (+14%) | 8mo | $50,000 | $57 | 48 |
Match score weights: distance 35% · size 25% · config 20% · recency 20%. Top-matched comps best support the ARV.
Projected returns pro-forma
-2.36% appreciation · 3.0% rent growth · sell at horizon
- IRR
- 0.4%
- Equity multiple
- 1.02×
- Total profit
- $343
- Equity at exit
- $14,224
- IRR
- 8.9%
- Equity multiple
- 1.74×
- Total profit
- $16,465
- Equity at exit
- $10,926
Cash invested: $22,400 (down + closing). Projections, not guarantees.
Landlord ↔ Tenant lean methodology
- Overall (STATE)
- 83 Strongly Landlord-Friendly
- State Oklahoma
- 83 Strongly Landlord-Friendly · R+20
- County
- — inherits STATE
- City
- — inherits STATE
ZIP-level market 73601
- Home prices YoY
- -1.0%
- Active inventory
- 77
- Price-to-rent
- 8.0×
Monthly cashflow live
- Estimated rent
- $838 medium interval (Pro) →
- Mortgage (P&I)
- −$420
- Tax from tax record
- −$34 /mo · $403/yr
- Insurance
- −$33
- HOA
- −$0
- Vacancy / Maint / Mgmt
- −$176
- Net cashflow
- $175
Break-even live
UW: 25.0% down · 7.5% · 30yr · 1.5% tax · 5.0% vac · 8.0% maint · 8.0% mgmt
Financing live
Cash to close
- Down payment
- $20,000
- Closing costs
- $2,400
- Reserves months
- —
- Total cash needed
- —
Loan-product check · same deal, 3 products live
Conventional
25% down · 7.5% · 30yr
- Down + closing
- —
- Monthly P&I
- —
- Monthly cashflow
- —
- DSCR
- —
- Eligible?
- —
Personal DTI + credit; lowest rate.
DSCR
20% down · 8.5% · 30yr
- Down + closing
- —
- Monthly P&I
- —
- Monthly cashflow
- —
- DSCR
- —
- Eligible?
- —
No personal income docs; deal must DSCR.
Hard money
10% down · 12.0% · 12mo
- Down + closing
- —
- Monthly P&I
- —
- Monthly cashflow
- —
- DSCR
- —
- Eligible?
- —
Short-term bridge; refi at stabilization.
Listing history 19 events
-
2026-06-18days on market $80,000 Active 79 DOM
-
2026-06-17days on market $80,000 Active 78 DOM
-
2026-06-16days on market $80,000 Active 77 DOM
-
2026-06-15days on market $80,000 Active 76 DOM
-
2026-06-13days on market $80,000 Active 74 DOM
-
2026-06-12days on market $80,000 Active 73 DOM
-
2026-06-09days on market $80,000 Active 70 DOM
-
2026-06-08days on market $80,000 Active 69 DOM
-
2026-06-08days on market $80,000 Active 68 DOM
-
2026-06-07days on market $80,000 Active 67 DOM
-
2026-06-04days on market $80,000 Active 64 DOM
-
2026-06-02days on market $80,000 Active 63 DOM
-
2026-06-01days on market $80,000 Active 62 DOM
-
2026-05-31days on market $80,000 Active 61 DOM
-
2026-05-12price $80,000
-
2026-03-30$87,000 Active
-
2001-11-26soldstatus $16,500
-
2000-11-07soldstatus $15,000
-
1999-06-03soldstatus $12,500
ⓘ Source: listings_history table (triggers on properties + properties_extension) + one-shot
backfill from property_details.listing_events for pre-trigger history.
Tax reassessment forecast OK · Resets to sale price
- Current annual tax
- $403 · $34/mo
- Projected year-2 tax
- $720 · $60/mo
- Expected delta
- +$317/yr (+$26/mo · 78.7%)
ⓘ Screening estimate from a state-policy table — verify with the county assessor before closing.
Climate risk First Street
- Flood 1/10 Low FEMA zone X (unshaded) · 0% chance over 30 yrs
- Wildfire 6/10 Major
- Heat 6/10 Major 7 d/yr ≥107°F today · 20 d/yr by 30 yrs out
- Wind 2/10 Low 2% chance of damaging wind over 30 yrs
- Air quality 1/10 Low 0 unhealthy d/yr today · 0 by 30 yrs out
Nearby sold comps map
Loading sold comps map…
Walkable amenities ~0.75 mi
Loading nearby amenities…
Taxation est. · year 1
- Rental income
- $10,055
- − Mortgage interest
- −$4,481
- − Property taxes
- −$403
- − Insurance
- −$400
- − Repairs & maintenance
- −$804
- − Management
- −$804
- − Depreciation
- −$2,327
- Taxable income
- $834
- Est. tax owed @ 24.0%
- −$200
- After-tax cash flow
- $1,906/yr
For passive investors: Depreciation is non-cash, so a rental often shows a tax loss while cash-flowing — sheltering income. Rental losses are passive: they offset passive income freely, and up to $25,000/yr can offset ordinary (W-2) income if you actively participate and your MAGI is under $100k (phasing out to $0 by $150k); unused losses carry forward. On sale, claimed depreciation is recaptured at up to 25%, and gains may owe capital-gains tax (a 1031 exchange can defer both). Figures are a year-1 estimate at your 24.0% rate — not tax advice; consult a CPA.
Schools (NCES district)
- District
- Clinton
- NCES district ID
- 4008070
- Math proficiency
- 21% ▼ -7.00%
- Reading proficiency
- 23% ▼ -7.00%
- Median HH income
- $43,693
- Composite
- 18.97/100
- National rank
- #8853
- State rank
- #149 of 270 in OK
Livability — Clinton
- Score
- 63/100
- State rank
- #196
- US rank
- #14999
Category grades
Schools grade is shown separately in the Schools card above.
Census & demographics
- Census place
- Clinton, OK
- Population (ZIP)
- 9,489
Population outlook (Custer County) Hauer SSP2
- Today (2025)
- 34,356 people
- By 2030
- 37,162 · +8.2%
- By 2040
- 43,354 · +26.2%
- By 2050
- 50,458 · +46.9%
- By 2075
- 71,075 · +106.9%
- By 2100
- 91,129 · +165.2%
Race, ethnicity, and origin ACS 2023
- Neighborhood character
- Diverse neighborhood (Simpson 0.61)
- Race & ethnicity
- White 52% Hispanic / Latino 34% Two or more races 17% Native American 5% Black 5%
- Hispanic origin (detail)
- Mexican 32%
- Common ancestry
- Slovak 1% Lithuanian 1% Scottish 1%
- Foreign-born
- 9% · Canada
- Languages at home
- 76% English-only · Spanish 23% Chinese 1%
Political lean MEDSL · Custer
- 2024 margin
- Solid R (+53.2) · D 22.4% · R 75.7% · Other 1.9%
- 2008→2024 swing
- -3.9pp toward R · 2008: -49.3pp · 2024: -53.2pp
- All cycles
- 2024: R+53.2 2020: R+53.2 2016: R+54.3 2012: R+51.9 2008: R+49.3
Not yet ingested
- Civics
- —
Market trends
- HPI YoY
- ▼ -2.36%
- Current HPI
- 244.5526
- Rent YoY
- —
- Metro
- —
- State GDP YoY
- ▲ 1.55%
- F500 in state
- 6
Industry mix (Fortune 500 HQ in OK)
| Industry | F500 HQs | Revenue |
|---|---|---|
| Energy | 3 | $48B |
|
||
Price history
+540.0% since first listed5 events — show timeline
- 2026-05-12 Price Changed $80,000 MLSOK
- 2026-03-30 Listed $87,000 MLSOK
- 2001-11-26 Sold (Public Records) $16,500 Public Records
- 2000-11-07 Sold (Public Records) $15,000 Public Records
- 1999-06-03 Sold (Public Records) $12,500 Public Records
Property tax history
+4.2%/yrLatest (2025): $403 · +2.5% YoY. Source: county tax records.
Cash-flow waterfall
monthlySold comps — $/sqft
last 12 mo · ≤1 miLoading sold comps…