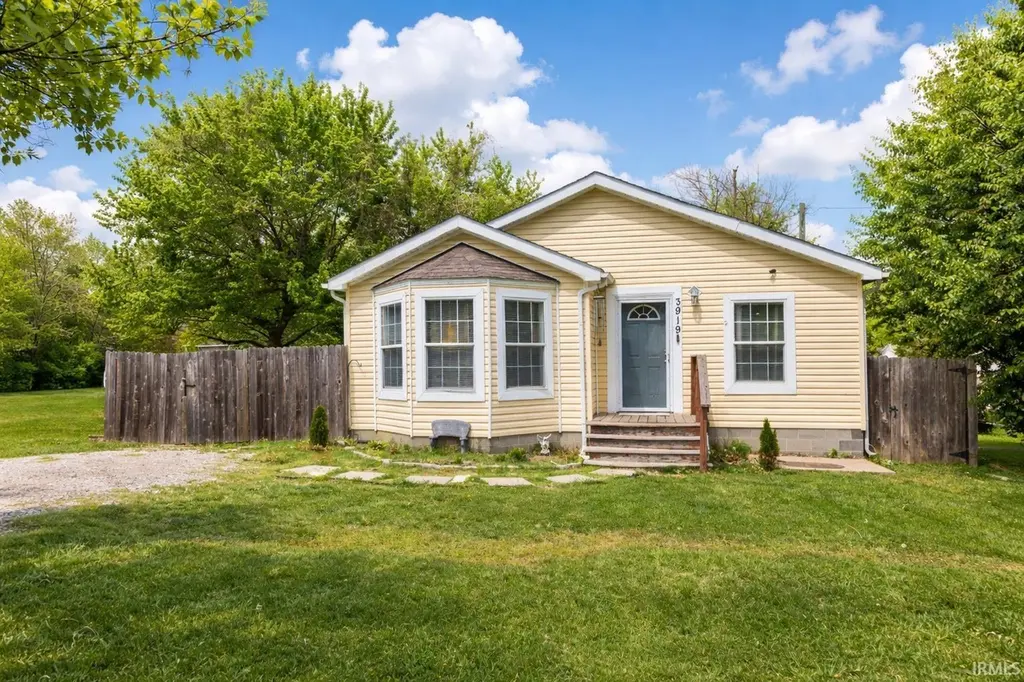
3919 Claremont Ave · Evansville, IN
Flood risk 1/10 · Minimal
- FEMA flood zone
- X (unshaded)
- Chance of flooding over 30 yrs
- 0.0%
- Est. flood insurance / yr
- $507 – $1,088
Fire risk 1/10 · Minimal
- Est. fire insurance / yr
- $717 – $1,331
Heat risk 5/10 · Moderate
- Hot days now (above 107°F)
- 7 days/yr
- Hot days in 30 yrs
- 19 days/yr
Wind risk 3/10 · Minor
- Chance of severe wind over 30 yrs
- 4.0%
Air-quality risk 4/10 · Minor
- Unhealthy air days now
- 3 days/yr
- Unhealthy air days in 30 yrs
- 5 days/yr
Risk factors via First Street. Map © Google.
Why this score? — see what drove the F grade
The composite is a weighted blend of 9 inputs, each scored 0–100. Each bar is that input's sub-score; the figure is the points it added to the 100-point composite (weight × sub-score).
- Cash flow +14.7/30.0
- DSCR +4.5/10.0
- Schools +3.3/10.0
- Livability +3.2/5.0
- 1% rule +3.1/10.0
- Rent growth +2.5/5.0
- Condition / age +2.5/5.0
- ARV discount +0.0/15.0
- Appreciation +0.0/10.0
$170,000
🖨 Deal sheet (PDF) 📄 Offer letter ✓ Due diligence
Listing remarks
Enjoy the perfect blend of suburban comfort and city convenience—just minutes from everything the west side has to offer! Situated on Claremont Avenue, this home is within the Tekoppel, Helfrich Park and Reitz High School districts. This well-maintained 3-bedroom, 2-bath home offers 1,772 square feet and sits on a spacious corner lot. The fully fenced backyard features a 6-foot cedar privacy fence with dual entry gates and includes a utility shed. Inside, you’ll find a bright, open-concept layout connecting the living room and kitchen, offering great flow and flexibility for everyday living. The kitchen/dining combo provides abundant cabinet space, multiple drawers, and a center
Key facts
- Utility shed
- Dual entry gates
- Kitchen dining combo
Tags
Property features AI
Finance
- Other:
- Financial info:
- HOA & community:
Exterior
- Parking:
- Security:
- Utilities: Public water; Public sewer
- Home design: Manufactured home (residential); Single-story
- Construction: Vinyl siding; Built with crawl space foundation
- Exterior features: Deck; Shed(s); Level lot
Interior
- Kitchen: Dishwasher; Microwave; Refrigerator; Electric range
- Bedrooms: Bedrooms located on the main level
- Flooring: Carpet; Laminate; Vinyl
- Bathrooms: Two full bathrooms, both on the main level
- Heating & cooling: Electric heating; Central air; Ceiling fan(s)
- Interior features: Walk-in closet(s); Ceiling fan(s); Eat-in kitchen; Primary bedroom on main level; Crawl space basement
- Laundry & utility: Laundry on the main level
Neighborhood map
What this means for you Summary
Snapshot
- This is a 3-bed/2.0-bath manufactured listed at $170k.
Deal economics
- At list price, monthly cash flow is $42 ($510/yr) — positive.
- The deal already cash-flows at list — no discount required.
- To meet the 1% rule (rent ≥ 1% of price), the offer needs to be $138k (18.5% below list).
- Recommended offer: $138k (18.5% below list) — sets the bar for 1% rule.
- Cap rate 6.6% vs local median 4.6% in Evansville — top-decile yield for the area; either an underpriced asset or a hidden risk that comps aren't pricing in. Stress-test before assuming the spread holds.
Location & tenants
- Location reads 63/100 on livability (#416 in IN) — a middle-class / working-renter tenant base. Strengths: cost of living A+, housing A+, health & safety A+; Watch: crime F, commute F, employment D-.
- Evansville Vanderburgh School Corporation (urban): math 36% / reading 43% proficiency, ranked #153 of 301 in IN (top 51%) — families likely to look elsewhere, expect single-tenant / working-renter base with shorter leases.
- Zoned schools: Tekoppel Elementary School (math 42% / reading 33%, grade F, #543 of 994 statewide, top 55%, 445 students, 73% FRL); Helfrich Park Stem Academy (math 36% / reading 47%, grade F, #108 of 330 statewide, top 34%, 517 students, 52% FRL); Francis Joseph Reitz High School (math 45% / reading 68%, grade C, #70 of 369 statewide, top 19%, 1,280 students, 44% FRL).
- Market conditions: 137 active listings in the ZIP; 1 comparable units currently listed for rent nearby; 508 units permitted in Vanderburgh County in 2024 (32 in 5+ unit buildings).
Forward outlook
- Local home prices are declining (-3.0%/yr); year-one equity from $1k of loan paydown is wiped out by about $5k of value loss. Plan a longer hold.
Negotiation context
- It's been on market 30 days — a 2% lower offer ($167k) is reasonable based on typical stale-listing flexibility.
- 8 sale attempts since 10y ago with the ask held roughly flat each time — persistent listings suggest the price (not the market) is what's stuck; bring a comps-based counter.
Risks & watch-outs
- Climate carrying-cost: extreme-heat days projected 7→19/yr by 2055 (HVAC capex compounding) — expect insurance premiums to compound above CPI over the hold.
Questions for the listing agent
- Is there a deadline driving the sale (1031 exchange, divorce, estate, relocation)? That informs how much negotiation room exists.
- Schools are D-rated, which usually means shorter tenancies and higher turnover. Who's the typical renter profile here, and what's been the actual vacancy rate?
- Crime grade is F in this area — have there been break-ins, vandalism, or insurance claims at this property in the last 3 years? What carrier currently insures it and at what premium?
- The area grade is low — what's the realistic commute time and amenity access for the typical tenant pool here? Any planned neighborhood developments (good or bad) we should know about?
- What's the average days-on-market for RENTAL listings here right now (not sales)? A rising rental-DOM trend means longer vacancies and softer asking-rent achievability than the comps imply.
- What's the recent tenant-quality profile in this submarket — average credit score on applications, eviction rate, late-payment / NSF rate, and stable-employment percentage? A property-management company in the area should have these aggregated.
- How much new for-sale + rental construction is in the pipeline within 1–3 miles? Heavy new supply typically softens prices + rents 12–24 months out; constrained supply supports both.
Investment metrics
- 1% rule
- 0.81% ✗
- Cap rate
- 6.59%
- Cash-on-cash
- 1.07%
- DSCR
- 1.05
- GRM
- 10.2
CMA / ARV
- ARV (on-the-fly)
- $139,988
- Comps found
- 1
Show comp detail 1 sale within ~0.75 mi
| Address | Dist | Beds/Ba | Sqft | Sold | Price | $/sf | Match |
|---|---|---|---|---|---|---|---|
| 300 S Werner Ave | 0.15mi | 4/2.0 (+1) | 2,025 (+14%) | 2mo | $160,000 | $79 | 63 |
Match score weights: distance 35% · size 25% · config 20% · recency 20%. Top-matched comps best support the ARV.
Projected returns pro-forma
-3.0% appreciation · 3.0% rent growth · sell at horizon
- IRR
- -14.6%
- Equity multiple
- 0.48×
- Total profit
- $-24,896
- Equity at exit
- $25,348
- IRR
- -6.0%
- Equity multiple
- 0.61×
- Total profit
- $-18,418
- Equity at exit
- $14,698
Cash invested: $47,600 (down + closing). Projections, not guarantees.
Landlord ↔ Tenant lean methodology
- Overall (STATE)
- 90 Strongly Landlord-Friendly
- State Indiana
- 90 Strongly Landlord-Friendly · R+11
- County
- — inherits STATE
- City
- — inherits STATE
ZIP-level market 47712
- Home prices YoY
- -32.1%
- Active inventory
- 137
- Price-to-rent
- 10.2×
Monthly cashflow live
- Estimated rent
- $1,385 medium interval (Pro) →
- Mortgage (P&I)
- −$891
- Tax from tax record
- −$89 /mo · $1,069/yr
- Insurance
- −$71
- HOA
- −$0
- Vacancy / Maint / Mgmt
- −$291
- Net cashflow
- $42
Break-even live
Sensitivity live
| Price | -10% $139 | -5% $91 | +0% $42 | +5% $-6 | +10% $-54 |
|---|---|---|---|---|---|
| Rent | -10% $-67 | -5% $-12 | +0% $42 | +5% $97 | +10% $152 |
| Rate | -1.0pp $128 | -0.5pp $86 | base $42 | +0.5pp $-2 | +1.0pp $-46 |
UW: 25.0% down · 7.5% · 30yr · 1.5% tax · 5.0% vac · 8.0% maint · 8.0% mgmt
Financing live
Cash to close
- Down payment
- $42,500
- Closing costs
- $5,100
- Reserves months
- —
- Total cash needed
- —
Loan-product check · same deal, 3 products live
Conventional
25% down · 7.5% · 30yr
- Down + closing
- —
- Monthly P&I
- —
- Monthly cashflow
- —
- DSCR
- —
- Eligible?
- —
Personal DTI + credit; lowest rate.
DSCR
20% down · 8.5% · 30yr
- Down + closing
- —
- Monthly P&I
- —
- Monthly cashflow
- —
- DSCR
- —
- Eligible?
- —
No personal income docs; deal must DSCR.
Hard money
10% down · 12.0% · 12mo
- Down + closing
- —
- Monthly P&I
- —
- Monthly cashflow
- —
- DSCR
- —
- Eligible?
- —
Short-term bridge; refi at stabilization.
Rent comps 1 comps
| Address | Beds | Baths | Sqft | Rent | $/sqft | DOM | Units | Dist |
|---|---|---|---|---|---|---|---|---|
| 4002 Petes Ct Evansville, IN | 3.0 | 2.0 | 1776 | $1,600 | $0.90 | 23d | 1 | 0.72mi |
Listing history 30 events
-
2026-06-22days on market $170,000 Active 30 DOM
-
2026-06-18days on market $170,000 Active 27 DOM
-
2026-06-17days on market $170,000 Active 26 DOM
-
2026-06-16days on market $170,000 Active 25 DOM
-
2026-06-15days on market $170,000 Active 24 DOM
-
2026-06-14days on market $170,000 Active 22 DOM
-
2026-06-13days on market $170,000 Active 21 DOM
-
2026-06-10days on market $170,000 Active 19 DOM
-
2026-06-09days on market $170,000 Active 18 DOM
-
2026-06-08days on market $170,000 Active 17 DOM
-
2026-06-07days on market $170,000 Active 16 DOM
-
2026-06-02days on market $170,000 Active 11 DOM
-
2026-06-01days on market $170,000 Active 10 DOM
-
2026-05-31days on market $170,000 Active 9 DOM
-
2026-05-30days on market $170,000 Active 8 DOM
-
2026-05-22$170,000 Active
-
2026-04-29status Active
-
2026-04-27status Pending
-
2026-04-17$175,000 Active
-
2022-11-15status Pending
-
2022-10-21status Active
-
2022-10-13status Pending
-
2022-10-08status Active
-
2022-09-23status Pending
-
2022-09-09price $138,000
-
2022-09-08status Active
-
2022-08-29status Pending
-
2022-07-06price $144,000
-
2022-06-14$150,000 Active
-
2016-11-07$113,500
ⓘ Source: listings_history table (triggers on properties + properties_extension) + one-shot
backfill from property_details.listing_events for pre-trigger history.
Tax reassessment forecast IN · Partial reset (capped growth)
- Current annual tax
- $1,069 · $89/mo
- Projected year-2 tax
- $1,257 · $105/mo
- Expected delta
- +$188/yr (+$16/mo · 17.6%)
ⓘ Screening estimate from a state-policy table — verify with the county assessor before closing.
Climate risk First Street
- Flood 1/10 Low FEMA zone X (unshaded) · 0% chance over 30 yrs
- Wildfire 1/10 Low
- Heat 5/10 Major 7 d/yr ≥107°F today · 19 d/yr by 30 yrs out
- Wind 3/10 Moderate 4% chance of damaging wind over 30 yrs
- Air quality 4/10 Moderate 3 unhealthy d/yr today · 5 by 30 yrs out
Nearby sold comps map
Loading sold comps map…
Walkable amenities ~0.75 mi
Loading nearby amenities…
Taxation est. · year 1
- Rental income
- $16,616
- − Mortgage interest
- −$9,523
- − Property taxes
- −$1,069
- − Insurance
- −$850
- − Repairs & maintenance
- −$1,329
- − Management
- −$1,329
- − Depreciation
- −$4,945
- Taxable loss
- −$2,429
- Est. tax savings @ 24.0%
- +$583
- After-tax cash flow
- $1,093/yr
For passive investors: Depreciation is non-cash, so a rental often shows a tax loss while cash-flowing — sheltering income. Rental losses are passive: they offset passive income freely, and up to $25,000/yr can offset ordinary (W-2) income if you actively participate and your MAGI is under $100k (phasing out to $0 by $150k); unused losses carry forward. On sale, claimed depreciation is recaptured at up to 25%, and gains may owe capital-gains tax (a 1031 exchange can defer both). Figures are a year-1 estimate at your 24.0% rate — not tax advice; consult a CPA.
Schools (NCES district)
- District
- Evansville Vanderburgh School Corporation
- NCES district ID
- 1803450
- Math proficiency
- 36% ▼ -7.00%
- Reading proficiency
- 43% ▼ -3.00%
- Median HH income
- $43,270
- Composite
- 33.41/100
- National rank
- #5471
- State rank
- #153 of 301 in IN
Livability — Evansville
- Score
- 63/100
- State rank
- #416
- US rank
- #15047
Category grades
Schools grade is shown separately in the Schools card above.
Census & demographics
- Census place
- Evansville, IN
- County
- Vanderburgh County · 146,793 people
- City population
- 146,793
- Metro
- Evansville, IN-KY
- Population (ZIP)
- 25,444
- Household income
- $68,494
- Rent vs Own
- Severe rent burden
- 797.0
Population outlook (Vanderburgh County) Hauer SSP2
- Today (2025)
- 187,038 people
- By 2030
- 188,907 · +1.0%
- By 2040
- 190,272 · +1.7%
- By 2050
- 188,871 · +1.0%
- By 2075
- 180,751 · -3.4%
- By 2100
- 163,015 · -12.8%
Race, ethnicity, and origin ACS 2023
- Neighborhood character
- Predominantly White (91%)
- Race & ethnicity
- White 91% Two or more races 4% Hispanic / Latino 2% Black 2% Asian 2%
- Common ancestry
- Romanian 3% Lithuanian 2% Italian 1%
- Foreign-born
- 2% · China, Canada
- Languages at home
- 97% English-only · Spanish 1%
Political lean MEDSL · Vanderburgh
- 2024 margin
- R (+12.7) · D 43.0% · R 55.6% · Other 1.4%
- 2008→2024 swing
- -15.1pp toward R · 2008: 2.5pp · 2024: -12.7pp
- All cycles
- 2024: R+12.7 2020: R+9.6 2016: R+16.9 2012: R+10.8 2008: D+2.5
Not yet ingested
- Civics
- —
Market trends
- HPI YoY
- ▼ -101.86%
- Current HPI
- 215.5153
- Rent YoY
- —
- Metro
- Evansville, IN-KY
- State GDP YoY
- ▲ 2.90%
- F500 in state
- 18
Industry mix (Fortune 500 HQ in IN)
| Industry | F500 HQs | Revenue |
|---|---|---|
| Industrial Machinery | 2 | $37B |
|
||
| Healthcare | 1 | $177B |
|
||
| Pharmaceuticals | 1 | $45B |
|
||
| Metals / Steel | 1 | $18B |
|
||
| Agriculture | 1 | $17B |
|
||
| Packaging | 1 | $12B |
|
||
Price history
+49.8% since first listed15 events — show timeline
- 2026-05-22 Listed $170,000 IRMLS
- 2026-04-29 Relisted — IRMLS
- 2026-04-27 Pending — IRMLS
- 2026-04-17 Listed $175,000 IRMLS
- 2022-11-15 Pending — IRMLS
- 2022-10-21 Relisted — IRMLS
- 2022-10-13 Pending — IRMLS
- 2022-10-08 Relisted — IRMLS
- 2022-09-23 Pending — IRMLS
- 2022-09-09 Price Changed $138,000 IRMLS
- 2022-09-08 Relisted — IRMLS
- 2022-08-29 Pending — IRMLS
- 2022-07-06 Price Changed $144,000 IRMLS
- 2022-06-14 Listed $150,000 IRMLS
- 2016-11-07 Listed $113,500 IRMLS
Property tax history
-0.8%/yrLatest (2024): $1,069 · -2.9% YoY. Source: county tax records.
Cash-flow waterfall
monthlySold comps — $/sqft
last 12 mo · ≤1 miLoading sold comps…