2700 NW 203rd St · Oklahoma City, OK
Flood risk 1/10 · Minimal
- FEMA flood zone
- X (unshaded)
- Chance of flooding over 30 yrs
- 0.0%
- Est. flood insurance / yr
- $507 – $1,088
Fire risk 4/10 · Minor
- Est. fire insurance / yr
- $2,463 – $4,575
Heat risk 6/10 · Moderate
- Hot days now (above 108°F)
- 7 days/yr
- Hot days in 30 yrs
- 19 days/yr
Wind risk 2/10 · Minimal
- Chance of severe wind over 30 yrs
- 4.0%
Air-quality risk 2/10 · Minimal
- Unhealthy air days now
- 1 days/yr
- Unhealthy air days in 30 yrs
- 1 days/yr
Risk factors via First Street. Map © Google.
Why this score? — see what drove the D grade
The composite is a weighted blend of 9 inputs, each scored 0–100. Each bar is that input's sub-score; the figure is the points it added to the 100-point composite (weight × sub-score).
- ARV discount +11.8/15.0
- Cash flow +10.5/30.0
- Schools +4.1/10.0
- Livability +4.0/5.0
- Condition / age +4.0/5.0
- 1% rule +3.3/10.0
- DSCR +3.0/10.0
- Rent growth +2.8/5.0
- Appreciation +0.0/10.0
$227,900
🖨 Deal sheet (PDF) 📄 Offer letter ✓ Due diligence
Listing remarks MLS
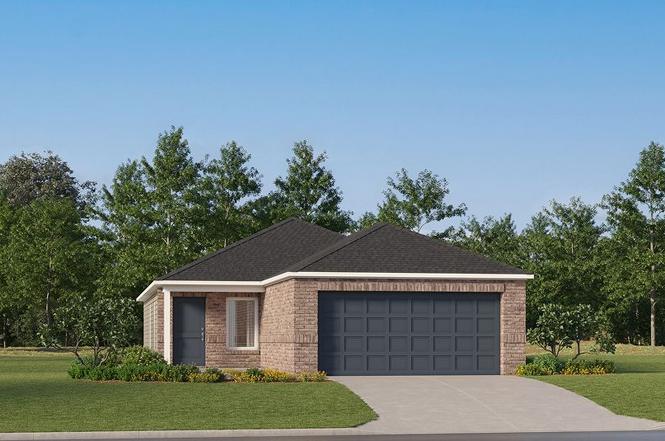
This single-level home showcases a spacious open floorplan shared between the kitchen, dining area and family room for easy entertaining during gatherings. An owner's suite enjoys a private location in a rear corner of the home, complemented by an en-suite bathroom and walk-in closet. There are two secondary bedrooms along the side of the home, which are ideal for household members and hosting overnight guests.
Key facts
- Walk-in closet
- Open floorplan
- Secondary bedrooms
Tags
Property features AI
Finance
- Other: Homestead eligible
- Financial info: Loan qualification available; Not assumable
- HOA & community: Mandatory association with $350 fee; Association fee covers common area maintenance
Exterior
- Parking: Detached 2-car garage
- Utilities: Standard utilities (details not specified)
- Home design: Single-family residence; One-story; New construction; Facing information not provided
- Construction: Brick and frame construction; Shingle roof; Post-tension foundation; Built by Lennar
- Exterior features: Interior lot; No exterior special features listed
Interior
- Bedrooms: Three bedrooms
- Bathrooms: Two full bathrooms
- Interior features: Open living area
Neighborhood map
What this means for you Summary
Snapshot
- This is a 3-bed/2.0-bath single-family listed at $228k. Condition is rated good.
Deal economics
- At list price, monthly cash flow is $-117 ($-1k/yr) — negative.
- To cash-flow at today's rent, offer at most $211k (7.4% below list).
- To meet the 1% rule (rent ≥ 1% of price), the offer needs to be $188k (17.4% below list).
- Recommended offer: $188k (17.4% below list) — sets the bar for 1% rule.
- Cap rate 5.7% vs local median 3.7% in Oklahoma City — top-decile yield for the area; either an underpriced asset or a hidden risk that comps aren't pricing in. Stress-test before assuming the spread holds.
Location & tenants
- Location reads 80/100 on livability (#3 in OK, #1,635 nationally) — a professional / high-income tenant draw. Strengths: amenities A+, commute A+, cost of living A+; Watch: crime F.
- Deer Creek (rural): math 41% / reading 44% proficiency, ranked #4 of 270 in OK (top 2%) — families likely to look elsewhere, expect single-tenant / working-renter base with shorter leases; only 7% free/reduced lunch — higher-income household profile.
- Zoned schools: Rose Union Es (math 72% / reading 52%, grade B, #6 of 845 statewide, top 1%, 606 students, 0% FRL); Deer Creek Ms (math 35% / reading 43%, grade F, #10 of 345 statewide, top 3%, 1,179 students, 0% FRL); Deer Creek Hs (math 39% / reading 51%, grade D-, #13 of 447 statewide, top 3%, 2,036 students, 0% FRL).
- Market conditions: Rents rising (+1.2%/yr); 647 active listings in the ZIP; 28 comparable units currently listed for rent nearby; rentals leasing fast (median 7d on market — plan ~1-2 weeks tenant-placement turnaround); high-income renter base; 5,365 units permitted in Oklahoma County in 2024 (569 in 5+ unit buildings).
- This rent is only 18% of the median local income ($127k/yr) — well below the 30% rent-burden line; pricing power to push rent on renewal without tenant pushback.
Forward outlook
- Local home prices are declining (-3.0%/yr); year-one equity from $2k of loan paydown is wiped out by about $7k of value loss. Plan a longer hold.
- Oklahoma County population projected at +41% by 2050 — long-run rental-demand tailwind backs the buy-and-hold thesis.
Negotiation context
- Only 6 days on market — expect competitive offers; lowballing is unlikely to land.
- 2 sale attempts with the ask held roughly flat each time — persistent listings suggest the price (not the market) is what's stuck; bring a comps-based counter.
Risks & watch-outs
- Climate carrying-cost: extreme-heat days projected 7→19/yr by 2055 (HVAC capex compounding) — expect insurance premiums to compound above CPI over the hold.
Questions for the listing agent
- What do current leases actually rent for vs. the listed asking? Can we see a recent rent roll and the last 12 months of T-12 income?
- What does the HOA fee cover, when was the last increase, and are there any pending special assessments or reserve-fund shortfalls?
- Is there a deadline driving the sale (1031 exchange, divorce, estate, relocation)? That informs how much negotiation room exists.
- Schools are F-rated, which usually means shorter tenancies and higher turnover. Who's the typical renter profile here, and what's been the actual vacancy rate?
- Crime grade is F in this area — have there been break-ins, vandalism, or insurance claims at this property in the last 3 years? What carrier currently insures it and at what premium?
- The area grade is low — what's the realistic commute time and amenity access for the typical tenant pool here? Any planned neighborhood developments (good or bad) we should know about?
- What's the average days-on-market for RENTAL listings here right now (not sales)? A rising rental-DOM trend means longer vacancies and softer asking-rent achievability than the comps imply.
- What's the recent tenant-quality profile in this submarket — average credit score on applications, eviction rate, late-payment / NSF rate, and stable-employment percentage? A property-management company in the area should have these aggregated.
- How much new for-sale + rental construction is in the pipeline within 1–3 miles? Heavy new supply typically softens prices + rents 12–24 months out; constrained supply supports both.
Investment metrics
- 1% rule
- 0.83% ✗
- Cap rate
- 5.68%
- Cash-on-cash
- -2.20%
- DSCR
- 0.90
- GRM
- 10.1
CMA / ARV
- ARV (on-the-fly)
- $251,934
- Comps found
- 12
Show comp detail 12 sales within ~0.75 mi
| Address | Dist | Beds/Ba | Sqft | Sold | Price | $/sf | Match |
|---|---|---|---|---|---|---|---|
| 19641 Ferris Dr | 0.43mi | 3/2.0 | 1,257 (-1%) | 2mo | $261,024 | $208 | 77 |
| 3021 NW 196th Pl | 0.45mi | 3/2.0 | 1,257 (-1%) | 2mo | $261,024 | $208 | 76 |
| 2928 NW 196th Pl | 0.49mi | 3/2.0 | 1,257 (-1%) | 1mo | $263,024 | $209 | 75 |
| 19621 Canning Rd | 0.51mi | 3/2.0 | 1,257 (-1%) | 3mo | $256,284 | $204 | 73 |
| 3016 NW 196th Pl | 0.48mi | 3/2.0 | 1,249 (-1%) | 4mo | $254,400 | $204 | 72 |
| 19629 Ferris Dr | 0.46mi | 3/2.0 | 1,347 (+6%) | 2mo | $268,064 | $199 | 66 |
| 3020 NW 196th Pl | 0.48mi | 3/2.0 | 1,347 (+6%) | 2mo | $268,144 | $199 | 65 |
| 19813 Brunswick Ct | 0.66mi | 3/2.0 | 1,260 (-0%) | 4mo | $222,000 | $176 | 64 |
| 2520 NW 199th St | 0.67mi | 3/2.0 | 1,282 (+1%) | 4mo | $250,000 | $195 | 64 |
| 2920 NW 196th Pl | 0.47mi | 3/2.0 | 1,347 (+6%) | 4mo | $261,200 | $194 | 64 |
| 2508 NW 199th St | 0.69mi | 3/2.0 | 1,360 (+7%) | 5mo | $253,000 | $186 | 52 |
| 19704 Forsythe Dr | 0.64mi | 3/2.0 | 1,453 (+15%) | 4mo | $248,000 | $171 | 42 |
Match score weights: distance 35% · size 25% · config 20% · recency 20%. Top-matched comps best support the ARV.
Projected returns pro-forma
-3.0% appreciation · 1.21% rent growth · sell at horizon
- IRR
- -22.0%
- Equity multiple
- 0.25×
- Total profit
- $-47,678
- Equity at exit
- $33,981
- IRR
- -21.0%
- Equity multiple
- -0.00×
- Total profit
- $-64,123
- Equity at exit
- $19,705
Cash invested: $63,812 (down + closing). Projections, not guarantees.
Landlord ↔ Tenant lean methodology
- Overall (STATE)
- 83 Strongly Landlord-Friendly
- State Oklahoma
- 83 Strongly Landlord-Friendly · R+20
- County
- — inherits STATE
- City
- — inherits STATE
ZIP-level market 73012
- Home prices YoY
- -17.9%
- Rents YoY
- 1.2%
- Active inventory
- 647
- Price-to-rent
- 10.1×
Monthly cashflow live
- Estimated rent
- $1,882 high interval (Pro) →
- Mortgage (P&I)
- −$1,195
- Tax est. 1.5%
- −$285 /mo · $3,418/yr
- Insurance
- −$95
- HOA
- −$29
- Vacancy / Maint / Mgmt
- −$395
- Net cashflow
- $-117
Break-even live
Sensitivity live
| Price | -10% $40 | -5% $-38 | +0% $-117 | +5% $-196 | +10% $-275 |
|---|---|---|---|---|---|
| Rent | -10% $-266 | -5% $-192 | +0% $-117 | +5% $-43 | +10% $31 |
| Rate | -1.0pp $-2 | -0.5pp $-59 | base $-117 | +0.5pp $-176 | +1.0pp $-236 |
UW: 25.0% down · 7.5% · 30yr · 1.5% tax · 5.0% vac · 8.0% maint · 8.0% mgmt
Financing live
Cash to close
- Down payment
- $56,975
- Closing costs
- $6,837
- Reserves months
- —
- Total cash needed
- —
Loan-product check · same deal, 3 products live
Conventional
25% down · 7.5% · 30yr
- Down + closing
- —
- Monthly P&I
- —
- Monthly cashflow
- —
- DSCR
- —
- Eligible?
- —
Personal DTI + credit; lowest rate.
DSCR
20% down · 8.5% · 30yr
- Down + closing
- —
- Monthly P&I
- —
- Monthly cashflow
- —
- DSCR
- —
- Eligible?
- —
No personal income docs; deal must DSCR.
Hard money
10% down · 12.0% · 12mo
- Down + closing
- —
- Monthly P&I
- —
- Monthly cashflow
- —
- DSCR
- —
- Eligible?
- —
Short-term bridge; refi at stabilization.
Rent comps 28 comps
| Address | Beds | Baths | Sqft | Rent | $/sqft | DOM | Units | Dist |
|---|---|---|---|---|---|---|---|---|
| 19804 Canning Ct Edmond, OK | 3.0 | 2.0 | 1875 | $2,595 | $1.38 | 19d | 1 | 0.33mi |
| 19717 Whitley Rd Edmond, OK | 4.0 | 2.0 | 1701 | $1,995 | $1.17 | 19d | 1 | 0.42mi |
| 19629 Ferris Dr Edmond, OK | 3.0 | 2.0 | 1347 | $1,850 | $1.37 | 26d | 1 | 0.44mi |
| 2941 NW 195th St Edmond, OK | 3.0 | 2.0 | 1342 | $1,695 | $1.26 | 6d | 1 | 0.48mi |
| 2945 NW 195th St Edmond, OK | 3.0 | 2.0 | 1253 | $1,650 | $1.32 | 6d | 1 | 0.48mi |
| 19505 Conway Dr Edmond, OK | 3.0 | 2.0 | 1342 | $1,695 | $1.26 | 26d | 1 | 0.50mi |
| 19501 Conway Dr Edmond, OK | 3.0 | 2.0 | 1253 | $1,650 | $1.32 | 6d | 1 | 0.50mi |
| 19521 Conway Dr Edmond, OK | 3.0 | 2.0 | 1253 | $1,650 | $1.32 | 26d | 1 | 0.50mi |
| 19513 Conway Dr Edmond, OK | 3.0 | 2.0 | 1253 | $1,650 | $1.32 | 26d | 1 | 0.50mi |
| 19509 Conway Dr Edmond, OK | 3.0 | 2.0 | 1342 | $1,695 | $1.26 | 6d | 1 | 0.50mi |
| 2925 NW 195th St Edmond, OK | 3.0 | 2.0 | 1342 | $1,695 | $1.26 | 26d | 1 | 0.55mi |
| 2921 NW 195th St Edmond, OK | 3.0 | 2.0 | 1342 | $1,695 | $1.26 | 12d | 1 | 0.55mi |
| 19613 Bolton Rd Edmond, OK | 3.0 | 2.0 | 1340 | $1,795 | $1.34 | 4d | 1 | 0.56mi |
| 19708 Barrister Cir Edmond, OK | 3.0 | 2.0 | 1257 | $1,595 | $1.27 | 4d | 1 | 0.65mi |
| 19704 Taggert Dr Edmond, OK | 3.0 | 2.0 | 1330 | $1,645 | $1.24 | 6d | 1 | 0.74mi |
| 19217 Garden Creek Ln Edmond, OK | 4.0 | 2.0 | 1828 | $2,045 | $1.12 | 12d | 1 | 0.82mi |
| 2800 NW 192nd St Edmond, OK | 1.0–2.0 | 1.0–2.0 | 1118 | $2,280 | $2.04 | 0d | 11 | 0.85mi |
| 19704 Vivace Dr Edmond, OK | 3.0 | 2.0 | 1450 | $1,699 | $1.17 | 4d | 1 | 0.86mi |
| 2364 NW 197th St Edmond, OK | 3.0 | 2.0 | 1250 | $1,595 | $1.28 | 4d | 1 | 0.90mi |
| 2317 NW 198th St Edmond, OK | 3.0 | 2.0 | 1320 | $1,700 | $1.29 | 26d | 1 | 0.95mi |
| 19601 N Pennsylvania Ave Edmond, OK | 3.0 | 2.5 | 1441 | $1,745 | $1.21 | 4d | 1 | 1.21mi |
| 19501 N Pennsylvania Ave Edmond, OK | 2.0–3.0 | 1.0–2.0 | 1122 | $1,750 | $1.56 | 0d | 13 | 1.23mi |
| 3005 NW 183rd St Edmond, OK | 3.0 | 2.0 | 1320 | $1,650 | $1.25 | 4d | 1 | 1.30mi |
| 2145 Scissortail Landing Dr Edmond, OK | 4.0 | 2.0 | 1800 | $1,795 | $1.00 | 0d | 1 | 1.32mi |
| 18613 Vivo Dr Edmond, OK | 3.0 | 2.0 | 1682 | $1,995 | $1.19 | 21d | 1 | 1.32mi |
| 2344 Roca Dr Edmond, OK | 3.0 | 2.0 | 1213 | $1,650 | $1.36 | 14d | 1 | 1.37mi |
| 18509 Agua Dr Edmond, OK | 3.0 | 2.0 | 1595 | $1,725 | $1.08 | 0d | 1 | 1.39mi |
| 18321 Groveton Blvd Edmond, OK | 3.0 | 2.0 | 1739 | $2,200 | $1.27 | 19d | 1 | 1.42mi |
HOA detail
- Monthly dues
- $29 · $348/yr
Listing history 5 events
-
2026-06-21days on market $227,900 Active 6 DOM
-
2026-06-18days on market $227,900 Active 3 DOM
-
2026-06-17days on market $227,900 Active 2 DOM
-
2026-06-15remarks 530-char remark
Show marketing remark (414 chars)
This single-level home showcases a spacious open floorplan shared between the kitchen, dining area and family room for easy entertaining during gatherings. An owner's suite enjoys a private location in a rear corner of the home, complemented by an en-suite bathroom and walk-in closet. There are two secondary bedrooms along the side of the home, which are ideal for household members and hosting overnight guests.
-
2026-06-15$227,900 Active 1 DOM
Show marketing remark (414 chars)
This single-level home showcases a spacious open floorplan shared between the kitchen, dining area and family room for easy entertaining during gatherings. An owner's suite enjoys a private location in a rear corner of the home, complemented by an en-suite bathroom and walk-in closet. There are two secondary bedrooms along the side of the home, which are ideal for household members and hosting overnight guests.
ⓘ Source: listings_history table (triggers on properties + properties_extension) + one-shot
backfill from property_details.listing_events for pre-trigger history.
Climate risk First Street
- Flood 1/10 Low FEMA zone X (unshaded) · 0% chance over 30 yrs
- Wildfire 4/10 Moderate
- Heat 6/10 Major 7 d/yr ≥108°F today · 19 d/yr by 30 yrs out
- Wind 2/10 Low 4% chance of damaging wind over 30 yrs
- Air quality 2/10 Low 1 unhealthy d/yr today · 1 by 30 yrs out
Nearby sold comps map
Loading sold comps map…
Walkable amenities ~0.75 mi
Loading nearby amenities…
Taxation est. · year 1
- Rental income
- $22,584
- − Mortgage interest
- −$12,766
- − Property taxes
- −$3,418
- − Insurance
- −$1,140
- − Repairs & maintenance
- −$1,807
- − Management
- −$1,807
- − HOA
- −$348
- − Depreciation
- −$6,630
- Taxable loss
- −$5,331
- Est. tax savings @ 24.0%
- +$1,280
- After-tax cash flow
- $-127/yr
For passive investors: Depreciation is non-cash, so a rental often shows a tax loss while cash-flowing — sheltering income. Rental losses are passive: they offset passive income freely, and up to $25,000/yr can offset ordinary (W-2) income if you actively participate and your MAGI is under $100k (phasing out to $0 by $150k); unused losses carry forward. On sale, claimed depreciation is recaptured at up to 25%, and gains may owe capital-gains tax (a 1031 exchange can defer both). Figures are a year-1 estimate at your 24.0% rate — not tax advice; consult a CPA.
Condition & rehab AI · 12 photos
This single-level home is in good condition with a modern and well-maintained interior and exterior. It is move-in ready with minor cosmetic updates that can significantly increase its value.
Value-add opportunities
- Both Paint exterior trim — Enhances curb appeal and can increase both resale and rental value.
- Both Clean gutters — Improves drainage and can prevent water damage, increasing both resale and rental value.
Renovation cost estimate screening
Value-add ROI direction
- Both Paint exterior trim — Enhances curb appeal and can increase both resale and rental value. ↑
- Both Clean gutters — Improves drainage and can prevent water damage, increasing both resale and rental value. ↑
ⓘ Cost ranges are severity-bucket heuristics (US national rule-of-thumb). Get contractor quotes + a written scope before underwriting a rehab budget.
Schools (NCES district)
- District
- Deer Creek
- NCES district ID
- 4009570
- Math proficiency
- 41% ▼ -16.00%
- Reading proficiency
- 44% ▼ -14.00%
- Median HH income
- $101,218
- Composite
- 41.46/100
- National rank
- #3465
- State rank
- #4 of 270 in OK
Livability — Oklahoma City
- Score
- 80/100
- State rank
- #3
- US rank
- #1635
Category grades
Schools grade is shown separately in the Schools card above.
Census & demographics
- County
- Oklahoma County · 771,644 people
- City population
- 498,656
- Metro
- Oklahoma City, OK
- Population (ZIP)
- 46,993
- Household income
- $126,659
- Rent vs Own
- Severe rent burden
- 898.0
Population outlook (Oklahoma County) Hauer SSP2
- Today (2025)
- 911,875 people
- By 2030
- 982,413 · +7.7%
- By 2040
- 1,130,468 · +24.0%
- By 2050
- 1,288,422 · +41.3%
- By 2075
- 1,711,482 · +87.7%
- By 2100
- 2,088,448 · +129.0%
Race, ethnicity, and origin ACS 2023
- Neighborhood character
- Predominantly White (67%)
- Race & ethnicity
- White 67% Two or more races 10% Black 8% Asian 8% Hispanic / Latino 8% Native American 2%
- Hispanic origin (detail)
- Mexican 5%
- Common ancestry
- Italian 3% Slovak 2% Romanian 2%
- Foreign-born
- 11% · Canada, China, Vietnam
- Languages at home
- 86% English-only · Spanish 4% Other Indo-European 2% Chinese 2%
Political lean MEDSL · Oklahoma
- 2024 margin
- Toss-up / Even · D 48.0% · R 49.7% · Other 2.3%
- 2008→2024 swing
- +15.1pp toward D · 2008: -16.8pp · 2024: -1.7pp
- All cycles
- 2024: R+1.7 2020: R+1.1 2016: R+10.5 2012: R+16.7 2008: R+16.8
Not yet ingested
- Civics
- —
Market trends
- HPI YoY
- ▼ -44.41%
- Current HPI
- 203.1105
- Rent YoY
- ▲ 1.21%
- Metro
- Oklahoma City, OK
- State GDP YoY
- ▲ 1.55%
- F500 in state
- 6
Industry mix (Fortune 500 HQ in OK)
| Industry | F500 HQs | Revenue |
|---|---|---|
| Energy | 3 | $48B |
|
||
Price history
+0.0% since first listed2 events — show timeline
- 2026-06-15 Listed $227,900 Zillow
- 2026-06-15 Listed $227,900 MLSOK
Cash-flow waterfall
monthlySold comps — $/sqft
last 12 mo · ≤1 miLoading sold comps…