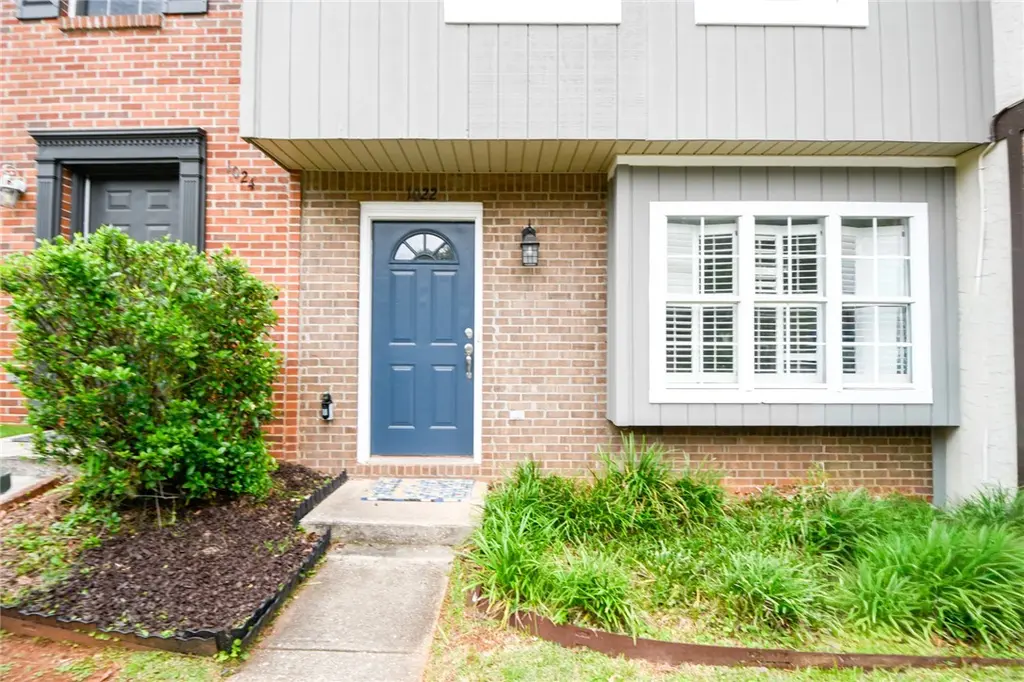
1022 Chinook St · Auburn, AL
Flood risk 1/10 · Minimal
- FEMA flood zone
- X (unshaded)
- Chance of flooding over 30 yrs
- 0.0%
- Est. flood insurance / yr
- $507 – $1,088
Fire risk 3/10 · Minor
- Est. fire insurance / yr
- $916 – $1,700
Heat risk 6/10 · Moderate
- Hot days now (above 104°F)
- 7 days/yr
- Hot days in 30 yrs
- 20 days/yr
Wind risk 6/10 · Moderate
- Chance of severe wind over 30 yrs
- 67.0%
Air-quality risk 2/10 · Minimal
- Unhealthy air days now
- 1 days/yr
- Unhealthy air days in 30 yrs
- 1 days/yr
Risk factors via First Street. Map © Google.
Why this score? — see what drove the D+ grade
The composite is a weighted blend of 9 inputs, each scored 0–100. Each bar is that input's sub-score; the figure is the points it added to the 100-point composite (weight × sub-score).
- ARV discount +15.0/15.0
- Cash flow +10.9/30.0
- Schools +5.0/10.0
- Livability +4.0/5.0
- Rent growth +3.8/5.0
- DSCR +3.1/10.0
- Condition / age +2.5/5.0
- 1% rule +2.3/10.0
- Appreciation +0.0/10.0
$225,000
🖨 Deal sheet (PDF) 📄 Offer letter ✓ Due diligence
Listing remarks
Updated and totally refurbished unit inside and out! Light interior colors in flooring and paint give this unit a fresh and inviting feeling! All new appliances; light fixtures and fans; flooring; paint; plumbing fixtures. HVAC 2019; roof 2019; hot water heater 2023. Convenient location and move-in ready.
Key facts
- Refurbished unit
- New fans
- New flooring
Tags
Property features AI
Finance
- Other: Subdivision: Shelton Park; Directions: From N Dean Rd. (in office park area) turn onto Twin Forks Rd. Go one block turn right onto Chinook. 1022 is in 2nd building on your right.
- HOA & community: No association amenities listed
Exterior
- Utilities: Electricity available; Water available
- Home design: Residential townhouse; Attached property; Two levels; Built by Shelton Woods Construction/Col Pick
- Construction: Brick, clapboard, and vinyl siding exterior; Slab foundation
- Exterior features: Rear covered porch; Privacy fencing; Exterior storage
Interior
- Kitchen: Cooktop; Electric range; Dishwasher; Microwave; Refrigerator; Eat-in kitchen
- Bedrooms: Total rooms: 4
- Flooring: Carpet; Simulated wood
- Bathrooms: 1 full bathroom; 1 half bathroom
- Heating & cooling: Central air conditioning (electric); Ceiling fans; Electric heating
- Interior features: Ceiling fans; Eat-in kitchen; Window treatments; Storage
- Laundry & utility: Washer; Dryer
Neighborhood map
What this means for you Summary
Snapshot
- This is a 2-bed/1.5-bath townhouse listed at $225k.
Deal economics
- At list price, monthly cash flow is $-101 ($-1k/yr) — negative.
- To cash-flow at today's rent, offer at most $207k (7.9% below list).
- To meet the 1% rule (rent ≥ 1% of price), the offer needs to be $164k (27.0% below list).
- Recommended offer: $164k (27.0% below list) — sets the bar for 1% rule.
- Cap rate 5.8% vs local median 2.7% in Auburn — top-decile yield for the area; either an underpriced asset or a hidden risk that comps aren't pricing in. Stress-test before assuming the spread holds.
Location & tenants
- Location reads 80/100 on livability (#6 in AL, #1,842 nationally) — a professional / high-income tenant draw. Strengths: crime A+, amenities A+, health & safety A+; Watch: commute F.
- Auburn City (urban): math 51% / reading 69% proficiency, ranked #7 of 129 in AL (top 5%) — acceptable for families but not a draw, mixed tenant base, ~2y average lease.
- Market conditions: Rents rising fast (+5.4%/yr); 907 active listings in the ZIP; 19 comparable units currently listed for rent nearby; rentals at typical pace (median 22d on market — plan ~3-4 weeks tenant-placement turnaround); 47% of comp listings sitting > 30 days — soft ceiling on asking rent; 1,858 units permitted in Lee County in 2024 (113 in 5+ unit buildings).
Forward outlook
- Local home prices are declining (-3.0%/yr); year-one equity from $2k of loan paydown is wiped out by about $7k of value loss. Plan a longer hold.
- Lee County population projected at +54% by 2050 — long-run rental-demand tailwind backs the buy-and-hold thesis.
Negotiation context
- It's been on market 18 days — a 2% lower offer ($222k) is reasonable based on typical stale-listing flexibility.
- 3 sale attempts since 2y ago with the ask held roughly flat each time — persistent listings suggest the price (not the market) is what's stuck; bring a comps-based counter.
Risks & watch-outs
- Climate carrying-cost: major wind risk, 67% chance of damaging wind over 30y; extreme-heat days projected 7→20/yr by 2055 (HVAC capex compounding) — expect insurance premiums to compound above CPI over the hold.
Questions for the listing agent
- What do current leases actually rent for vs. the listed asking? Can we see a recent rent roll and the last 12 months of T-12 income?
- Is there a deadline driving the sale (1031 exchange, divorce, estate, relocation)? That informs how much negotiation room exists.
- Schools are A-rated — typically a magnet for longer-tenancy family renters. What's the average tenant stay here, and is there a school-zone premium baked into asking?
- The area grade is low — what's the realistic commute time and amenity access for the typical tenant pool here? Any planned neighborhood developments (good or bad) we should know about?
- What's the average days-on-market for RENTAL listings here right now (not sales)? A rising rental-DOM trend means longer vacancies and softer asking-rent achievability than the comps imply.
- What's the recent tenant-quality profile in this submarket — average credit score on applications, eviction rate, late-payment / NSF rate, and stable-employment percentage? A property-management company in the area should have these aggregated.
- How much new for-sale + rental construction is in the pipeline within 1–3 miles? Heavy new supply typically softens prices + rents 12–24 months out; constrained supply supports both.
Investment metrics
- 1% rule
- 0.73% ✗
- Cap rate
- 5.76%
- Cash-on-cash
- -1.92%
- DSCR
- 0.91
- GRM
- 11.4
CMA / ARV
- ARV (on-the-fly)
- $280,364
- Comps found
- 12
Show comp detail 12 sales within ~0.75 mi
| Address | Dist | Beds/Ba | Sqft | Sold | Price | $/sf | Match |
|---|---|---|---|---|---|---|---|
| 1024 Chinook St | 0.00mi | 2/1.5 | 1,080 (+2%) | 13mo | $218,000 | $202 | 85 |
| 1106 Chinook St | 0.10mi | 2/1.5 | 1,150 (+9%) | 4mo | $225,000 | $196 | 77 |
| 650 Dekalb St #3213 | 0.64mi | 2/2.5 | 1,072 (+2%) | 3mo | $285,000 | $266 | 61 |
| 849 Choctaw Ave | 0.19mi | 2/1.5 | 1,190 (+13%) | 12mo | $180,500 | $152 | 59 |
| 650 Dekalb St #3222 | 0.63mi | 2/2.5 | 1,072 (+2%) | 6mo | $275,000 | $257 | 58 |
| 650 Dekalb St #2215 | 0.67mi | 2/2.5 | 1,072 (+2%) | 6mo | $285,000 | $266 | 57 |
| 650 Dekalb St #1066 | 0.53mi | 1/1.5 (-1) | 968 (-8%) | 3mo | $279,900 | $289 | 54 |
| 650 Dekalb St #2213 | 0.66mi | 2/2.5 | 1,072 (+2%) | 10mo | $289,500 | $270 | 54 |
| 650 Dekalb St #2201 | 0.63mi | 2/2.5 | 1,072 (+2%) | 13mo | $280,000 | $261 | 53 |
| 650 Dekalb St #2209 | 0.65mi | 2/2.5 | 1,072 (+2%) | 14mo | $295,000 | $275 | 51 |
| 805 Harvard Dr Unit 7B | 0.42mi | 2/2.5 | 1,174 (+11%) | 9mo | $222,500 | $190 | 50 |
| 650 Dekalb St #3109 | 0.64mi | 3/3.0 (+1) | 1,183 (+12%) | 13mo | $360,000 | $304 | 28 |
Match score weights: distance 35% · size 25% · config 20% · recency 20%. Top-matched comps best support the ARV.
Projected returns pro-forma
-3.0% appreciation · 5.36% rent growth · sell at horizon
- IRR
- -17.2%
- Equity multiple
- 0.38×
- Total profit
- $-38,956
- Equity at exit
- $33,548
- IRR
- -5.7%
- Equity multiple
- 0.60×
- Total profit
- $-25,281
- Equity at exit
- $19,454
Cash invested: $63,000 (down + closing). Projections, not guarantees.
Landlord ↔ Tenant lean methodology
- Overall (STATE)
- 90 Strongly Landlord-Friendly
- State Alabama
- 90 Strongly Landlord-Friendly · R+15
- County
- — inherits STATE
- City
- — inherits STATE
ZIP-level market 36830
- Rents YoY
- 5.4%
- Active inventory
- 907
- Price-to-rent
- 11.4×
Monthly cashflow live
- Estimated rent
- $1,643 high interval (Pro) →
- Mortgage (P&I)
- −$1,180
- Tax from tax record
- −$125 /mo · $1,498/yr
- Insurance
- −$94
- HOA
- −$0
- Vacancy / Maint / Mgmt
- −$345
- Net cashflow
- $-101
Break-even live
Sensitivity live
| Price | -10% $27 | -5% $-37 | +0% $-101 | +5% $-164 | +10% $-228 |
|---|---|---|---|---|---|
| Rent | -10% $-231 | -5% $-166 | +0% $-101 | +5% $-36 | +10% $29 |
| Rate | -1.0pp $13 | -0.5pp $-44 | base $-101 | +0.5pp $-159 | +1.0pp $-218 |
UW: 25.0% down · 7.5% · 30yr · 1.5% tax · 5.0% vac · 8.0% maint · 8.0% mgmt
Financing live
Cash to close
- Down payment
- $56,250
- Closing costs
- $6,750
- Reserves months
- —
- Total cash needed
- —
Loan-product check · same deal, 3 products live
Conventional
25% down · 7.5% · 30yr
- Down + closing
- —
- Monthly P&I
- —
- Monthly cashflow
- —
- DSCR
- —
- Eligible?
- —
Personal DTI + credit; lowest rate.
DSCR
20% down · 8.5% · 30yr
- Down + closing
- —
- Monthly P&I
- —
- Monthly cashflow
- —
- DSCR
- —
- Eligible?
- —
No personal income docs; deal must DSCR.
Hard money
10% down · 12.0% · 12mo
- Down + closing
- —
- Monthly P&I
- —
- Monthly cashflow
- —
- DSCR
- —
- Eligible?
- —
Short-term bridge; refi at stabilization.
Rent comps 19 comps
| Address | Beds | Baths | Sqft | Rent | $/sqft | DOM | Units | Dist |
|---|---|---|---|---|---|---|---|---|
| 846 Choctaw Ave Auburn, AL | 3.0 | 2.0 | 1158 | $1,600 | $1.38 | 45d | 1 | 0.15mi |
| 807 Harvard Dr Auburn, AL | 2.0 | 2.5 | 1273 | $1,600 | $1.26 | 45d | 1 | 0.39mi |
| 650 DeKalb St Auburn, AL | 2.0–3.0 | 2.5–3.0 | 1326 | $2,000 | $1.51 | 45d | 1 | 0.53mi |
| 555 N Dean Rd Auburn, AL | 1.0–2.0 | 1.0–2.0 | 895 | $1,495 | $1.67 | 22d | 1 | 0.59mi |
| 555 N Dean Rd Auburn, AL | 2.0 | 2.0 | 1235 | $1,625 | $1.32 | 45d | 1 | 0.59mi |
| 2260 E University Dr Auburn, AL | 1.0–2.0 | 1.0–2.0 | 777 | $1,264 | $1.63 | 14d | 8 | 0.64mi |
| 675 Nissa Ct Auburn, AL | 3.0 | 3.0 | 1500 | $1,850 | $1.23 | 45d | 1 | 0.74mi |
| 640 N Ross St Auburn, AL | 1.0–3.0 | 1.0–3.0 | 927 | $1,388 | $1.50 | 14d | 1 | 0.84mi |
| 420 N Dean Rd Auburn, AL | 1.0–3.0 | 1.0–2.0 | 840 | $1,310 | $1.56 | 14d | 1 | 0.84mi |
| 1365 Gatewood Dr Unit W-302 Auburn, AL | 2.0 | 1.0 | 977 | $1,650 | $1.69 | 14d | 1 | 0.92mi |
| 374 Cherry St Auburn, AL | 3.0 | 2.0 | 1460 | $2,400 | $1.64 | 22d | 1 | 0.92mi |
| 601 N Gay St Auburn, AL | 2.0 | 2.0 | 1150 | $1,700 | $1.48 | 45d | 1 | 1.11mi |
| 427 Harper Ave Auburn, AL | 2.0 | 2.0 | 1136 | $1,400 | $1.23 | 45d | 1 | 1.18mi |
| 535 Heritage Ct Auburn, AL | 2.0 | 3.0 | 1150 | $3,500 | $3.04 | 45d | 1 | 1.21mi |
| 507 E Glenn Ave Auburn, AL | 2.0 | 1.0 | 876 | $1,250 | $1.43 | 14d | 1 | 1.28mi |
| 516 E Glenn Ave Auburn, AL | 1.0–2.0 | 1.0–2.0 | 775 | $1,495 | $1.93 | 14d | 1 | 1.32mi |
| Ross Park 3/3 Duplex Auburn, AL | 3.0 | 3.0 | 1448 | $1,762 | $1.22 | 14d | 3 | 1.37mi |
| 106 Oak St Unit 106 Auburn, AL | 3.0 | 2.0 | 1298 | $1,350 | $1.04 | 22d | 1 | 1.42mi |
| Ross Park 3/3 TH Auburn, AL | 3.0 | 3.0 | 1495 | $1,575 | $1.05 | 45d | 1 | 1.46mi |
Listing history 13 events
-
2026-06-21days on market $225,000 Active 18 DOM
-
2026-06-18days on market $225,000 Active 15 DOM
-
2026-06-17days on market $225,000 Active 14 DOM
-
2026-06-16days on market $225,000 Active 13 DOM
-
2026-06-15days on market $225,000 Active 12 DOM
-
2026-06-14days on market $225,000 Active 10 DOM
-
2026-06-13days on market $225,000 Active 9 DOM
-
2026-06-10days on market $225,000 Active 7 DOM
-
2026-06-09days on market $225,000 Active 6 DOM
-
2026-06-08days on market $225,000 Active 5 DOM
-
2026-06-07days on market $225,000 Active 4 DOM
-
2026-06-03remarks 307-char remark
-
2026-06-03$225,000 Active 1 DOM
ⓘ Source: listings_history table (triggers on properties + properties_extension) + one-shot
backfill from property_details.listing_events for pre-trigger history.
Tax reassessment forecast AL · Resets to sale price
- Current annual tax
- $1,498 · $125/mo
- Projected year-2 tax
- $1,498 · $125/mo
- Expected delta
- $0/yr ($0/mo · 0.0%)
ⓘ Screening estimate from a state-policy table — verify with the county assessor before closing.
Climate risk First Street
- Flood 1/10 Low FEMA zone X (unshaded) · 0% chance over 30 yrs
- Wildfire 3/10 Moderate
- Heat 6/10 Major 7 d/yr ≥104°F today · 20 d/yr by 30 yrs out
- Wind 6/10 Major 67% chance of damaging wind over 30 yrs
- Air quality 2/10 Low 1 unhealthy d/yr today · 1 by 30 yrs out
Nearby sold comps map
Loading sold comps map…
Walkable amenities ~0.75 mi
Loading nearby amenities…
Taxation est. · year 1
- Rental income
- $19,713
- − Mortgage interest
- −$12,603
- − Property taxes
- −$1,498
- − Insurance
- −$1,125
- − Repairs & maintenance
- −$1,577
- − Management
- −$1,577
- − Depreciation
- −$6,545
- Taxable loss
- −$5,213
- Est. tax savings @ 24.0%
- +$1,251
- After-tax cash flow
- $42/yr
For passive investors: Depreciation is non-cash, so a rental often shows a tax loss while cash-flowing — sheltering income. Rental losses are passive: they offset passive income freely, and up to $25,000/yr can offset ordinary (W-2) income if you actively participate and your MAGI is under $100k (phasing out to $0 by $150k); unused losses carry forward. On sale, claimed depreciation is recaptured at up to 25%, and gains may owe capital-gains tax (a 1031 exchange can defer both). Figures are a year-1 estimate at your 24.0% rate — not tax advice; consult a CPA.
Schools (NCES district)
- District
- Auburn City
- NCES district ID
- 0100210
- Math proficiency
- 51% ▼ -21.00%
- Reading proficiency
- 69% ▲ 5.00%
- Median HH income
- $38,126
- Composite
- 49.87/100
- National rank
- #1944
- State rank
- #7 of 129 in AL
Livability — Auburn
- Score
- 80/100
- State rank
- #6
- US rank
- #1842
Category grades
Schools grade is shown separately in the Schools card above.
Census & demographics
- Census place
- Auburn, AL
- County
- Lee County · 144,175 people
- City population
- 80,251
- Metro
- Auburn-Opelika, AL
- Population (ZIP)
- 49,292
- Household income
- $70,188
- Rent vs Own
- Severe rent burden
- 2961.0
Population outlook (Lee County) Hauer SSP2
- Today (2025)
- 196,440 people
- By 2030
- 217,417 · +10.7%
- By 2040
- 259,467 · +32.1%
- By 2050
- 301,557 · +53.5%
- By 2075
- 402,186 · +104.7%
- By 2100
- 474,503 · +141.6%
Race, ethnicity, and origin ACS 2023
- Neighborhood character
- Predominantly White (70%)
- Race & ethnicity
- White 70% Black 14% Asian 10% Hispanic / Latino 4% Two or more races 3%
- Common ancestry
- Slovak 4% Italian 3% Serbian 2%
- Foreign-born
- 11% · South Korea, Canada, China
- Languages at home
- 87% English-only · Korean 4% Spanish 3% Chinese 2%
Political lean MEDSL · Lee
- 2024 margin
- Strong R (+27.8) · D 35.5% · R 63.3% · Other 1.2%
- 2008→2024 swing
- -8.1pp toward R · 2008: -19.8pp · 2024: -27.8pp
- All cycles
- 2024: R+27.8 2020: R+20.1 2016: R+23.1 2012: R+19.9 2008: R+19.8
Not yet ingested
- Civics
- —
Market trends
- HPI YoY
- ▼ -156.53%
- Current HPI
- 270.6646
- Rent YoY
- ▲ 5.36%
- Metro
- Auburn-Opelika, AL
- State GDP YoY
- ▲ 2.94%
- F500 in state
- 4
Industry mix (Fortune 500 HQ in AL)
| Industry | F500 HQs | Revenue |
|---|---|---|
| Financial Services | 1 | $8B |
|
||
| Healthcare | 1 | $5B |
|
||
Price history
+18650.0% since first listed7 events — show timeline
- 2026-06-03 Listed $225,000 LCMLS
- 2024-06-09 Rental Removed $1,200 APPFOLIO
- 2024-04-12 Listed for Rent $1,200 APPFOLIO
- 2024-04-10 Rental Removed $1,200 APPFOLIO
- 2024-04-06 Listed for Rent $1,200 APPFOLIO
- 2023-07-11 Rental Removed — APPFOLIO
- 2022-11-15 Rental Removed — APPFOLIO
Property tax history
+5.5%/yrLatest (2025): $1,498 · +0.0% YoY. Source: county tax records.
Cash-flow waterfall
monthlySold comps — $/sqft
last 12 mo · ≤1 miLoading sold comps…