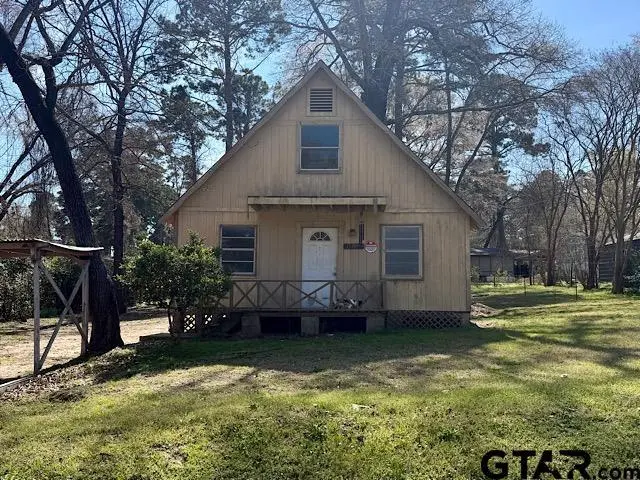
17159 County Road 1182 · Emerald Bay, TX
Flood risk 1/10 · Minimal
- FEMA flood zone
- X (unshaded)
- Chance of flooding over 30 yrs
- 0.0%
- Est. flood insurance / yr
- $507 – $1,088
Fire risk 3/10 · Minor
- Est. fire insurance / yr
- $1,222 – $2,270
Heat risk 7/10 · Major
- Hot days now (above 109°F)
- 7 days/yr
- Hot days in 30 yrs
- 26 days/yr
Wind risk 6/10 · Moderate
- Chance of severe wind over 30 yrs
- 68.0%
Air-quality risk 1/10 · Minimal
- Unhealthy air days now
- 0 days/yr
- Unhealthy air days in 30 yrs
- 0 days/yr
Risk factors via First Street. Map © Google.
Why this score? — see what drove the B+ grade
The composite is a weighted blend of 9 inputs, each scored 0–100. Each bar is that input's sub-score; the figure is the points it added to the 100-point composite (weight × sub-score).
- Cash flow +30.0/30.0
- ARV discount +15.0/15.0
- 1% rule +10.0/10.0
- DSCR +10.0/10.0
- Schools +5.4/10.0
- Livability +3.6/5.0
- Rent growth +2.5/5.0
- Condition / age +2.5/5.0
- Appreciation +0.0/10.0
$105,000
🖨 Deal sheet (PDF) 📄 Offer letter ✓ Due diligence
Listing remarks MLS
If you’ve been waiting for the right investment opportunity in Flint, this is it! Nestled in the highly sought-after Bullard Independent School District, this property sits in a strong location with long-term upside and steady demand. Whether you’re looking to flip, renovate and hold, or build sweat equity, this one has the bones and the potential to make it worth your time. With the right vision and updates, this property could transform into a standout home in an area buyers consistently look for. The lot offers space and privacy you don’t always find in more crowded subdivisions, while still keeping you close to the conveniences of Flint and South Tyler. The foundation for value is already here. The rest is strategy and execution. Opportunities like this don’t sit forever in desirable school zones and growing areas. For the investor who sees beyond current condition and into future potential, this is the kind of project that makes sense. Bring your contractor. Bring your vision. Bring your calculator. This one has “before and after” written all over it. Book an appointment today to view this amazing home!
Key facts
- Strong location
- Space and privacy
- Built 1983
Tags
Neighborhood map
What this means for you Summary
Snapshot
- This is a 3-bed/1.0-bath single-family listed at $105k.
Deal economics
- At list price, monthly cash flow is $837 ($10k/yr) — positive.
- The deal already cash-flows at list — no discount required.
- Meets the 1% rule at list price ($2k rent vs $105k).
- Recommended offer: $96k (9.0% below list) — sets the bar for market timing.
- Cap rate 15.9% vs local median 2.9% in Emerald Bay — top-decile yield for the area; either an underpriced asset or a hidden risk that comps aren't pricing in. Stress-test before assuming the spread holds.
Location & tenants
- Location reads 71/100 on livability (#293 in TX) — a middle-class / working-renter tenant base. Strengths: crime A+, housing A+, employment A; Watch: amenities F, commute F, health & safety D-.
- Bullard ISD (rural): math 65% / reading 60% proficiency, ranked #48 of 826 in TX (top 6%) — acceptable for families but not a draw, mixed tenant base, ~2y average lease.
- Market conditions: 354 active listings in the ZIP; 2 comparable units currently listed for rent nearby; solid renter incomes; 595 units permitted in Smith County in 2024 (45 in 5+ unit buildings).
Forward outlook
- Local home prices are declining (-3.0%/yr); year-one equity from $726 of loan paydown is wiped out by about $3k of value loss. Plan a longer hold.
- Smith County population projected at +24% by 2050 — long-run rental-demand tailwind backs the buy-and-hold thesis.
- At projected returns (-3.0% appreciation + 3.0% rent growth), your $29k cash investment doubles in ~4 years — after that, you're playing with house money.
Negotiation context
- It's been on market 105 days — a 9% lower offer ($96k) is reasonable based on typical stale-listing flexibility.
Risks & watch-outs
- Climate carrying-cost: major wind risk, 68% chance of damaging wind over 30y; extreme-heat days projected 7→26/yr by 2055 (HVAC capex compounding) — expect insurance premiums to compound above CPI over the hold.
Questions for the listing agent
- It's been on market 105 days. Have you received any prior offers? Is the seller open to a 9% concession, seller financing, or rate buy-down credit?
- Why hasn't it sold? Are there any deal-killer items the seller is aware of (foundation, flood, title, zoning, code violations)?
- Is there a deadline driving the sale (1031 exchange, divorce, estate, relocation)? That informs how much negotiation room exists.
- What's the average days-on-market for RENTAL listings here right now (not sales)? A rising rental-DOM trend means longer vacancies and softer asking-rent achievability than the comps imply.
- What's the recent tenant-quality profile in this submarket — average credit score on applications, eviction rate, late-payment / NSF rate, and stable-employment percentage? A property-management company in the area should have these aggregated.
- How much new for-sale + rental construction is in the pipeline within 1–3 miles? Heavy new supply typically softens prices + rents 12–24 months out; constrained supply supports both.
Investment metrics
- 1% rule
- 1.78% ✓
- Cap rate
- 15.86%
- Cash-on-cash
- 34.18%
- DSCR
- 2.52
- GRM
- 4.7
CMA / ARV
- ARV (median comp)
- $145,000
- List price
- $105,000
- Delta
- -27.59%
- Verdict
- UNDERPRICED
- Comps
- 1 within 2.0 mi
Show comp detail 1 sale within ~0.75 mi
| Address | Dist | Beds/Ba | Sqft | Sold | Price | $/sf | Match |
|---|---|---|---|---|---|---|---|
| 22797 Creekwood Dr | 0.60mi | 2/1.0 (-1) | 768 (-11%) | 3mo | $145,000 | $189 | 46 |
Match score weights: distance 35% · size 25% · config 20% · recency 20%. Top-matched comps best support the ARV.
Projected returns pro-forma
-3.0% appreciation · 3.0% rent growth · sell at horizon
- IRR
- 29.6%
- Equity multiple
- 2.23×
- Total profit
- $36,297
- Equity at exit
- $15,656
- IRR
- 36.9%
- Equity multiple
- 4.41×
- Total profit
- $100,190
- Equity at exit
- $9,078
Cash invested: $29,400 (down + closing). Projections, not guarantees.
Landlord ↔ Tenant lean methodology
- Overall (STATE)
- 87 Strongly Landlord-Friendly
- State Texas
- 87 Strongly Landlord-Friendly · R+5
- County
- — inherits STATE
- City
- — inherits STATE
ZIP-level market 75762
- Home prices YoY
- -28.4%
- Active inventory
- 354
- Price-to-rent
- 4.7×
Monthly cashflow live
- Estimated rent
- $1,872 medium interval (Pro) →
- Mortgage (P&I)
- −$551
- Tax from tax record
- −$47 /mo · $565/yr
- Insurance
- −$44
- HOA
- −$0
- Vacancy / Maint / Mgmt
- −$393
- Net cashflow
- $837
Break-even live
Sensitivity live
| Price | -10% $897 | -5% $867 | +0% $837 | +5% $808 | +10% $778 |
|---|---|---|---|---|---|
| Rent | -10% $690 | -5% $763 | +0% $837 | +5% $911 | +10% $985 |
| Rate | -1.0pp $890 | -0.5pp $864 | base $837 | +0.5pp $810 | +1.0pp $783 |
UW: 25.0% down · 7.5% · 30yr · 1.5% tax · 5.0% vac · 8.0% maint · 8.0% mgmt
Financing live
Cash to close
- Down payment
- $26,250
- Closing costs
- $3,150
- Reserves months
- —
- Total cash needed
- —
Loan-product check · same deal, 3 products live
Conventional
25% down · 7.5% · 30yr
- Down + closing
- —
- Monthly P&I
- —
- Monthly cashflow
- —
- DSCR
- —
- Eligible?
- —
Personal DTI + credit; lowest rate.
DSCR
20% down · 8.5% · 30yr
- Down + closing
- —
- Monthly P&I
- —
- Monthly cashflow
- —
- DSCR
- —
- Eligible?
- —
No personal income docs; deal must DSCR.
Hard money
10% down · 12.0% · 12mo
- Down + closing
- —
- Monthly P&I
- —
- Monthly cashflow
- —
- DSCR
- —
- Eligible?
- —
Short-term bridge; refi at stabilization.
Rent comps 2 comps
| Address | Beds | Baths | Sqft | Rent | $/sqft | DOM | Units | Dist |
|---|---|---|---|---|---|---|---|---|
| 22712 Creekwood Dr Flint, TX | 2.0 | 1.0 | 992 | $1,500 | $1.51 | 14d | 1 | 0.46mi |
| 20973 Lakeview Dr Flint, TX | 2.0 | 1.0 | 900 | $1,325 | $1.47 | 14d | 1 | 1.27mi |
Listing history 20 events
-
2026-06-19days on market $105,000 Active 105 DOM
-
2026-06-18days on market $105,000 Active 104 DOM
-
2026-06-17days on market $105,000 Active 103 DOM
-
2026-06-16days on market $105,000 Active 102 DOM
-
2026-06-15days on market $105,000 Active 101 DOM
-
2026-06-14days on market $105,000 Active 99 DOM
-
2026-06-13days on market $105,000 Active 98 DOM
-
2026-06-10days on market $105,000 Active 96 DOM
-
2026-06-09days on market $105,000 Active 95 DOM
-
2026-06-08days on market $105,000 Active 94 DOM
-
2026-06-07days on market $105,000 Active 93 DOM
-
2026-06-03days on market $105,000 Active 89 DOM
-
2026-06-02days on market $105,000 Active 88 DOM
-
2026-06-01days on market $105,000 Active 87 DOM
-
2026-05-31days on market $105,000 Active 86 DOM
-
2026-05-30days on market $105,000 Active 85 DOM
-
2026-05-08price $105,000 1162-char remark
Show marketing remark (1162 chars)
If you’ve been waiting for the right investment opportunity in Flint, this is it! Nestled in the highly sought-after Bullard Independent School District, this property sits in a strong location with long-term upside and steady demand. Whether you’re looking to flip, renovate and hold, or build sweat equity, this one has the bones and the potential to make it worth your time. With the right vision and updates, this property could transform into a standout home in an area buyers consistently look for. The lot offers space and privacy you don’t always find in more crowded subdivisions, while still keeping you close to the conveniences of Flint and South Tyler. The foundation for value is already here. The rest is strategy and execution. Opportunities like this don’t sit forever in desirable school zones and growing areas. For the investor who sees beyond current condition and into future potential, this is the kind of project that makes sense. Bring your contractor. Bring your vision. Bring your calculator. This one has “before and after” written all over it. Book an appointment today to view this amazing home!
-
2026-03-06$110,000 Active 1162-char remark
Show marketing remark (1162 chars)
If you’ve been waiting for the right investment opportunity in Flint, this is it! Nestled in the highly sought-after Bullard Independent School District, this property sits in a strong location with long-term upside and steady demand. Whether you’re looking to flip, renovate and hold, or build sweat equity, this one has the bones and the potential to make it worth your time. With the right vision and updates, this property could transform into a standout home in an area buyers consistently look for. The lot offers space and privacy you don’t always find in more crowded subdivisions, while still keeping you close to the conveniences of Flint and South Tyler. The foundation for value is already here. The rest is strategy and execution. Opportunities like this don’t sit forever in desirable school zones and growing areas. For the investor who sees beyond current condition and into future potential, this is the kind of project that makes sense. Bring your contractor. Bring your vision. Bring your calculator. This one has “before and after” written all over it. Book an appointment today to view this amazing home!
-
2013-01-22soldstatus
-
1979-10-09soldstatus
ⓘ Source: listings_history table (triggers on properties + properties_extension) + one-shot
backfill from property_details.listing_events for pre-trigger history.
Tax reassessment forecast TX · Resets to sale price
- Current annual tax
- $565 · $47/mo
- Projected year-2 tax
- $1,922 · $160/mo
- Expected delta
- +$1,356/yr (+$113/mo · 239.8%)
ⓘ Screening estimate from a state-policy table — verify with the county assessor before closing.
Climate risk First Street
- Flood 1/10 Low FEMA zone X (unshaded) · 0% chance over 30 yrs
- Wildfire 3/10 Moderate
- Heat 7/10 Severe 7 d/yr ≥109°F today · 26 d/yr by 30 yrs out
- Wind 6/10 Major 68% chance of damaging wind over 30 yrs
- Air quality 1/10 Low 0 unhealthy d/yr today · 0 by 30 yrs out
Nearby sold comps map
Loading sold comps map…
Walkable amenities ~0.75 mi
Loading nearby amenities…
Taxation est. · year 1
- Rental income
- $22,464
- − Mortgage interest
- −$5,882
- − Property taxes
- −$565
- − Insurance
- −$525
- − Repairs & maintenance
- −$1,797
- − Management
- −$1,797
- − Depreciation
- −$3,055
- Taxable income
- $8,844
- Est. tax owed @ 24.0%
- −$2,122
- After-tax cash flow
- $7,927/yr
For passive investors: Depreciation is non-cash, so a rental often shows a tax loss while cash-flowing — sheltering income. Rental losses are passive: they offset passive income freely, and up to $25,000/yr can offset ordinary (W-2) income if you actively participate and your MAGI is under $100k (phasing out to $0 by $150k); unused losses carry forward. On sale, claimed depreciation is recaptured at up to 25%, and gains may owe capital-gains tax (a 1031 exchange can defer both). Figures are a year-1 estimate at your 24.0% rate — not tax advice; consult a CPA.
Schools (NCES district)
- District
- Bullard ISD
- NCES district ID
- 4812060
- Math proficiency
- 65% ▼ -2.00%
- Reading proficiency
- 60% ▬ 0.00%
- Median HH income
- $55,026
- Composite
- 53.66/100
- National rank
- #1433
- State rank
- #48 of 826 in TX
Livability — Emerald Bay
- Score
- 71/100
- State rank
- #293
- US rank
- #6721
Category grades
Schools grade is shown separately in the Schools card above.
Census & demographics
- County
- Smith County · 180,570 people
- Metro
- Tyler, TX
- Population (ZIP)
- 15,704
- Household income
- $90,057
- Rent vs Own
- Severe rent burden
- 98.0
Population outlook (Smith County) Hauer SSP2
- Today (2025)
- 248,890 people
- By 2030
- 261,665 · +5.1%
- By 2040
- 286,114 · +15.0%
- By 2050
- 308,006 · +23.8%
- By 2075
- 354,171 · +42.3%
- By 2100
- 372,828 · +49.8%
Race, ethnicity, and origin ACS 2023
- Neighborhood character
- Predominantly White (71%)
- Race & ethnicity
- White 71% Hispanic / Latino 16% Two or more races 13% Black 11%
- Hispanic origin (detail)
- Mexican 12%
- Common ancestry
- Iranian 2% Serbian 2% Portuguese 1%
- Foreign-born
- 5% · Canada
- Languages at home
- 85% English-only · Spanish 13%
Political lean MEDSL · Smith
- 2024 margin
- Solid R (+45.1) · D 27.0% · R 72.1%
- 2008→2024 swing
- -5.6pp toward R · 2008: -39.5pp · 2024: -45.1pp
- All cycles
- 2024: R+45.1 2020: R+39.4 2016: R+43.9 2012: R+46.9 2008: R+39.5
Not yet ingested
- Civics
- —
Market trends
- HPI YoY
- ▼ -78.39%
- Current HPI
- 197.2375
- Rent YoY
- —
- Metro
- Tyler, TX
- State GDP YoY
- ▲ 3.95%
- F500 in state
- 110
Industry mix (Fortune 500 HQ in TX)
| Industry | F500 HQs | Revenue |
|---|---|---|
| Energy | 16 | $1,198B |
|
||
| Technology | 5 | $198B |
|
||
| Engineering / Construction | 4 | $72B |
|
||
| Energy Services | 3 | $60B |
|
||
| Utilities | 3 | $41B |
|
||
| Healthcare | 2 | $330B |
|
||
Price history
-4.5% since first listed4 events — show timeline
- 2026-05-08 Price Changed $105,000 GTAR
- 2026-03-06 Listed $110,000 GTAR
- 2013-01-22 Sold (Public Records) — Public Records
- 1979-10-09 Sold (Public Records) — Public Records
Property tax history
+1.8%/yrLatest (2024): $565 · +11.1% YoY. Source: county tax records.
Cash-flow waterfall
monthlySold comps — $/sqft
last 12 mo · ≤1 miLoading sold comps…