 Duplex
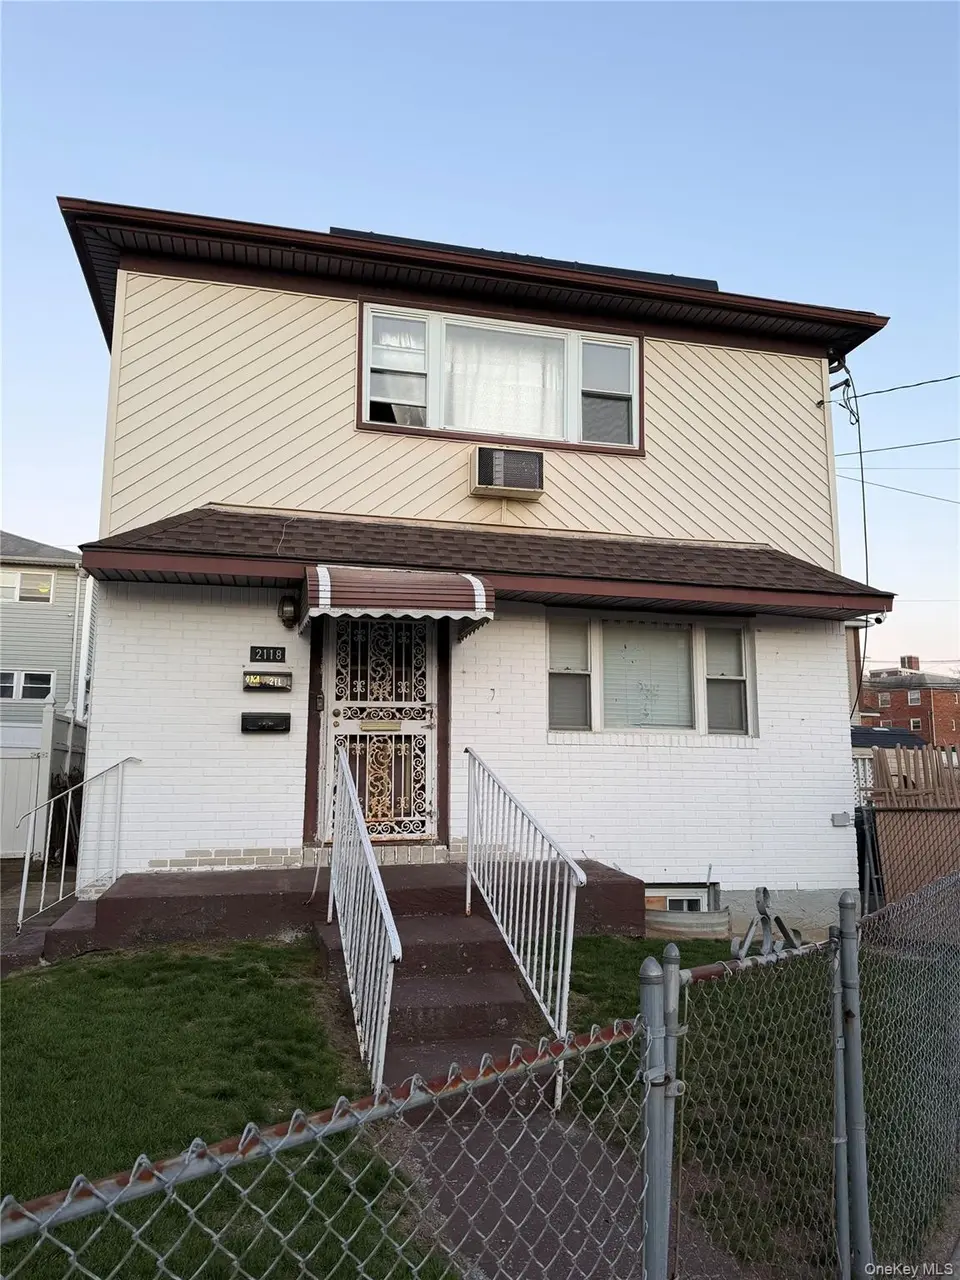
2118 Elk Dr · New York, NY
Flood risk 6/10 · Moderate
- FEMA flood zone
- X (unshaded)
- Chance of flooding over 30 yrs
- 0.71%
- Est. flood insurance / yr
- $507 – $1,088
Fire risk 1/10 · Minimal
- Est. fire insurance / yr
- $691 – $1,283
Heat risk 6/10 · Moderate
- Hot days now (above 95°F)
- 7 days/yr
- Hot days in 30 yrs
- 16 days/yr
Wind risk 6/10 · Moderate
- Chance of severe wind over 30 yrs
- 77.0%
Air-quality risk 3/10 · Minor
- Unhealthy air days now
- 4 days/yr
- Unhealthy air days in 30 yrs
- 4 days/yr
Risk factors via First Street. Map © Google.
Why this score? — see what drove the C+ grade
The composite is a weighted blend of 9 inputs, each scored 0–100. Each bar is that input's sub-score; the figure is the points it added to the 100-point composite (weight × sub-score).
- Cash flow +25.3/30.0
- DSCR +8.3/10.0
- ARV discount +7.5/15.0
- 1% rule +5.9/10.0
- Schools +5.0/10.0
- Livability +3.8/5.0
- Rent growth +2.5/5.0
- Condition / age +2.5/5.0
- Appreciation +0.0/10.0
$710,000
🖨 Deal sheet 📄 Offer letter ✓ Due diligence
Multi-family units
County records classify this as Multi-Family (2-4 Unit). Listing-text estimate: 2 units. confirmed
Listing remarks
Property is currently being prepared for market — more photos coming soon. Priced to sell quickly - MOTIVATED SELLER. Don’t miss this opportunity to secure a high-potential multi-family property in a growing area! Rare opportunity to own a large 2-family home in Far Rockaway featuring a total of 8 bedrooms and 4.5 bathrooms! This expansive property offers incredible space and flexibility, perfect for both end-users and investors alike. The first unit features a spacious duplex layout with basement access, offering 5 bedrooms and 2.5 baths, along with additional living space and a separate entrance. The second-floor unit includes 3 bedrooms and 2 full baths and is currently tena
Key facts
- Basement access
- Separate entrance
- Large 2-family home
Tags
Property features AI
Exterior
- Parking: Driveway; Garage with 2 spaces
- Utilities: Public sewer; Utilities: see remarks
- Home design: Duplex
- Construction: Aluminum siding; Brick construction
- Exterior features: Aluminum siding and brick exterior; Not waterfront
Interior
- Bedrooms: One 3-bedroom unit and one 4-bedroom unit
- Bathrooms: Five full bathrooms
- Heating & cooling: Natural gas heating; Additional heating type listed as 'Other'; Wall/window air conditioning units
- Interior features: Finished full basement with walk-out access; Additional interior features noted as 'Other'
Neighborhood map
What this means for you Summary
Snapshot
- This is a 2 × 8.0-bed/4.5-bath units multifamily listed at $710k.
Deal economics
- At list price, monthly cash flow is $2k ($19k/yr) — positive. Per door: $809/mo.
- The deal already cash-flows at list — no discount required.
- Meets the 1% rule at list price ($8k rent vs $710k).
- Recommended offer: $689k (3.0% below list) — sets the bar for market timing.
- Cap rate 9.0% vs local median 2.6% in New York — top-decile yield for the area; either an underpriced asset or a hidden risk that comps aren't pricing in. Stress-test before assuming the spread holds.
Location & tenants
- Location reads 75/100 on livability (#268 in NY, #4,188 nationally) — a middle-class / working-renter tenant base. Strengths: amenities A+, commute A+, health & safety A; Watch: crime F, cost of living F.
- Market conditions: 137 active listings in the ZIP; 5,302 units permitted in Queens County in 2024 (4,918 in 5+ unit buildings).
- At $7,747/mo this rent would consume 166% of the median local household income ($56k/yr) (locally 4702% of renters already pay >50% of income on rent) — very limited rent-growth headroom before tenants either downsize or default.
Forward outlook
- Local home prices are declining (-3.0%/yr); year-one equity from $5k of loan paydown is wiped out by about $21k of value loss. Plan a longer hold.
- Queens County population projected at +16% by 2050 — long-run rental-demand tailwind backs the buy-and-hold thesis.
Negotiation context
- It's been on market 59 days — a 3% lower offer ($689k) is reasonable based on typical stale-listing flexibility.
- Current owner paid $465k; list at $710k implies a 53% gain — meaningful room to come down on a strong offer.
Risks & watch-outs
- Watch-outs: built in 1950 — expect roof / HVAC / electrical / plumbing capex.
- Climate carrying-cost: major flood risk; major wind risk, 77% chance of damaging wind over 30y; extreme-heat days projected 7→16/yr by 2055 (HVAC capex compounding) — expect insurance premiums to compound above CPI over the hold.
Questions for the listing agent
- It's been on market 59 days. Have you received any prior offers? Is the seller open to a 3% concession, seller financing, or rate buy-down credit?
- Can we see the unit-by-unit rent roll, current vacancy, and any below-market leases? What's the average tenancy length?
- What capital expenditures (roof, boiler, parking lot, exteriors) have been made in the last 5 years, and what's planned in the next 2?
- Built in 1950 — when were the roof, HVAC, electrical panel, plumbing, and water heater last replaced?
- Is there a deadline driving the sale (1031 exchange, divorce, estate, relocation)? That informs how much negotiation room exists.
- Schools are B-rated — typically a magnet for longer-tenancy family renters. What's the average tenant stay here, and is there a school-zone premium baked into asking?
- Crime grade is F in this area — have there been break-ins, vandalism, or insurance claims at this property in the last 3 years? What carrier currently insures it and at what premium?
- What's the average days-on-market for RENTAL listings here right now (not sales)? A rising rental-DOM trend means longer vacancies and softer asking-rent achievability than the comps imply.
- What's the recent tenant-quality profile in this submarket — average credit score on applications, eviction rate, late-payment / NSF rate, and stable-employment percentage? A property-management company in the area should have these aggregated.
- How much new apartment / multifamily construction is in the pipeline within 1–3 miles? Heavy new supply (>2% of stock underway) typically softens rents 12–24 months out; light construction supports rent growth.
Investment metrics
- 1% rule
- 1.09% ✓
- Cap rate
- 9.03%
- Cash-on-cash
- 9.77%
- DSCR
- 1.43
- GRM
- 7.6
CMA / ARV
No comps found within radius.
Projected returns pro-forma
-3.0% appreciation · 3.0% rent growth · sell at horizon
- IRR
- -1.6%
- Equity multiple
- 0.94×
- Total profit
- $-12,089
- Equity at exit
- $105,863
- IRR
- 8.1%
- Equity multiple
- 1.61×
- Total profit
- $121,686
- Equity at exit
- $61,388
Cash invested: $198,800 (down + closing). Projections, not guarantees.
Landlord ↔ Tenant lean methodology
- Overall (CITY)
- 0 Strongly Tenant-Friendly
- State New York
- 15 Strongly Tenant-Friendly · D+10
- County
- — inherits STATE
- City New York
- 0 Strongly Tenant-Friendly · D+34
ZIP-level market 11691
- Active inventory
- 137
- Price-to-rent
- 15.3×
Monthly cashflow live
- Estimated rent
- $7,747 medium interval (Pro) →
- Mortgage (P&I)
- −$3,723
- Tax from tax record
- −$482 /mo · $5,788/yr
- Insurance
- −$296
- HOA
- −$0
- Vacancy / Maint / Mgmt
- −$1,627
- Net cashflow
- $1,619
Break-even live
2-unit breakdown (identical units grouped — click to expand)
| Units | Beds | Baths | Est. rent |
|---|---|---|---|
| 2× units | 8.0 | 4.5 | $7,748 |
| #1 | 8.0 | 4.5 | $3,874 |
| #2 | 8.0 | 4.5 | $3,874 |
| Total (2 units) | $7,747 | ||
UW: 25.0% down · 7.5% · 30yr · 1.5% tax · 5.0% vac · 8.0% maint · 8.0% mgmt
Financing live
Cash to close
- Down payment
- $177,500
- Closing costs
- $21,300
- Reserves months
- —
- Total cash needed
- —
Loan-product check · same deal, 3 products live
Conventional
25% down · 7.5% · 30yr
- Down + closing
- —
- Monthly P&I
- —
- Monthly cashflow
- —
- DSCR
- —
- Eligible?
- —
Personal DTI + credit; lowest rate.
DSCR
20% down · 8.5% · 30yr
- Down + closing
- —
- Monthly P&I
- —
- Monthly cashflow
- —
- DSCR
- —
- Eligible?
- —
No personal income docs; deal must DSCR.
Hard money
10% down · 12.0% · 12mo
- Down + closing
- —
- Monthly P&I
- —
- Monthly cashflow
- —
- DSCR
- —
- Eligible?
- —
Short-term bridge; refi at stabilization.
Listing history 11 events
-
2026-06-13statusdays on market $710,000 Pending 59 DOM
-
2026-06-10days on market $710,000 Active 56 DOM
-
2026-06-08days on market $710,000 Active 55 DOM
-
2026-06-08days on market $710,000 Active 54 DOM
-
2026-06-04days on market $710,000 Active 51 DOM
-
2026-06-03days on market $710,000 Active 50 DOM
-
2026-06-01days on market $710,000 Active 48 DOM
-
2026-05-31days on market $710,000 Active 47 DOM
-
2026-04-14$710,000 Active
-
2005-09-20soldstatus $465,000
-
2004-01-15soldstatus $330,000
ⓘ Source: listings_history table (triggers on properties + properties_extension) + one-shot
backfill from property_details.listing_events for pre-trigger history.
Tax reassessment forecast NY · Partial reset (capped growth)
- Current annual tax
- $5,788 · $482/mo
- Projected year-2 tax
- $8,893 · $741/mo
- Expected delta
- +$3,106/yr (+$259/mo · 53.7%)
ⓘ Screening estimate from a state-policy table — verify with the county assessor before closing.
Climate risk First Street
- Flood 6/10 Major FEMA zone X (unshaded) · 71% chance over 30 yrs
- Wildfire 1/10 Low
- Heat 6/10 Major 7 d/yr ≥95°F today · 16 d/yr by 30 yrs out
- Wind 6/10 Major 77% chance of damaging wind over 30 yrs
- Air quality 3/10 Moderate 4 unhealthy d/yr today · 4 by 30 yrs out
Nearby sold comps map
Loading sold comps map…
Walkable amenities ~0.75 mi
Loading nearby amenities…
Taxation est. · year 1
- Rental income
- $92,964
- − Mortgage interest
- −$39,771
- − Property taxes
- −$5,788
- − Insurance
- −$3,550
- − Repairs & maintenance
- −$7,437
- − Management
- −$7,437
- − Depreciation
- −$20,655
- Taxable income
- $8,326
- Est. tax owed @ 24.0%
- −$1,998
- After-tax cash flow
- $17,426/yr
For passive investors: Depreciation is non-cash, so a rental often shows a tax loss while cash-flowing — sheltering income. Rental losses are passive: they offset passive income freely, and up to $25,000/yr can offset ordinary (W-2) income if you actively participate and your MAGI is under $100k (phasing out to $0 by $150k); unused losses carry forward. On sale, claimed depreciation is recaptured at up to 25%, and gains may owe capital-gains tax (a 1031 exchange can defer both). Figures are a year-1 estimate at your 24.0% rate — not tax advice; consult a CPA.
Schools (NCES district)
No district data.
Livability — New York
- Score
- 75/100
- State rank
- #268
- US rank
- #4188
Category grades
Schools grade is shown separately in the Schools card above.
Census & demographics
- Census place
- New York, NY
- County
- Queens County · 1,914,869 people
- City population
- 7,731,280
- Metro
- New York-Newark-Jersey City, NY-NJ-PA
- Population (ZIP)
- 69,359
- Household income
- $56,135
- Rent vs Own
- Severe rent burden
- 4702.0
Population outlook (Queens County) Hauer SSP2
- Today (2025)
- 2,546,320 people
- By 2030
- 2,643,059 · +3.8%
- By 2040
- 2,815,563 · +10.6%
- By 2050
- 2,944,423 · +15.6%
- By 2075
- 3,123,338 · +22.7%
- By 2100
- 3,098,688 · +21.7%
Race, ethnicity, and origin ACS 2023
- Neighborhood character
- Highly diverse neighborhood (Simpson 0.71)
- Race & ethnicity
- Black 40% Hispanic / Latino 26% White 24% Two or more races 12% Asian 4%
- Hispanic origin (detail)
- Puerto Rican 4% Dominican 5%
- Common ancestry
- Hispanic 3% Italian 2% Romanian 2%
- Foreign-born
- 35% · Canada, China, Jamaica
- Languages at home
- 66% English-only · Spanish 21% French/Haitian/Cajun 2% Russian/Polish/Slavic 2%
Political lean MEDSL · Queens
- 2024 margin
- Strong D (+24.6) · D 62.3% · R 37.7%
- 2008→2024 swing
- -26.2pp toward R · 2008: 50.8pp · 2024: 24.6pp
- All cycles
- 2024: D+24.6 2020: D+45.2 2016: D+53.4 2012: D+58.5 2008: D+50.8
Not yet ingested
- Civics
- —
Market trends
- HPI YoY
- ▼ -397.66%
- Current HPI
- 281.4044
- Rent YoY
- —
- Metro
- New York-Newark-Jersey City, NY-NJ-PA
- State GDP YoY
- ▲ 2.60%
- F500 in state
- 92
Industry mix (Fortune 500 HQ in NY)
| Industry | F500 HQs | Revenue |
|---|---|---|
| Financial Services | 10 | $950B |
|
||
| Consumer Goods | 9 | $162B |
|
||
| Insurance | 4 | $225B |
|
||
| Telecommunications | 2 | $144B |
|
||
| Pharmaceuticals | 2 | $112B |
|
||
| Media / Entertainment | 2 | $69B |
|
||
Price history
+115.2% since first listed3 events — show timeline
- 2026-04-14 Listed $710,000 OneKey® MLS as Distributed by MLS Grid
- 2005-09-20 Sold (Public Records) $465,000 Public Records
- 2004-01-15 Sold (Public Records) $330,000 Public Records
Property tax history
+4.2%/yrLatest (2025): $5,788 · +3.4% YoY. Source: county tax records.
Cash-flow waterfall
monthlySold comps — $/sqft
last 12 mo · ≤1 miLoading sold comps…