2900 S Canyon Rd #58 · Ellensburg, WA
Flood risk 8/10 · Major
- FEMA flood zone
- AE
- Chance of flooding over 30 yrs
- 0.99%
- Est. flood insurance / yr
- $1,737 – $8,500
Fire risk 4/10 · Minor
- Est. fire insurance / yr
- $604 – $1,122
Heat risk 3/10 · Minor
- Hot days now (above 94°F)
- 7 days/yr
- Hot days in 30 yrs
- 14 days/yr
Wind risk 1/10 · Minimal
- Chance of severe wind over 30 yrs
- —
Air-quality risk 9/10 · Severe
- Unhealthy air days now
- 17 days/yr
- Unhealthy air days in 30 yrs
- 18 days/yr
Risk factors via First Street. Map © Google.
Why this score? — see what drove the B+ grade
The composite is a weighted blend of 9 inputs, each scored 0–100. Each bar is that input's sub-score; the figure is the points it added to the 100-point composite (weight × sub-score).
- Cash flow +30.0/30.0
- ARV discount +15.0/15.0
- 1% rule +10.0/10.0
- DSCR +10.0/10.0
- Schools +4.5/10.0
- Livability +4.1/5.0
- Rent growth +2.6/5.0
- Condition / age +2.5/5.0
- Appreciation +0.0/10.0
$91,999
🖨 Deal sheet 📄 Offer letter ✓ Due diligence
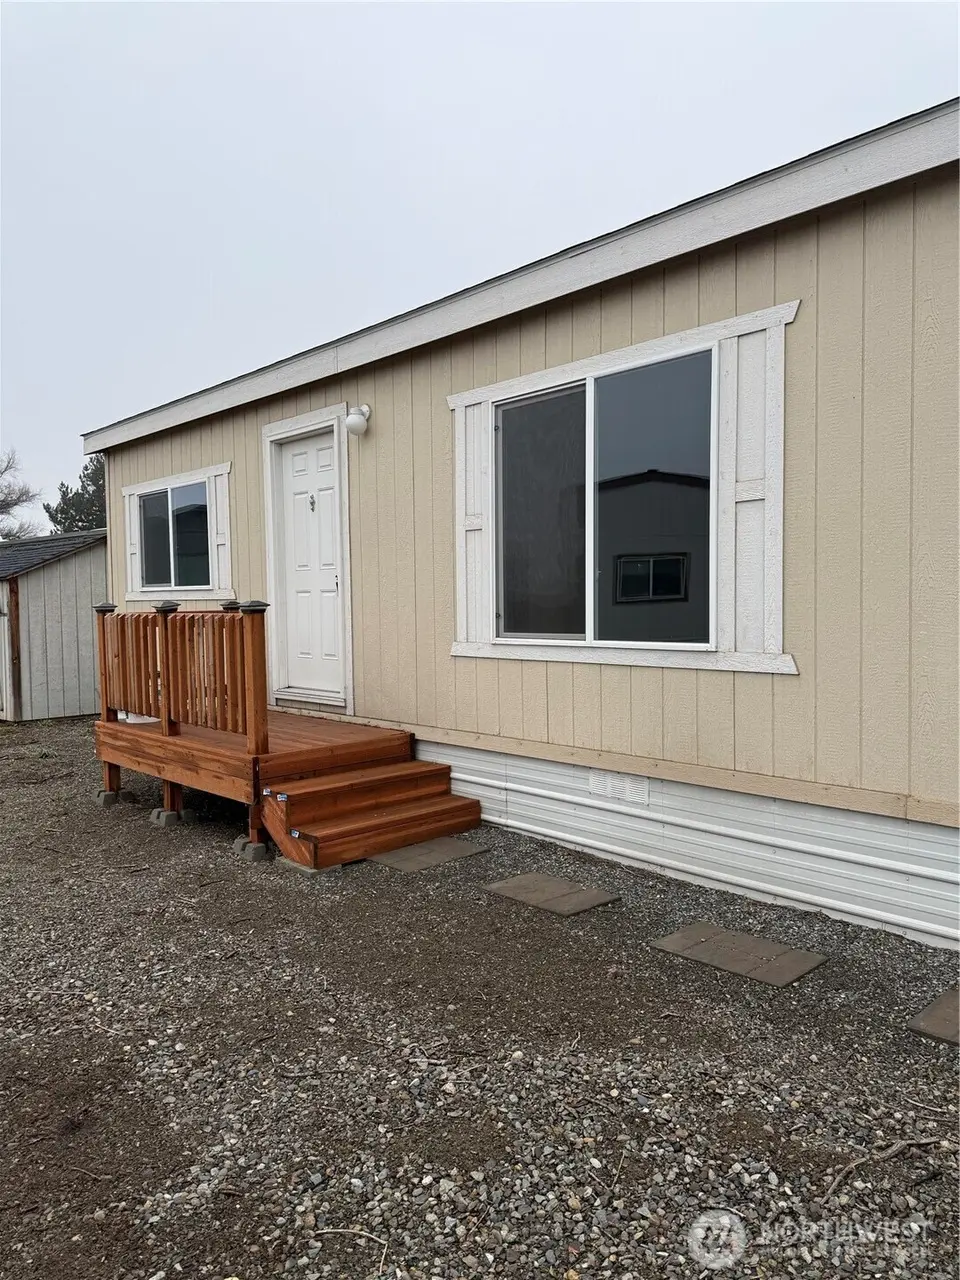
Listing remarks
Welcome to your dream home in the serene Millpond Community in Ellensburg, WA! This brand-new, never-lived-in double-wide manufactured home offers 3 spacious bedrooms, 2 modern bathrooms, a gourmet kitchen with new appliances, and an open, airy living area with large windows and durable flooring. Located in an all-ages park close to shopping and major roads, this home has convenience with a country feel. Pets are welcome subject to restrictions!
Key facts
- Large windows
- Durable flooring
- Gourmet kitchen
Tags
Neighborhood map
What this means for you Summary
Snapshot
- This is a 2-bed/1.0-bath manufactured listed at $92k.
Deal economics
- At list price, monthly cash flow is $113 ($1k/yr) — positive.
- The deal already cash-flows at list — no discount required.
- Meets the 1% rule at list price ($1k rent vs $92k).
- Recommended offer: $86k (6.0% below list) — sets the bar for market timing.
- Cap rate 13.3% vs local median 2.8% in Ellensburg — top-decile yield for the area; either an underpriced asset or a hidden risk that comps aren't pricing in. Stress-test before assuming the spread holds.
Location & tenants
- Location reads 82/100 on livability (#64 in WA, #1,157 nationally) — a professional / high-income tenant draw. Strengths: amenities A+, commute A+, health & safety A+; Watch: employment D-.
- Ellensburg School District (town): math 47% / reading 55% proficiency, ranked #148 of 291 in WA (top 51%) — acceptable for families but not a draw, mixed tenant base, ~2y average lease.
- Market conditions: Rents flat; 302 active listings in the ZIP; 433 units permitted in Kittitas County in 2024 (23 in 5+ unit buildings).
Forward outlook
- Local home prices are declining (-3.0%/yr); year-one equity from $636 of loan paydown is wiped out by about $3k of value loss. Plan a longer hold.
- Kittitas County population projected at +30% by 2050 — long-run rental-demand tailwind backs the buy-and-hold thesis.
Negotiation context
- It's been on market 67 days — a 6% lower offer ($86k) is reasonable based on typical stale-listing flexibility.
- 3 sale attempts since 2y ago with the ask held roughly flat each time — persistent listings suggest the price (not the market) is what's stuck; bring a comps-based counter.
Risks & watch-outs
- Watch-outs: flood insurance adds $427/mo.
- Climate carrying-cost: in FEMA flood zone AE (mandatory federal flood insurance) — expect insurance premiums to compound above CPI over the hold.
Questions for the listing agent
- It's been on market 67 days. Have you received any prior offers? Is the seller open to a 6% concession, seller financing, or rate buy-down credit?
- What's the actual annual flood-insurance premium (NFIP or private), and is the property in a SFHA with mandatory coverage?
- Why hasn't it sold? Are there any deal-killer items the seller is aware of (foundation, flood, title, zoning, code violations)?
- Is there a deadline driving the sale (1031 exchange, divorce, estate, relocation)? That informs how much negotiation room exists.
- What's the average days-on-market for RENTAL listings here right now (not sales)? A rising rental-DOM trend means longer vacancies and softer asking-rent achievability than the comps imply.
- What's the recent tenant-quality profile in this submarket — average credit score on applications, eviction rate, late-payment / NSF rate, and stable-employment percentage? A property-management company in the area should have these aggregated.
- How much new for-sale + rental construction is in the pipeline within 1–3 miles? Heavy new supply typically softens prices + rents 12–24 months out; constrained supply supports both.
Investment metrics
- 1% rule
- 1.62% ✓
- Cap rate
- 13.33%
- Cash-on-cash
- 25.14%
- DSCR
- 2.12
- GRM
- 5.2
CMA / ARV
- ARV (median comp)
- $177,422
- List price
- $91,999
- Delta
- -48.15%
- Verdict
- UNDERPRICED
- Comps
- 2 within 2.0 mi
Projected returns pro-forma
-3.0% appreciation · 0.57% rent growth · sell at horizon
- IRR
- -12.2%
- Equity multiple
- 0.57×
- Total profit
- $-10,965
- Equity at exit
- $13,717
- IRR
- -9.9%
- Equity multiple
- 0.50×
- Total profit
- $-12,991
- Equity at exit
- $7,954
Cash invested: $25,760 (down + closing). Projections, not guarantees.
Landlord ↔ Tenant lean methodology
- Overall (STATE)
- 28 Tenant-Leaning
- State Washington
- 28 Tenant-Leaning · D+8
- County
- — inherits STATE
- City
- — inherits STATE
ZIP-level market 98926
- Rents YoY
- 0.6%
- Active inventory
- 302
- Price-to-rent
- 5.2×
Monthly cashflow live
- Estimated rent
- $1,488 medium interval (Pro) →
- Mortgage (P&I)
- −$482
- Tax est. 1.5%
- −$115 /mo · $1,380/yr
- Insurance
- −$38
- Flood insurance flood zone
- −$427 /mo · $5,118/yr
- HOA
- −$0
- Vacancy / Maint / Mgmt
- −$312
- Net cashflow
- $113
Break-even live
UW: 25.0% down · 7.5% · 30yr · 1.5% tax · 5.0% vac · 8.0% maint · 8.0% mgmt
Financing live
Cash to close
- Down payment
- $23,000
- Closing costs
- $2,760
- Reserves months
- —
- Total cash needed
- —
Loan-product check · same deal, 3 products live
Conventional
25% down · 7.5% · 30yr
- Down + closing
- —
- Monthly P&I
- —
- Monthly cashflow
- —
- DSCR
- —
- Eligible?
- —
Personal DTI + credit; lowest rate.
DSCR
20% down · 8.5% · 30yr
- Down + closing
- —
- Monthly P&I
- —
- Monthly cashflow
- —
- DSCR
- —
- Eligible?
- —
No personal income docs; deal must DSCR.
Hard money
10% down · 12.0% · 12mo
- Down + closing
- —
- Monthly P&I
- —
- Monthly cashflow
- —
- DSCR
- —
- Eligible?
- —
Short-term bridge; refi at stabilization.
Listing history 20 events
-
2026-06-19days on market $91,999 Active 67 DOM
-
2026-06-18days on market $91,999 Active 66 DOM
-
2026-06-17days on market $91,999 Active 65 DOM
-
2026-06-16days on market $91,999 Active 64 DOM
-
2026-06-15days on market $91,999 Active 63 DOM
-
2026-06-14days on market $91,999 Active 61 DOM
-
2026-06-13days on market $91,999 Active 60 DOM
-
2026-06-10days on market $91,999 Active 58 DOM
-
2026-06-09days on market $91,999 Active 57 DOM
-
2026-06-08days on market $91,999 Active 56 DOM
-
2026-06-07days on market $91,999 Active 55 DOM
-
2026-06-05days on market $91,999 Active 52 DOM
-
2026-06-03days on market $91,999 Active 51 DOM
-
2026-06-02days on market $91,999 Active 50 DOM
-
2026-06-01days on market $91,999 Active 49 DOM
-
2026-05-31days on market $91,999 Active 48 DOM
-
2026-05-30days on market $91,999 Active 47 DOM
-
2026-04-12$91,999 Active
-
2025-04-21$91,999 Active
-
2024-12-18$91,999 Active
ⓘ Source: listings_history table (triggers on properties + properties_extension) + one-shot
backfill from property_details.listing_events for pre-trigger history.
Climate risk First Street
- Flood 8/10 Severe FEMA zone AE · 99% chance over 30 yrs
- Wildfire 4/10 Moderate
- Heat 3/10 Moderate 7 d/yr ≥94°F today · 14 d/yr by 30 yrs out
- Wind 1/10 Low
- Air quality 9/10 Extreme 17 unhealthy d/yr today · 18 by 30 yrs out
Nearby sold comps map
Loading sold comps map…
Walkable amenities ~0.75 mi
Loading nearby amenities…
Taxation est. · year 1
- Rental income
- $17,856
- − Mortgage interest
- −$5,153
- − Property taxes
- −$1,380
- − Insurance
- −$5,578
- − Repairs & maintenance
- −$1,428
- − Management
- −$1,428
- − Depreciation
- −$2,676
- Taxable income
- $211
- Est. tax owed @ 24.0%
- −$51
- After-tax cash flow
- $1,308/yr
For passive investors: Depreciation is non-cash, so a rental often shows a tax loss while cash-flowing — sheltering income. Rental losses are passive: they offset passive income freely, and up to $25,000/yr can offset ordinary (W-2) income if you actively participate and your MAGI is under $100k (phasing out to $0 by $150k); unused losses carry forward. On sale, claimed depreciation is recaptured at up to 25%, and gains may owe capital-gains tax (a 1031 exchange can defer both). Figures are a year-1 estimate at your 24.0% rate — not tax advice; consult a CPA.
Schools (NCES district)
- District
- Ellensburg School District
- NCES district ID
- 5302460
- Math proficiency
- 47% ▲ 1.00%
- Reading proficiency
- 55% ▲ 2.00%
- Median HH income
- $39,944
- Composite
- 44.61/100
- National rank
- #6026
- State rank
- #148 of 291 in WA
Livability — Ellensburg
- Score
- 82/100
- State rank
- #64
- US rank
- #1157
Category grades
Schools grade is shown separately in the Schools card above.
Census & demographics
- County
- Kittitas County · 34,353 people
- City population
- 34,353
- Metro
- Ellensburg, WA
- Population (ZIP)
- 34,353
- Household income
- $71,137
- Rent vs Own
- Severe rent burden
- 2076.0
Population outlook (Kittitas County) Hauer SSP2
- Today (2025)
- 48,605 people
- By 2030
- 51,628 · +6.2%
- By 2040
- 57,361 · +18.0%
- By 2050
- 63,241 · +30.1%
- By 2075
- 79,310 · +63.2%
- By 2100
- 94,769 · +95.0%
Race, ethnicity, and origin ACS 2023
- Neighborhood character
- Predominantly White (79%)
- Race & ethnicity
- White 79% Hispanic / Latino 11% Two or more races 9% Asian 2% Black 1%
- Hispanic origin (detail)
- Mexican 8%
- Common ancestry
- Italian 9% Portuguese 4% Slovak 3%
- Foreign-born
- 5% · Canada
- Languages at home
- 91% English-only · Spanish 6% Other Indo-European 1% German/W. Germanic 1%
Political lean MEDSL · Kittitas
- 2024 margin
- R (+14.6) · D 41.1% · R 55.7% · Other 3.2%
- 2008→2024 swing
- -6.5pp toward R · 2008: -8.1pp · 2024: -14.6pp
- All cycles
- 2024: R+14.6 2020: R+10.2 2016: R+14.5 2012: R+12.6 2008: R+8.1
Not yet ingested
- Civics
- —
Market trends
- HPI YoY
- ▼ -193.62%
- Current HPI
- 211.3198
- Rent YoY
- ▲ 0.57%
- Metro
- Ellensburg, WA
- State GDP YoY
- ▲ 4.65%
- F500 in state
- 22
Industry mix (Fortune 500 HQ in WA)
| Industry | F500 HQs | Revenue |
|---|---|---|
| Retail | 2 | $269B |
|
||
| Technology / Retail | 1 | $638B |
|
||
| Technology | 1 | $245B |
|
||
| Telecommunications | 1 | $38B |
|
||
| Food / Beverage | 1 | $36B |
|
||
| Automotive / Trucks | 1 | $34B |
|
||
Price history
+0.0% since first listed3 events — show timeline
- 2026-04-12 Listed $91,999 NWMLS as Distributed by MLS Grid
- 2025-04-21 Listed $91,999 YAMLS
- 2024-12-18 Listed $91,999 YAMLS
Property tax history
+2.7%/yrLatest (2023): $180 · -3.4% YoY. Source: county tax records.
Cash-flow waterfall
monthlySold comps — $/sqft
last 12 mo · ≤1 miLoading sold comps…