2520 Barnes Rd · Lake Bryan, TX
Flood risk 1/10 · Minimal
- FEMA flood zone
- X (unshaded)
- Chance of flooding over 30 yrs
- 0.0%
- Est. flood insurance / yr
- $507 – $1,088
Fire risk 4/10 · Minor
- Est. fire insurance / yr
- $1,222 – $2,270
Heat risk 8/10 · Major
- Hot days now (above 110°F)
- 7 days/yr
- Hot days in 30 yrs
- 22 days/yr
Wind risk 8/10 · Major
- Chance of severe wind over 30 yrs
- 80.0%
Air-quality risk 1/10 · Minimal
- Unhealthy air days now
- 0 days/yr
- Unhealthy air days in 30 yrs
- 0 days/yr
Risk factors via First Street. Map © Google.
Why this score? — see what drove the B- grade
The composite is a weighted blend of 9 inputs, each scored 0–100. Each bar is that input's sub-score; the figure is the points it added to the 100-point composite (weight × sub-score).
- Cash flow +30.0/30.0
- DSCR +10.0/10.0
- 1% rule +9.5/10.0
- ARV discount +7.5/15.0
- Livability +3.2/5.0
- Schools +2.6/10.0
- Rent growth +2.5/5.0
- Condition / age +2.5/5.0
- Appreciation +0.0/10.0
$125,000
🖨 Deal sheet (PDF) 📄 Offer letter ✓ Due diligence
Listing remarks MLS
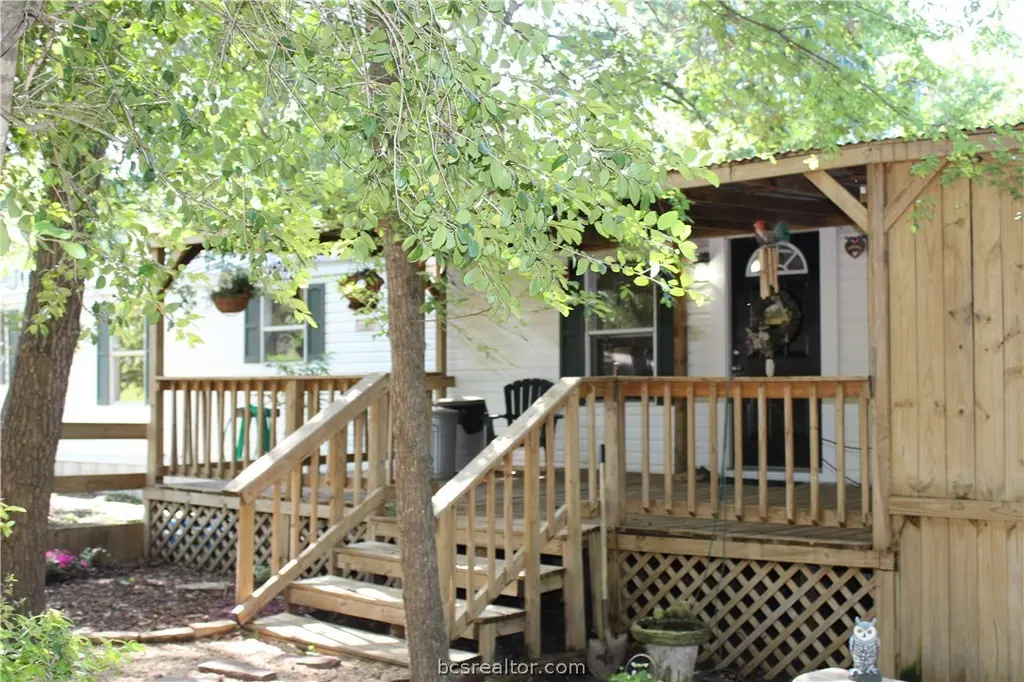
Livestock friendly with mature shade trees, this 1999 mobile home is located on 3/4 an acre. Home has 1,216 square feet of indoor living with spacious family room, dining area with built-in buffet and cabinets, and large laundry room with freezer space. Master bedroom suite with walk-in closet, separate shower, and corner garden tub. Home has been updated to non mobile home metal doors, fresh custom paint, updated A/C, and landscaped yard. An outdoor lovers paradise with front and back covered porches, garage is attached to the front porch, 20'X20' shop on slab with 220 & 110 electricity, storage shed, fenced and cross fenced for horses and donkeys, and a loafing shed.
Key facts
- Built 1998
Neighborhood map
What this means for you Summary
Snapshot
- This is a 3-bed/2.0-bath manufactured listed at $125k.
Deal economics
- At list price, monthly cash flow is $665 ($8k/yr) — positive.
- The deal already cash-flows at list — no discount required.
- Meets the 1% rule at list price ($2k rent vs $125k).
Location & tenants
- Location reads 65/100 on livability (#722 in TX) — a middle-class / working-renter tenant base. Strengths: cost of living A+, housing A+, crime A; Watch: amenities F, commute F, health & safety F.
- Bryan ISD (urban): math 30% / reading 32% proficiency, ranked #608 of 826 in TX (top 74%) — families likely to look elsewhere, expect single-tenant / working-renter base with shorter leases; 68% free/reduced lunch — lower-income household profile, screen leases tightly.
- Zoned schools: Kemp-Carver El (math 22% / reading 17%, grade F, #3,583 of 4,322 statewide, top 86%, 504 students, 92% FRL); Arthur L Davila Middle (math 32% / reading 35%, grade F, #911 of 1,662 statewide, top 56%, 1,044 students, 85% FRL); James Earl Rudder H S (math 14% / reading 27%, grade F, #1,389 of 1,632 statewide, top 86%, 1,769 students, 76% FRL) — zoned schools average 85% FRL vs 68% district-wide (17 pts higher); higher-poverty schools than district average — tighter screening recommended.
- Market conditions: 304 active listings in the ZIP; 1 comparable units currently listed for rent nearby; 2,211 units permitted in Brazos County in 2024 (768 in 5+ unit buildings).
Forward outlook
- Local home prices are declining (-3.0%/yr); year-one equity from $864 of loan paydown is wiped out by about $4k of value loss. Plan a longer hold.
- Brazos County population projected at +55% by 2050 — long-run rental-demand tailwind backs the buy-and-hold thesis.
- At projected returns (-3.0% appreciation + 3.0% rent growth), your $35k cash investment doubles in ~6 years — after that, you're playing with house money.
Negotiation context
- Only 1 days on market — expect competitive offers; lowballing is unlikely to land.
- 2 sale attempts since 10y ago; this cycle's ask is 25% above the opening price — seller raised mid-cycle; expect resistance to lowballs.
Risks & watch-outs
- Climate carrying-cost: severe wind risk, 80% chance of damaging wind over 30y; extreme-heat days projected 7→22/yr by 2055 (HVAC capex compounding) — expect insurance premiums to compound above CPI over the hold.
Questions for the listing agent
- Is there a deadline driving the sale (1031 exchange, divorce, estate, relocation)? That informs how much negotiation room exists.
- Schools are F-rated, which usually means shorter tenancies and higher turnover. Who's the typical renter profile here, and what's been the actual vacancy rate?
- What's the average days-on-market for RENTAL listings here right now (not sales)? A rising rental-DOM trend means longer vacancies and softer asking-rent achievability than the comps imply.
- What's the recent tenant-quality profile in this submarket — average credit score on applications, eviction rate, late-payment / NSF rate, and stable-employment percentage? A property-management company in the area should have these aggregated.
- How much new for-sale + rental construction is in the pipeline within 1–3 miles? Heavy new supply typically softens prices + rents 12–24 months out; constrained supply supports both.
Investment metrics
- 1% rule
- 1.45% ✓
- Cap rate
- 12.68%
- Cash-on-cash
- 22.81%
- DSCR
- 2.01
- GRM
- 5.7
CMA / ARV
No comps found within radius.
Projected returns pro-forma
-3.0% appreciation · 3.0% rent growth · sell at horizon
- IRR
- 15.7%
- Equity multiple
- 1.63×
- Total profit
- $22,082
- Equity at exit
- $18,638
- IRR
- 24.3%
- Equity multiple
- 3.10×
- Total profit
- $73,658
- Equity at exit
- $10,808
Cash invested: $35,000 (down + closing). Projections, not guarantees.
Landlord ↔ Tenant lean methodology
- Overall (STATE)
- 87 Strongly Landlord-Friendly
- State Texas
- 87 Strongly Landlord-Friendly · R+5
- County
- — inherits STATE
- City
- — inherits STATE
ZIP-level market 77807
- Active inventory
- 304
- Price-to-rent
- 5.7×
Monthly cashflow live
- Estimated rent
- $1,815 medium interval (Pro) →
- Mortgage (P&I)
- −$656
- Tax from tax record
- −$61 /mo · $731/yr
- Insurance
- −$52
- HOA
- −$0
- Vacancy / Maint / Mgmt
- −$381
- Net cashflow
- $665
Break-even live
Sensitivity live
| Price | -10% $736 | -5% $701 | +0% $665 | +5% $630 | +10% $594 |
|---|---|---|---|---|---|
| Rent | -10% $522 | -5% $594 | +0% $665 | +5% $737 | +10% $809 |
| Rate | -1.0pp $728 | -0.5pp $697 | base $665 | +0.5pp $633 | +1.0pp $600 |
UW: 25.0% down · 7.5% · 30yr · 1.5% tax · 5.0% vac · 8.0% maint · 8.0% mgmt
Financing live
Cash to close
- Down payment
- $31,250
- Closing costs
- $3,750
- Reserves months
- —
- Total cash needed
- —
Loan-product check · same deal, 3 products live
Conventional
25% down · 7.5% · 30yr
- Down + closing
- —
- Monthly P&I
- —
- Monthly cashflow
- —
- DSCR
- —
- Eligible?
- —
Personal DTI + credit; lowest rate.
DSCR
20% down · 8.5% · 30yr
- Down + closing
- —
- Monthly P&I
- —
- Monthly cashflow
- —
- DSCR
- —
- Eligible?
- —
No personal income docs; deal must DSCR.
Hard money
10% down · 12.0% · 12mo
- Down + closing
- —
- Monthly P&I
- —
- Monthly cashflow
- —
- DSCR
- —
- Eligible?
- —
Short-term bridge; refi at stabilization.
Rent comps 1 comps
| Address | Beds | Baths | Sqft | Rent | $/sqft | DOM | Units | Dist |
|---|---|---|---|---|---|---|---|---|
| 2087 W Osr Apt A Bryan, TX | 2.0 | 1.0 | 900 | $1,100 | $1.22 | 45d | 1 | 0.63mi |
Listing history 5 events
-
2026-04-10soldstatus
-
2019-08-29$99,900
-
2017-05-02soldstatus
-
2017-04-28soldstatus 683-char remark
Show marketing remark (683 chars)
Livestock friendly with mature shade trees, this 1999 mobile home is located on 3/4 an acre. Home has 1,216 square feet of indoor living with spacious family room, dining area with built-in buffet and cabinets, and large laundry room with freezer space. Master bedroom suite with walk-in closet, separate shower, and corner garden tub. Home has been updated to non mobile home metal doors, fresh custom paint, updated A/C, and landscaped yard. An outdoor lovers paradise with front and back covered porches, garage is attached to the front porch, 20'X20' shop on slab with 220 & 110 electricity, storage shed, fenced and cross fenced for horses and donkeys, and a loafing shed.
-
2016-04-28$92,000 683-char remark
Show marketing remark (683 chars)
Livestock friendly with mature shade trees, this 1999 mobile home is located on 3/4 an acre. Home has 1,216 square feet of indoor living with spacious family room, dining area with built-in buffet and cabinets, and large laundry room with freezer space. Master bedroom suite with walk-in closet, separate shower, and corner garden tub. Home has been updated to non mobile home metal doors, fresh custom paint, updated A/C, and landscaped yard. An outdoor lovers paradise with front and back covered porches, garage is attached to the front porch, 20'X20' shop on slab with 220 & 110 electricity, storage shed, fenced and cross fenced for horses and donkeys, and a loafing shed.
ⓘ Source: listings_history table (triggers on properties + properties_extension) + one-shot
backfill from property_details.listing_events for pre-trigger history.
Tax reassessment forecast TX · Resets to sale price
- Current annual tax
- $731 · $61/mo
- Projected year-2 tax
- $2,288 · $191/mo
- Expected delta
- +$1,556/yr (+$130/mo · 212.9%)
ⓘ Screening estimate from a state-policy table — verify with the county assessor before closing.
Climate risk First Street
- Flood 1/10 Low FEMA zone X (unshaded) · 0% chance over 30 yrs
- Wildfire 4/10 Moderate
- Heat 8/10 Severe 7 d/yr ≥110°F today · 22 d/yr by 30 yrs out
- Wind 8/10 Severe 80% chance of damaging wind over 30 yrs
- Air quality 1/10 Low 0 unhealthy d/yr today · 0 by 30 yrs out
Nearby sold comps map
Loading sold comps map…
Walkable amenities ~0.75 mi
Loading nearby amenities…
Taxation est. · year 1
- Rental income
- $21,778
- − Mortgage interest
- −$7,002
- − Property taxes
- −$731
- − Insurance
- −$625
- − Repairs & maintenance
- −$1,742
- − Management
- −$1,742
- − Depreciation
- −$3,636
- Taxable income
- $6,299
- Est. tax owed @ 24.0%
- −$1,512
- After-tax cash flow
- $6,471/yr
For passive investors: Depreciation is non-cash, so a rental often shows a tax loss while cash-flowing — sheltering income. Rental losses are passive: they offset passive income freely, and up to $25,000/yr can offset ordinary (W-2) income if you actively participate and your MAGI is under $100k (phasing out to $0 by $150k); unused losses carry forward. On sale, claimed depreciation is recaptured at up to 25%, and gains may owe capital-gains tax (a 1031 exchange can defer both). Figures are a year-1 estimate at your 24.0% rate — not tax advice; consult a CPA.
Schools (NCES district)
- District
- Bryan ISD
- NCES district ID
- 4811790
- Math proficiency
- 30% ▼ -8.00%
- Reading proficiency
- 32% ▼ -3.00%
- Median HH income
- $41,895
- Composite
- 26.26/100
- National rank
- #7253
- State rank
- #608 of 826 in TX
Livability — Lake Bryan
- Score
- 65/100
- State rank
- #722
- US rank
- #13455
Category grades
Schools grade is shown separately in the Schools card above.
Census & demographics
- Census place
- Lake Bryan, TX
- County
- Brazos County · 233,400 people
- Metro
- College Station-Bryan, TX
- Population (ZIP)
- 13,227
- Household income
- $74,375
- Rent vs Own
- Severe rent burden
- 629.0
Population outlook (Brazos County) Hauer SSP2
- Today (2025)
- 267,942 people
- By 2030
- 296,630 · +10.7%
- By 2040
- 354,560 · +32.3%
- By 2050
- 414,616 · +54.7%
- By 2075
- 562,158 · +109.8%
- By 2100
- 678,828 · +153.3%
Race, ethnicity, and origin ACS 2023
- Neighborhood character
- Diverse neighborhood (Simpson 0.67)
- Race & ethnicity
- White 45% Hispanic / Latino 32% Two or more races 18% Black 14% Native American 3% Asian 2%
- Hispanic origin (detail)
- Mexican 29%
- Common ancestry
- Romanian 2% Lithuanian 2% Italian 2%
- Foreign-born
- 16% · Canada, Guatemala, Vietnam
- Languages at home
- 71% English-only · Spanish 24% Other Asian/Pacific 1% French/Haitian/Cajun 1%
Political lean MEDSL · Brazos
- 2024 margin
- Strong R (+24.9) · D 36.9% · R 61.7% · Other 1.4%
- 2008→2024 swing
- +4.1pp toward D · 2008: -28.9pp · 2024: -24.9pp
- All cycles
- 2024: R+24.9 2020: R+14.3 2016: R+23.7 2012: R+35.3 2008: R+28.9
Not yet ingested
- Civics
- —
Market trends
- HPI YoY
- ▼ -114.38%
- Current HPI
- 186.1387
- Rent YoY
- —
- Metro
- College Station-Bryan, TX
- State GDP YoY
- ▲ 3.95%
- F500 in state
- 110
Industry mix (Fortune 500 HQ in TX)
| Industry | F500 HQs | Revenue |
|---|---|---|
| Energy | 16 | $1,198B |
|
||
| Technology | 5 | $198B |
|
||
| Engineering / Construction | 4 | $72B |
|
||
| Energy Services | 3 | $60B |
|
||
| Utilities | 3 | $41B |
|
||
| Healthcare | 2 | $330B |
|
||
Price history
+8.6% since first listed5 events — show timeline
- 2026-04-10 Sold (Public Records) — Public Records
- 2019-08-29 Listed $99,900 BCSRMLS
- 2017-05-02 Sold (Public Records) — Public Records
- 2017-04-28 Sold (MLS) — BCSRMLS
- 2016-04-28 Listed $92,000 BCSRMLS
Property tax history
+1.0%/yrLatest (2025): $731 · -1.9% YoY. Source: county tax records.
Cash-flow waterfall
monthlySold comps — $/sqft
last 12 mo · ≤1 miLoading sold comps…