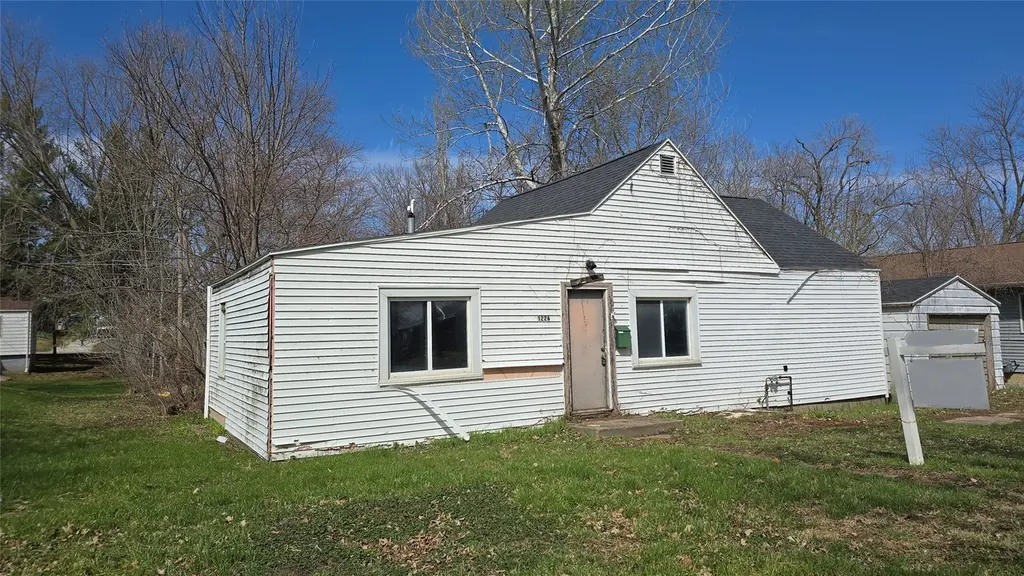
1226 Bauch St · Waterloo, IA
Flood risk 1/10 · Minimal
- FEMA flood zone
- X (unshaded)
- Chance of flooding over 30 yrs
- 0.0%
- Est. flood insurance / yr
- $507 – $1,088
Fire risk 1/10 · Minimal
- Est. fire insurance / yr
- $902 – $1,676
Heat risk 3/10 · Minor
- Hot days now (above 101°F)
- 7 days/yr
- Hot days in 30 yrs
- 15 days/yr
Wind risk 2/10 · Minimal
- Chance of severe wind over 30 yrs
- —
Air-quality risk 1/10 · Minimal
- Unhealthy air days now
- 0 days/yr
- Unhealthy air days in 30 yrs
- 0 days/yr
Risk factors via First Street. Map © Google.
Why this score? — see what drove the B grade
The composite is a weighted blend of 9 inputs, each scored 0–100. Each bar is that input's sub-score; the figure is the points it added to the 100-point composite (weight × sub-score).
- Cash flow +30.0/30.0
- 1% rule +10.0/10.0
- DSCR +10.0/10.0
- ARV discount +7.5/15.0
- Schools +4.4/10.0
- Livability +4.0/5.0
- Rent growth +3.5/5.0
- Condition / age +2.5/5.0
- Appreciation +0.0/10.0
$27,900
🖨 Deal sheet 📄 Offer letter ✓ Due diligence
Listing remarks MLS
Contractor special! This property needs rehabbed. The property has been taken down to studs. So Make it exactly like you want and make it special.
Key facts
- 8,000 sq ft lot
- Garage
- Built 1937
Neighborhood map
What this means for you Summary
Snapshot
- This is a 2-bed/1.0-bath single-family listed at $28k.
Deal economics
- At list price, monthly cash flow is $680 ($8k/yr) — positive.
- The deal already cash-flows at list — no discount required.
- Meets the 1% rule at list price ($1k rent vs $28k).
- Recommended offer: $26k (6.0% below list) — sets the bar for market timing.
- Cap rate 35.5% vs local median 4.2% in Waterloo — top-decile yield for the area; either an underpriced asset or a hidden risk that comps aren't pricing in. Stress-test before assuming the spread holds.
Location & tenants
- Location reads 81/100 on livability (#74 in IA, #1,589 nationally) — a professional / high-income tenant draw. Strengths: commute A+, cost of living A+, housing A+; Watch: schools C-, crime F, employment D-.
- Waterloo Community School District (urban): math 50% / reading 54% proficiency, ranked #276 of 289 in IA (top 96%) — acceptable for families but not a draw, mixed tenant base, ~2y average lease.
- Market conditions: Rents rising (+3.8%/yr); 282 active listings in the ZIP; 12 comparable units currently listed for rent nearby; rentals lingering (median 44d on market — plan ~5-8 weeks vacancy on turnover, expect pricing pressure); 75% of comp listings sitting > 30 days — soft ceiling on asking rent; 287 units permitted in Black Hawk County in 2024 (67 in 5+ unit buildings).
Forward outlook
- Local home prices are declining (-3.0%/yr); year-one equity from $193 of loan paydown is wiped out by about $837 of value loss. Plan a longer hold.
- Black Hawk County population projected at +10% by 2050 — modest demand growth; plan on rents tracking national, not racing it.
- At projected returns (-3.0% appreciation + 3.8% rent growth), your $8k cash investment doubles in ~2 years — after that, you're playing with house money.
Negotiation context
- It's been on market 64 days — a 6% lower offer ($26k) is reasonable based on typical stale-listing flexibility.
- 2 sale attempts since 9y ago with the ask held roughly flat each time — persistent listings suggest the price (not the market) is what's stuck; bring a comps-based counter.
- Current owner paid $18k; list at $28k implies a 59% gain — meaningful room to come down on a strong offer.
Risks & watch-outs
- Watch-outs: built in 1937 — expect roof / HVAC / electrical / plumbing capex.
Questions for the listing agent
- It's been on market 64 days. Have you received any prior offers? Is the seller open to a 6% concession, seller financing, or rate buy-down credit?
- Built in 1937 — when were the roof, HVAC, electrical panel, plumbing, and water heater last replaced?
- Why hasn't it sold? Are there any deal-killer items the seller is aware of (foundation, flood, title, zoning, code violations)?
- Is there a deadline driving the sale (1031 exchange, divorce, estate, relocation)? That informs how much negotiation room exists.
- Crime grade is F in this area — have there been break-ins, vandalism, or insurance claims at this property in the last 3 years? What carrier currently insures it and at what premium?
- What's the average days-on-market for RENTAL listings here right now (not sales)? A rising rental-DOM trend means longer vacancies and softer asking-rent achievability than the comps imply.
- What's the recent tenant-quality profile in this submarket — average credit score on applications, eviction rate, late-payment / NSF rate, and stable-employment percentage? A property-management company in the area should have these aggregated.
- How much new for-sale + rental construction is in the pipeline within 1–3 miles? Heavy new supply typically softens prices + rents 12–24 months out; constrained supply supports both.
Investment metrics
- 1% rule
- 3.96% ✓
- Cap rate
- 35.54%
- Cash-on-cash
- 104.47%
- DSCR
- 5.65
- GRM
- 2.1
CMA / ARV
- ARV (median comp)
- $159,175
- List price
- $27,900
- Delta
- -82.47%
- Verdict
- UNDERPRICED
- Comps
- 20 within 1.0 mi
Show comp detail 12 sales within ~0.75 mi
| Address | Dist | Beds/Ba | Sqft | Sold | Price | $/sf | Match |
|---|---|---|---|---|---|---|---|
| 432 Auburn St | 0.19mi | 3/2.0 (+1) | 1,271 (+4%) | 8mo | $160,000 | $126 | 68 |
| 520 Hanna Blvd | 0.13mi | 3/1.0 (+1) | 1,088 (-10%) | 5mo | $180,000 | $165 | 67 |
| 600 Beverly Hills St | 0.37mi | 3/1.5 (+1) | 1,285 (+6%) | 3mo | $195,000 | $152 | 64 |
| 725 Harwood Ave | 0.40mi | 3/2.0 (+1) | 1,183 (-3%) | 7mo | $187,000 | $158 | 62 |
| 1906 Coachman Dr | 0.40mi | 3/2.0 (+1) | 1,325 (+9%) | 2mo | $239,000 | $180 | 56 |
| 1742 Sager Ave | 0.67mi | 3/1.0 (+1) | 1,114 (-8%) | 4mo | $195,000 | $175 | 46 |
| 106 Berlin St | 0.65mi | 3/2.0 (+1) | 1,317 (+8%) | 3mo | $187,000 | $142 | 44 |
| 117 Axlewood Dr | 0.52mi | 3/2.0 (+1) | 1,392 (+14%) | 1mo | $279,000 | $200 | 42 |
| 131 Axlewood Dr | 0.54mi | 3/2.0 (+1) | 1,392 (+14%) | 2mo | $274,000 | $197 | 40 |
| 1219 Dundee Ave | 0.72mi | 2/1.0 | 1,036 (-15%) | 5mo | $85,000 | $82 | 38 |
| 323 Hartman Ave | 0.68mi | 3/2.0 (+1) | 1,380 (+14%) | 7mo | $170,300 | $123 | 31 |
| 421 Norris Ct | 0.74mi | 3/1.5 (+1) | 1,392 (+14%) | 7mo | $200,000 | $144 | 29 |
Match score weights: distance 35% · size 25% · config 20% · recency 20%. Top-matched comps best support the ARV.
Projected returns pro-forma
-3.0% appreciation · 3.8% rent growth · sell at horizon
- IRR
- —
- Equity multiple
- 6.08×
- Total profit
- $39,709
- Equity at exit
- $4,160
- IRR
- —
- Equity multiple
- 13.05×
- Total profit
- $94,161
- Equity at exit
- $2,412
Cash invested: $7,812 (down + closing). Projections, not guarantees.
Landlord ↔ Tenant lean methodology
- Overall (STATE)
- 83 Strongly Landlord-Friendly
- State Iowa
- 83 Strongly Landlord-Friendly · R+6
- County
- — inherits STATE
- City
- — inherits STATE
ZIP-level market 50701
- Rents YoY
- 3.8%
- Active inventory
- 282
- Price-to-rent
- 2.1×
Monthly cashflow live
- Estimated rent
- $1,105 high interval (Pro) →
- Mortgage (P&I)
- −$146
- Tax est. 1.5%
- −$35 /mo · $418/yr
- Insurance
- −$12
- HOA
- −$0
- Vacancy / Maint / Mgmt
- −$232
- Net cashflow
- $680
Break-even live
UW: 25.0% down · 7.5% · 30yr · 1.5% tax · 5.0% vac · 8.0% maint · 8.0% mgmt
Financing live
Cash to close
- Down payment
- $6,975
- Closing costs
- $837
- Reserves months
- —
- Total cash needed
- —
Loan-product check · same deal, 3 products live
Conventional
25% down · 7.5% · 30yr
- Down + closing
- —
- Monthly P&I
- —
- Monthly cashflow
- —
- DSCR
- —
- Eligible?
- —
Personal DTI + credit; lowest rate.
DSCR
20% down · 8.5% · 30yr
- Down + closing
- —
- Monthly P&I
- —
- Monthly cashflow
- —
- DSCR
- —
- Eligible?
- —
No personal income docs; deal must DSCR.
Hard money
10% down · 12.0% · 12mo
- Down + closing
- —
- Monthly P&I
- —
- Monthly cashflow
- —
- DSCR
- —
- Eligible?
- —
Short-term bridge; refi at stabilization.
Rent comps 12 comps
| Address | Beds | Baths | Sqft | Rent | $/sqft | DOM | Units | Dist |
|---|---|---|---|---|---|---|---|---|
| 425 Auburn St Waterloo, IA | 3.0 | 1.0 | 983 | $1,450 | $1.48 | 43d | 1 | 0.19mi |
| 1653 Carriage Hill Dr #1 Waterloo, IA | 2.0 | 1.0 | 721 | $795 | $1.10 | 21d | 1 | 0.35mi |
| 2215 Falls Ave Waterloo, IA | 3.0 | 1.0 | 1290 | $1,400 | $1.09 | 43d | 1 | 0.47mi |
| 1115 Doreen Ave Unit 1115-12 Waterloo, IA | 2.0 | 1.0 | 800 | $785 | $0.98 | 43d | 1 | 0.55mi |
| 1115 Doreen Ave Unit 1120-3 Waterloo, IA | 3.0 | 1.0 | 865 | $890 | $1.03 | 43d | 1 | 0.55mi |
| 136 Janney Ave Waterloo, IA | 2.0 | 2.0 | 901 | $1,325 | $1.47 | 43d | 1 | 0.93mi |
| 3621 Sager Ave Waterloo, IA | 2.0 | 1.0 | 851 | $795 | $0.93 | 43d | 1 | 1.03mi |
| 1118 Tiffany Pl #3 Waterloo, IA | 1.0 | 1.0 | 718 | $750 | $1.04 | 43d | 1 | 1.08mi |
| 1118 Tiffany Pl #12 Waterloo, IA | 2.0 | 1.0 | 851 | $795 | $0.93 | 21d | 1 | 1.08mi |
| 1132 Tiffany Pl Waterloo, IA | 2.0 | 1.0 | 857 | $795 | $0.93 | 43d | 1 | 1.08mi |
| 1124 Kern St Waterloo, IA | 2.0 | 1.0 | 740 | $950 | $1.28 | 43d | 1 | 1.24mi |
| 2539 W 3rd St Waterloo, IA | 3.0 | 2.5 | 1200 | $1,695 | $1.41 | 21d | 1 | 1.36mi |
Listing history 20 events
-
2026-06-19days on market $27,900 Active 64 DOM
-
2026-06-18days on market $27,900 Active 63 DOM
-
2026-06-17days on market $27,900 Active 62 DOM
-
2026-06-16days on market $27,900 Active 61 DOM
-
2026-06-15days on market $27,900 Active 60 DOM
-
2026-06-14days on market $27,900 Active 58 DOM
-
2026-06-13days on market $27,900 Active 57 DOM
-
2026-06-10days on market $27,900 Active 55 DOM
-
2026-06-09days on market $27,900 Active 54 DOM
-
2026-06-08days on market $27,900 Active 53 DOM
-
2026-06-07days on market $27,900 Active 52 DOM
-
2026-06-05days on market $27,900 Active 49 DOM
-
2026-06-03days on market $27,900 Active 48 DOM
-
2026-06-02days on market $27,900 Active 47 DOM
-
2026-06-01days on market $27,900 Active 46 DOM
-
2026-05-31days on market $27,900 Active 45 DOM
-
2026-05-30days on market $27,900 Active 44 DOM
-
2026-04-16$27,900 Active 146-char remark
Show marketing remark (146 chars)
Contractor special! This property needs rehabbed. The property has been taken down to studs. So Make it exactly like you want and make it special.
-
2017-03-30soldstatus $17,500 96-char remark
Show marketing remark (96 chars)
2 bedroom, 1 bathroom single story home available for well below assessed value. Needs some TLC.
-
2017-02-15$24,900 96-char remark
Show marketing remark (96 chars)
2 bedroom, 1 bathroom single story home available for well below assessed value. Needs some TLC.
ⓘ Source: listings_history table (triggers on properties + properties_extension) + one-shot
backfill from property_details.listing_events for pre-trigger history.
Climate risk First Street
- Flood 1/10 Low FEMA zone X (unshaded) · 0% chance over 30 yrs
- Wildfire 1/10 Low
- Heat 3/10 Moderate 7 d/yr ≥101°F today · 15 d/yr by 30 yrs out
- Wind 2/10 Low
- Air quality 1/10 Low 0 unhealthy d/yr today · 0 by 30 yrs out
Nearby sold comps map
Loading sold comps map…
Walkable amenities ~0.75 mi
Loading nearby amenities…
Taxation est. · year 1
- Rental income
- $13,260
- − Mortgage interest
- −$1,563
- − Property taxes
- −$418
- − Insurance
- −$140
- − Repairs & maintenance
- −$1,061
- − Management
- −$1,061
- − Depreciation
- −$812
- Taxable income
- $8,206
- Est. tax owed @ 24.0%
- −$1,969
- After-tax cash flow
- $6,192/yr
For passive investors: Depreciation is non-cash, so a rental often shows a tax loss while cash-flowing — sheltering income. Rental losses are passive: they offset passive income freely, and up to $25,000/yr can offset ordinary (W-2) income if you actively participate and your MAGI is under $100k (phasing out to $0 by $150k); unused losses carry forward. On sale, claimed depreciation is recaptured at up to 25%, and gains may owe capital-gains tax (a 1031 exchange can defer both). Figures are a year-1 estimate at your 24.0% rate — not tax advice; consult a CPA.
Schools (NCES district)
- District
- Waterloo Community School District
- NCES district ID
- 1930480
- Math proficiency
- 50% ▼ -4.00%
- Reading proficiency
- 54% ▲ 1.00%
- Median HH income
- $42,545
- Composite
- 43.72/100
- National rank
- #2950
- State rank
- #276 of 289 in IA
Livability — Waterloo
- Score
- 81/100
- State rank
- #74
- US rank
- #1589
Category grades
Schools grade is shown separately in the Schools card above.
Census & demographics
- Census place
- Waterloo, IA
- County
- Black Hawk County · 112,933 people
- City population
- 69,066
- Metro
- Waterloo-Cedar Falls, IA
- Population (ZIP)
- 30,232
- Household income
- $61,475
- Rent vs Own
- Severe rent burden
- 1377.0
Population outlook (Black Hawk County) Hauer SSP2
- Today (2025)
- 139,716 people
- By 2030
- 142,853 · +2.2%
- By 2040
- 147,843 · +5.8%
- By 2050
- 153,247 · +9.7%
- By 2075
- 167,977 · +20.2%
- By 2100
- 177,320 · +26.9%
Race, ethnicity, and origin ACS 2023
- Neighborhood character
- Predominantly White (78%)
- Race & ethnicity
- White 78% Black 11% Two or more races 5% Hispanic / Latino 3% Asian 3%
- Common ancestry
- Portuguese 3% Italian 3% American 2%
- Foreign-born
- 7% · Canada, South Korea, Vietnam
- Languages at home
- 92% English-only · Russian/Polish/Slavic 2% Spanish 2% French/Haitian/Cajun 2%
Political lean MEDSL · Black Hawk
- 2024 margin
- Toss-up / Even · D 50.0% · R 48.8% · Other 1.2%
- 2008→2024 swing
- -21.3pp toward R · 2008: 22.4pp · 2024: 1.2pp
- All cycles
- 2024: D+1.2 2020: D+9.0 2016: D+7.3 2012: D+20.0 2008: D+22.4
Not yet ingested
- Civics
- —
Market trends
- HPI YoY
- ▼ -107.19%
- Current HPI
- 162.8951
- Rent YoY
- ▲ 3.80%
- Metro
- Waterloo-Cedar Falls, IA
- State GDP YoY
- ▲ 2.48%
- F500 in state
- 4
Industry mix (Fortune 500 HQ in IA)
| Industry | F500 HQs | Revenue |
|---|---|---|
| Financial Services | 1 | $16B |
|
||
| Retail / Convenience | 1 | $15B |
|
||
Price history
+12.0% since first listed3 events — show timeline
- 2026-04-16 Listed $27,900 DMMLS
- 2017-03-30 Sold (MLS) $17,500 NEIRBR as distributed by MLS GRID
- 2017-02-15 Listed $24,900 NEIRBR as distributed by MLS GRID
Property tax history
-0.6%/yrLatest (2025): $1,462 · +43.9% YoY. Source: county tax records.
Cash-flow waterfall
monthlySold comps — $/sqft
last 12 mo · ≤1 miLoading sold comps…