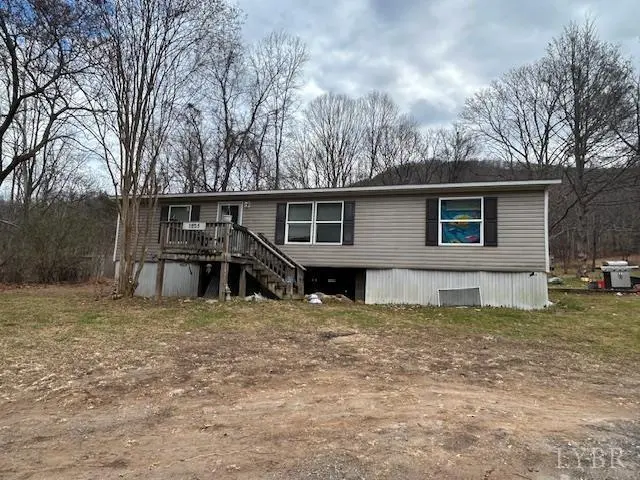
1959 Sweet Hollow Rd · Big Island, VA
Flood risk 1/10 · Minimal
- FEMA flood zone
- X (unshaded)
- Chance of flooding over 30 yrs
- 0.0%
- Est. flood insurance / yr
- $507 – $1,088
Fire risk 5/10 · Moderate
- Est. fire insurance / yr
- $666 – $1,236
Heat risk 4/10 · Minor
- Hot days now (above 99°F)
- 7 days/yr
- Hot days in 30 yrs
- 16 days/yr
Wind risk 2/10 · Minimal
- Chance of severe wind over 30 yrs
- 1.0%
Air-quality risk 2/10 · Minimal
- Unhealthy air days now
- 0 days/yr
- Unhealthy air days in 30 yrs
- 1 days/yr
Risk factors via First Street. Map © Google.
Why this score? — see what drove the C- grade
The composite is a weighted blend of 9 inputs, each scored 0–100. Each bar is that input's sub-score; the figure is the points it added to the 100-point composite (weight × sub-score).
- Cash flow +16.2/30.0
- ARV discount +7.5/15.0
- Appreciation +5.6/10.0
- Schools +5.5/10.0
- DSCR +5.0/10.0
- Livability +3.6/5.0
- 1% rule +3.2/10.0
- Rent growth +2.5/5.0
- Condition / age +2.5/5.0
$150,000
🖨 Deal sheet 📄 Offer letter ✓ Due diligence
Listing remarks
Great starter home or investment property. This 3 bedroom, 2 bath home sits on 2 acres in the beautiful northside of Bedford County. Partial fencing on the back of the property. Storage Buildings. Open kitchen with breakfast area and an island. Large laundry/utility room. Lots of potential.
Key facts
- Partial fencing
- 2 acres
- Storage buildings
Tags
Property features AI
Exterior
- Home design: Residential property; Built in 2018
- Exterior features: Approximately 2 acres
Interior
- Bedrooms: 3 bedrooms (all on the main level)
- Flooring: Carpet; Laminate; Vinyl
- Bathrooms: 2 full bathrooms (both on the main level)
- Heating & cooling: Heat pump heating; Heat pump cooling
- Interior features: 6 total rooms; Crawl space basement
Neighborhood map
What this means for you Summary
Snapshot
- This is a 3-bed/1.0-bath single-family listed at $150k.
Deal economics
- At list price, monthly cash flow is $80 ($961/yr) — positive.
- The deal already cash-flows at list — no discount required.
- To meet the 1% rule (rent ≥ 1% of price), the offer needs to be $123k (18.1% below list).
- Recommended offer: $123k (18.1% below list) — sets the bar for 1% rule.
Location & tenants
- Location reads 71/100 on livability (#209 in VA) — a middle-class / working-renter tenant base. Strengths: cost of living A+, housing A+, health & safety A+; Watch: crime C-, employment D, amenities F.
- Bedford County Public School District (rural): math 55% / reading 73% proficiency, ranked #41 of 131 in VA (top 31%) — acceptable for families but not a draw, mixed tenant base, ~2y average lease.
- Zoned schools: Big Island Elementary (math 74% / reading 74%, grade A, #220 of 1,108 statewide, top 22%, 149 students, 69% FRL); Liberty Middle (math 49% / reading 67%, grade B, #174 of 342 statewide, top 51%, 535 students, 86% FRL); Liberty High (math 41% / reading 68%, grade C-, #281 of 319 statewide, top 90%, 726 students, 69% FRL) — zoned schools average 75% FRL vs 30% district-wide (45 pts higher); higher-poverty schools than district average — tighter screening recommended.
- Market conditions: 17 active listings in the ZIP; 294 units permitted in Bedford County in 2024 (0 in 5+ unit buildings).
Forward outlook
- In year one you build about $3k of equity ($1k loan paydown + $2k appreciation (1.2% local appreciation)).
- Bedford County population projected at +8% by 2050 — modest demand growth; plan on rents tracking national, not racing it.
- At projected returns (1.2% appreciation + 3.0% rent growth), your $42k cash investment doubles in ~8 years — after that, you're playing with house money.
Negotiation context
- It's been on market 57 days — a 3% lower offer ($146k) is reasonable based on typical stale-listing flexibility.
- 4 sale attempts with the ask held roughly flat each time — persistent listings suggest the price (not the market) is what's stuck; bring a comps-based counter.
Risks & watch-outs
- Climate carrying-cost: moderate wildfire risk — expect insurance premiums to compound above CPI over the hold.
Questions for the listing agent
- It's been on market 57 days. Have you received any prior offers? Is the seller open to a 18% concession, seller financing, or rate buy-down credit?
- Is there a deadline driving the sale (1031 exchange, divorce, estate, relocation)? That informs how much negotiation room exists.
- Schools are A-rated — typically a magnet for longer-tenancy family renters. What's the average tenant stay here, and is there a school-zone premium baked into asking?
- What's the average days-on-market for RENTAL listings here right now (not sales)? A rising rental-DOM trend means longer vacancies and softer asking-rent achievability than the comps imply.
- What's the recent tenant-quality profile in this submarket — average credit score on applications, eviction rate, late-payment / NSF rate, and stable-employment percentage? A property-management company in the area should have these aggregated.
- How much new for-sale + rental construction is in the pipeline within 1–3 miles? Heavy new supply typically softens prices + rents 12–24 months out; constrained supply supports both.
Investment metrics
- 1% rule
- 0.82% ✗
- Cap rate
- 6.93%
- Cash-on-cash
- 2.29%
- DSCR
- 1.10
- GRM
- 10.2
CMA / ARV
No comps found within radius.
Projected returns pro-forma
1.17% appreciation · 3.0% rent growth · sell at horizon
- IRR
- 4.2%
- Equity multiple
- 1.22×
- Total profit
- $9,056
- Equity at exit
- $52,506
- IRR
- 8.4%
- Equity multiple
- 2.04×
- Total profit
- $43,845
- Equity at exit
- $70,791
Cash invested: $42,000 (down + closing). Projections, not guarantees.
Landlord ↔ Tenant lean methodology
- Overall (STATE)
- 55 Moderately Landlord-Leaning
- State Virginia
- 55 Moderately Landlord-Leaning · D+2
- County
- — inherits STATE
- City
- — inherits STATE
ZIP-level market 24526
- Home prices YoY
- 0.6%
- Active inventory
- 17
- Price-to-rent
- 10.2×
Monthly cashflow live
- Estimated rent
- $1,228 medium interval (Pro) →
- Mortgage (P&I)
- −$787
- Tax from tax record
- −$41 /mo · $490/yr
- Insurance
- −$62
- HOA
- −$0
- Vacancy / Maint / Mgmt
- −$258
- Net cashflow
- $80
Break-even live
UW: 25.0% down · 7.5% · 30yr · 1.5% tax · 5.0% vac · 8.0% maint · 8.0% mgmt
Financing live
Cash to close
- Down payment
- $37,500
- Closing costs
- $4,500
- Reserves months
- —
- Total cash needed
- —
Loan-product check · same deal, 3 products live
Conventional
25% down · 7.5% · 30yr
- Down + closing
- —
- Monthly P&I
- —
- Monthly cashflow
- —
- DSCR
- —
- Eligible?
- —
Personal DTI + credit; lowest rate.
DSCR
20% down · 8.5% · 30yr
- Down + closing
- —
- Monthly P&I
- —
- Monthly cashflow
- —
- DSCR
- —
- Eligible?
- —
No personal income docs; deal must DSCR.
Hard money
10% down · 12.0% · 12mo
- Down + closing
- —
- Monthly P&I
- —
- Monthly cashflow
- —
- DSCR
- —
- Eligible?
- —
Short-term bridge; refi at stabilization.
Listing history 22 events
-
2026-06-19days on market $150,000 Active 57 DOM
-
2026-06-18days on market $150,000 Active 56 DOM
-
2026-06-17days on market $150,000 Active 55 DOM
-
2026-06-16days on market $150,000 Active 54 DOM
-
2026-06-15days on market $150,000 Active 53 DOM
-
2026-06-14days on market $150,000 Active 51 DOM
-
2026-06-13days on market $150,000 Active 50 DOM
-
2026-06-10days on market $150,000 Active 48 DOM
-
2026-06-09days on market $150,000 Active 47 DOM
-
2026-06-08days on market $150,000 Active 46 DOM
-
2026-06-07days on market $150,000 Active 45 DOM
-
2026-06-05days on market $150,000 Active 42 DOM
-
2026-06-03days on market $150,000 Active 41 DOM
-
2026-06-02days on market $150,000 Active 40 DOM
-
2026-06-01days on market $150,000 Active 39 DOM
-
2026-05-31days on market $150,000 Active 38 DOM
-
2026-05-30days on market $150,000 Active 37 DOM
-
2026-04-23$150,000 Active 291-char remark
-
2026-04-23$150,000 Active 291-char remark
-
2026-02-18historical
-
2025-12-31$150,000 Active
-
2025-12-31$150,000 Active
ⓘ Source: listings_history table (triggers on properties + properties_extension) + one-shot
backfill from property_details.listing_events for pre-trigger history.
Tax reassessment forecast VA · Resets to sale price
- Current annual tax
- $490 · $41/mo
- Projected year-2 tax
- $1,230 · $102/mo
- Expected delta
- +$740/yr (+$62/mo · 151.0%)
ⓘ Screening estimate from a state-policy table — verify with the county assessor before closing.
Climate risk First Street
- Flood 1/10 Low FEMA zone X (unshaded) · 0% chance over 30 yrs
- Wildfire 5/10 Major
- Heat 4/10 Moderate 7 d/yr ≥99°F today · 16 d/yr by 30 yrs out
- Wind 2/10 Low 100% chance of damaging wind over 30 yrs
- Air quality 2/10 Low 0 unhealthy d/yr today · 1 by 30 yrs out
Nearby sold comps map
Loading sold comps map…
Walkable amenities ~0.75 mi
Loading nearby amenities…
Taxation est. · year 1
- Rental income
- $14,735
- − Mortgage interest
- −$8,402
- − Property taxes
- −$490
- − Insurance
- −$750
- − Repairs & maintenance
- −$1,179
- − Management
- −$1,179
- − Depreciation
- −$4,364
- Taxable loss
- −$1,629
- Est. tax savings @ 24.0%
- +$391
- After-tax cash flow
- $1,352/yr
For passive investors: Depreciation is non-cash, so a rental often shows a tax loss while cash-flowing — sheltering income. Rental losses are passive: they offset passive income freely, and up to $25,000/yr can offset ordinary (W-2) income if you actively participate and your MAGI is under $100k (phasing out to $0 by $150k); unused losses carry forward. On sale, claimed depreciation is recaptured at up to 25%, and gains may owe capital-gains tax (a 1031 exchange can defer both). Figures are a year-1 estimate at your 24.0% rate — not tax advice; consult a CPA.
Schools (NCES district)
- District
- Bedford County Public School District
- NCES district ID
- 5100360
- Math proficiency
- 55% ▼ -29.00%
- Reading proficiency
- 73% ▼ -7.00%
- Median HH income
- $56,288
- Composite
- 54.92/100
- National rank
- #1310
- State rank
- #41 of 131 in VA
Livability — Big Island
- Score
- 71/100
- State rank
- #209
- US rank
- #6577
Category grades
Schools grade is shown separately in the Schools card above.
Census & demographics
- Population (ZIP)
- 1,374
Population outlook (Bedford County) Hauer SSP2
- Today (2025)
- 83,194 people
- By 2030
- 85,499 · +2.8%
- By 2040
- 88,834 · +6.8%
- By 2050
- 90,060 · +8.3%
- By 2075
- 94,131 · +13.1%
- By 2100
- 89,832 · +8.0%
Race, ethnicity, and origin ACS 2023
- Neighborhood character
- Predominantly White (91%)
- Race & ethnicity
- White 91% Black 7%
- Common ancestry
- Slovak 4% Serbian 1%
- Foreign-born
- 0% · Canada
Political lean MEDSL · Bedford
- 2024 margin
- Solid R (+50.4) · D 24.4% · R 74.8%
- 2008→2024 swing
- -13.0pp toward R · 2008: -37.4pp · 2024: -50.4pp
- All cycles
- 2024: R+50.4 2020: R+48.1 2016: R+49.4 2012: R+45.0 2008: R+37.4
Not yet ingested
- Civics
- —
Market trends
- HPI YoY
- ▲ 1.17%
- Current HPI
- 207.6262
- Rent YoY
- —
- Metro
- —
- State GDP YoY
- ▲ 2.40%
- F500 in state
- 50
Industry mix (Fortune 500 HQ in VA)
| Industry | F500 HQs | Revenue |
|---|---|---|
| Aerospace / Defense | 4 | $236B |
|
||
| Technology / Defense | 3 | $32B |
|
||
| Financial Services | 2 | $176B |
|
||
| Utilities | 2 | $27B |
|
||
| Insurance | 2 | $25B |
|
||
| Technology | 2 | $15B |
|
||
Price history
+0.0% since first listed5 events — show timeline
- 2026-04-23 Listed $150,000 LMLS
- 2026-04-23 Listed $150,000 MLSRV
- 2026-02-18 Listing Removed — MLSRV
- 2025-12-31 Listed $150,000 LMLS
- 2025-12-31 Listed $150,000 MLSRV
Property tax history
+2.8%/yrLatest (2025): $490 · +0.0% YoY. Source: county tax records.
Cash-flow waterfall
monthlySold comps — $/sqft
last 12 mo · ≤1 miLoading sold comps…