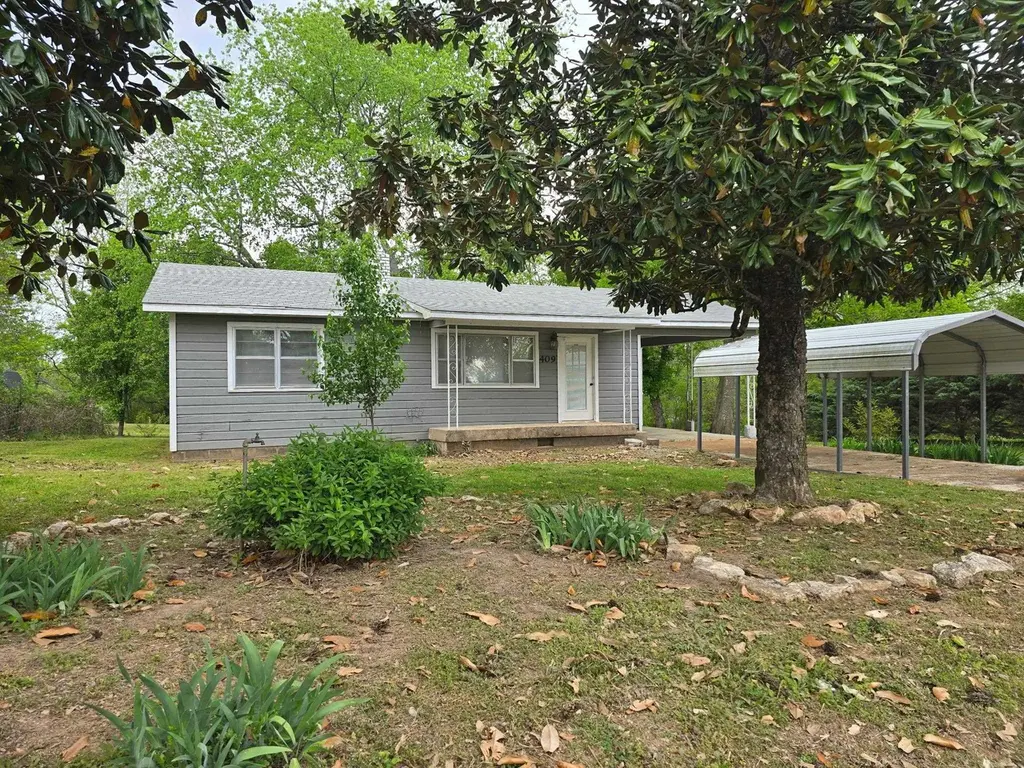
409 S 2nd St · Ravenden, AR
Flood risk No data
- FEMA flood zone
- —
- Chance of flooding over 30 yrs
- —
- Est. flood insurance / yr
- —
Fire risk No data
- Est. fire insurance / yr
- —
Heat risk No data
- Hot days now (above threshold)
- —
- Hot days in 30 yrs
- —
Wind risk No data
- Chance of severe wind over 30 yrs
- —
Air-quality risk No data
- Unhealthy air days now
- —
- Unhealthy air days in 30 yrs
- —
Risk factors via First Street. Map © Google.
Why this score? — see what drove the C+ grade
The composite is a weighted blend of 9 inputs, each scored 0–100. Each bar is that input's sub-score; the figure is the points it added to the 100-point composite (weight × sub-score).
- Cash flow +22.4/30.0
- ARV discount +15.0/15.0
- DSCR +7.2/10.0
- Appreciation +5.0/10.0
- 1% rule +4.5/10.0
- Livability +3.1/5.0
- Rent growth +2.5/5.0
- Condition / age +2.5/5.0
- Schools +2.3/10.0
$89,900
🖨 Deal sheet 📄 Offer letter ✓ Due diligence
Listing remarks
Perfect starter home situated on a spacious 0.3-acre lot in town. Home is 815sf and features 2 bedrooms and one bathroom. The home has been freshly painted and new floor covering throughout the house. Newer shingles and HVAC unit ensure's comfort year-round. New countertops and freshly painted cabinets in the kitchen and bathroom. Enjoy the pretty landscaped yard and walking distance to the city park, and just 0.3 miles from the spring river access, perfect for outdoor enthusiasts. This charming home is ready for you to create lasting memories. Don’t miss the opportunity to make it your own!
Key facts
- Newer shingles
- New hvac unit
- New countertops
Tags
Property features AI
Exterior
- Parking: Parking pads
- Utilities: Public water
- Home design: Single-family property; Inside city limits
- Construction: Crawl space foundation
- Exterior features: Masonite exterior; Composition roof; Paved road access; Level, cleared lot inside a subdivision
Interior
- Flooring: Laminate
- Bathrooms: 1 full bathroom
- Heating & cooling: Central cooling (electric); Central heating (gas)
- Interior features: Laminate flooring; Playground access nearby
Neighborhood map
What this means for you Summary
Snapshot
- This is a 2-bed/1.0-bath single-family listed at $90k.
Deal economics
- At list price, monthly cash flow is $149 ($2k/yr) — positive.
- The deal already cash-flows at list — no discount required.
- To meet the 1% rule (rent ≥ 1% of price), the offer needs to be $85k (5.1% below list).
- Recommended offer: $85k (5.1% below list) — sets the bar for 1% rule.
Location & tenants
- Location reads 61/100 on livability (#241 in AR) — a middle-class / working-renter tenant base. Strengths: cost of living A+, housing A+, health & safety A; Watch: crime C-, amenities F, commute F.
- Sloan-Hendrix School District (rural): math 28% / reading 28% proficiency, ranked #171 of 238 in AR (top 72%) — low school quality limits family demand, transient renter base, plan for 1-2y turnover.
- Zoned schools: Sloan-Hendrix Elem. School (math 37% / reading 22%, grade F, #305 of 454 statewide, top 71%, 440 students, 69% FRL); Sloan-Hendrix High School (math 22% / reading 31%, grade F, #180 of 292 statewide, top 62%, 365 students, 62% FRL).
- Market conditions: 26 active listings in the ZIP; 63 units permitted in Lawrence County in 2024 (15 in 5+ unit buildings).
Forward outlook
- In year one you build about $3k of equity ($622 loan paydown + $3k appreciation (3.0% local appreciation)).
- Lawrence County population projected at -23% by 2050 — secular population decline; favor cash flow + early exit over multi-decade hold.
- At projected returns (3.0% appreciation + 3.0% rent growth), your $25k cash investment doubles in ~5 years — after that, you're playing with house money.
- By year 10, paydown + projected appreciation supports a ~$32k cash-out refi (75% LTV) — recoverable capital for the next deal without selling this one.
Negotiation context
- It's been on market 51 days — a 3% lower offer ($87k) is reasonable based on typical stale-listing flexibility.
Questions for the listing agent
- It's been on market 51 days. Have you received any prior offers? Is the seller open to a 5% concession, seller financing, or rate buy-down credit?
- Built in 1970 — when were the roof, HVAC, electrical panel, plumbing, and water heater last replaced?
- Is there a deadline driving the sale (1031 exchange, divorce, estate, relocation)? That informs how much negotiation room exists.
- Schools are F-rated, which usually means shorter tenancies and higher turnover. Who's the typical renter profile here, and what's been the actual vacancy rate?
- What's the average days-on-market for RENTAL listings here right now (not sales)? A rising rental-DOM trend means longer vacancies and softer asking-rent achievability than the comps imply.
- What's the recent tenant-quality profile in this submarket — average credit score on applications, eviction rate, late-payment / NSF rate, and stable-employment percentage? A property-management company in the area should have these aggregated.
- How much new for-sale + rental construction is in the pipeline within 1–3 miles? Heavy new supply typically softens prices + rents 12–24 months out; constrained supply supports both.
Investment metrics
- 1% rule
- 0.95% ✗
- Cap rate
- 8.28%
- Cash-on-cash
- 7.10%
- DSCR
- 1.32
- GRM
- 8.8
CMA / ARV
- ARV (median comp)
- $133,152
- List price
- $89,900
- Delta
- -32.48%
- Verdict
- UNDERPRICED
- Comps
- 2 within 2.0 mi
Projected returns pro-forma
3.0% appreciation · 3.0% rent growth · sell at horizon
- IRR
- 14.1%
- Equity multiple
- 1.81×
- Total profit
- $20,275
- Equity at exit
- $40,423
- IRR
- 15.9%
- Equity multiple
- 3.34×
- Total profit
- $58,826
- Equity at exit
- $62,297
Cash invested: $25,172 (down + closing). Projections, not guarantees.
Landlord ↔ Tenant lean methodology
- Overall (STATE)
- 92 Strongly Landlord-Friendly
- State Arkansas
- 92 Strongly Landlord-Friendly · R+14
- County
- — inherits STATE
- City
- — inherits STATE
ZIP-level market 72459
- Active inventory
- 26
- Price-to-rent
- 8.8×
Monthly cashflow live
- Estimated rent
- $853 medium interval (Pro) →
- Mortgage (P&I)
- −$471
- Tax from tax record
- −$16 /mo · $193/yr
- Insurance
- −$37
- HOA
- −$0
- Vacancy / Maint / Mgmt
- −$179
- Net cashflow
- $149
Break-even live
UW: 25.0% down · 7.5% · 30yr · 1.5% tax · 5.0% vac · 8.0% maint · 8.0% mgmt
Financing live
Cash to close
- Down payment
- $22,475
- Closing costs
- $2,697
- Reserves months
- —
- Total cash needed
- —
Loan-product check · same deal, 3 products live
Conventional
25% down · 7.5% · 30yr
- Down + closing
- —
- Monthly P&I
- —
- Monthly cashflow
- —
- DSCR
- —
- Eligible?
- —
Personal DTI + credit; lowest rate.
DSCR
20% down · 8.5% · 30yr
- Down + closing
- —
- Monthly P&I
- —
- Monthly cashflow
- —
- DSCR
- —
- Eligible?
- —
No personal income docs; deal must DSCR.
Hard money
10% down · 12.0% · 12mo
- Down + closing
- —
- Monthly P&I
- —
- Monthly cashflow
- —
- DSCR
- —
- Eligible?
- —
Short-term bridge; refi at stabilization.
Listing history 17 events
-
2026-06-19days on market $89,900 Active 51 DOM
-
2026-06-18days on market $89,900 Active 50 DOM
-
2026-06-17days on market $89,900 Active 49 DOM
-
2026-06-16days on market $89,900 Active 48 DOM
-
2026-06-15days on market $89,900 Active 47 DOM
-
2026-06-14days on market $89,900 Active 45 DOM
-
2026-06-12days on market $89,900 Active 44 DOM
-
2026-06-09days on market $89,900 Active 41 DOM
-
2026-06-08days on market $89,900 Active 40 DOM
-
2026-06-07days on market $89,900 Active 39 DOM
-
2026-06-07statusdays on market $89,900 Active 38 DOM
-
2026-06-04days on market $89,900 Price Change 35 DOM
-
2026-06-02days on market $89,900 Price Change 34 DOM
-
2026-06-01days on market $89,900 Price Change 33 DOM
-
2026-05-31days on market $89,900 Price Change 32 DOM
-
2026-05-31pricestatusdays on market $89,900 Price Change 31 DOM
-
2026-04-29$105,000 New Listing 605-char remark
ⓘ Source: listings_history table (triggers on properties + properties_extension) + one-shot
backfill from property_details.listing_events for pre-trigger history.
Tax reassessment forecast AR · Resets to sale price
- Current annual tax
- $193 · $16/mo
- Projected year-2 tax
- $575 · $48/mo
- Expected delta
- +$382/yr (+$32/mo · 197.4%)
ⓘ Screening estimate from a state-policy table — verify with the county assessor before closing.
Nearby sold comps map
Loading sold comps map…
Walkable amenities ~0.75 mi
Loading nearby amenities…
Taxation est. · year 1
- Rental income
- $10,239
- − Mortgage interest
- −$5,036
- − Property taxes
- −$193
- − Insurance
- −$450
- − Repairs & maintenance
- −$819
- − Management
- −$819
- − Depreciation
- −$2,615
- Taxable income
- $307
- Est. tax owed @ 24.0%
- −$74
- After-tax cash flow
- $1,715/yr
For passive investors: Depreciation is non-cash, so a rental often shows a tax loss while cash-flowing — sheltering income. Rental losses are passive: they offset passive income freely, and up to $25,000/yr can offset ordinary (W-2) income if you actively participate and your MAGI is under $100k (phasing out to $0 by $150k); unused losses carry forward. On sale, claimed depreciation is recaptured at up to 25%, and gains may owe capital-gains tax (a 1031 exchange can defer both). Figures are a year-1 estimate at your 24.0% rate — not tax advice; consult a CPA.
Schools (NCES district)
- District
- Sloan-Hendrix School District
- NCES district ID
- 0512480
- Math proficiency
- 28% ▼ -6.00%
- Reading proficiency
- 28% ▼ -10.00%
- Median HH income
- $30,202
- Composite
- 22.66/100
- National rank
- #8048
- State rank
- #171 of 238 in AR
Livability — Ravenden
- Score
- 61/100
- State rank
- #241
- US rank
- #17868
Category grades
Schools grade is shown separately in the Schools card above.
Census & demographics
- Census place
- Ravenden, AR
- Population (ZIP)
- 1,351
Population outlook (Lawrence County) Hauer SSP2
- Today (2025)
- 15,453 people
- By 2030
- 14,697 · -4.9%
- By 2040
- 13,247 · -14.3%
- By 2050
- 11,937 · -22.8%
- By 2075
- 9,466 · -38.7%
- By 2100
- 7,441 · -51.8%
Race, ethnicity, and origin ACS 2023
- Neighborhood character
- Predominantly White (96%)
- Race & ethnicity
- White 96% Two or more races 3%
- Common ancestry
- Slovak 4% Lithuanian 2% Italian 1%
- Foreign-born
- 1%
- Languages at home
- 99% English-only · German/W. Germanic 1%
Political lean MEDSL · Lawrence
- 2024 margin
- Solid R (+64.0) · D 16.9% · R 81.0% · Other 2.1%
- 2008→2024 swing
- -43.1pp toward R · 2008: -20.9pp · 2024: -64.0pp
- All cycles
- 2024: R+64.0 2020: R+59.6 2016: R+49.8 2012: R+31.6 2008: R+20.9
Not yet ingested
- Civics
- —
Market trends
- HPI YoY
- —
- Current HPI
- —
- Rent YoY
- —
- Metro
- —
- State GDP YoY
- ▲ 3.80%
- F500 in state
- 10
Industry mix (Fortune 500 HQ in AR)
| Industry | F500 HQs | Revenue |
|---|---|---|
| Retail | 1 | $681B |
|
||
| Food / Agriculture | 1 | $53B |
|
||
| Retail / Energy | 1 | $22B |
|
||
| Transportation / Logistics | 1 | $12B |
|
||
| Energy | 1 | $4B |
|
||
Price history
-14.4% since first listed2 events — show timeline
- 2026-05-30 Price Changed $89,900 CARMLS
- 2026-04-29 Listed $105,000 CARMLS
Property tax history
+1.0%/yrLatest (2025): $193 · +0.0% YoY. Source: county tax records.
Cash-flow waterfall
monthlySold comps — $/sqft
last 12 mo · ≤1 miLoading sold comps…