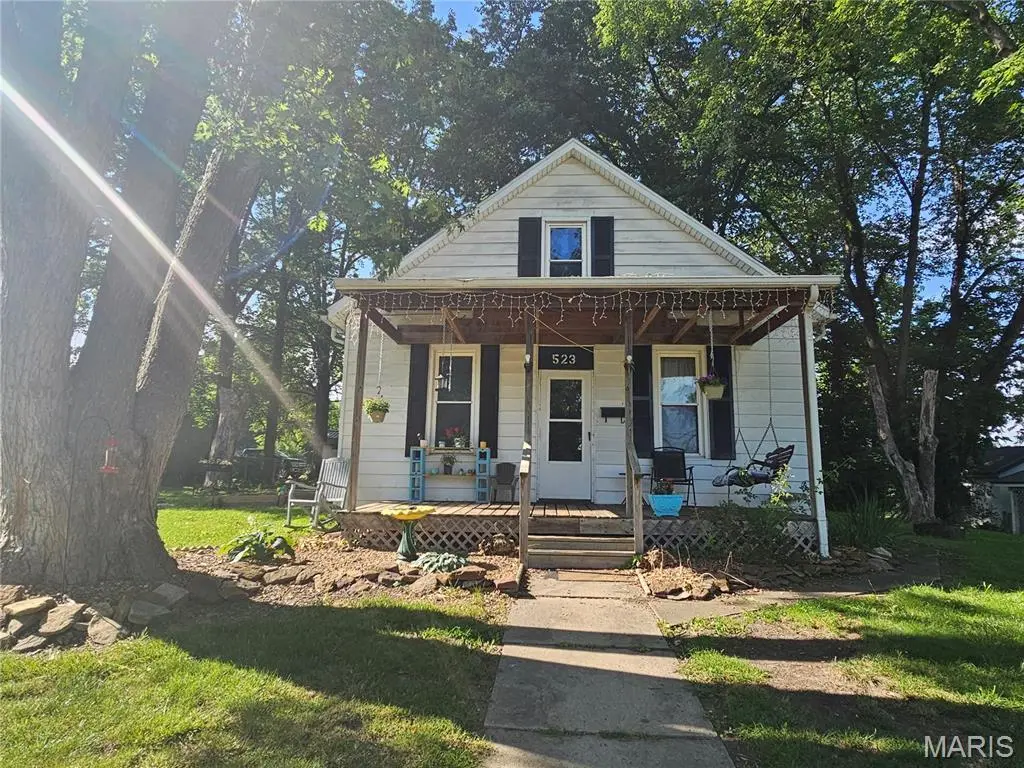
523 E Main St · Sparta, IL
Flood risk 1/10 · Minimal
- FEMA flood zone
- X (unshaded)
- Chance of flooding over 30 yrs
- 0.0%
- Est. flood insurance / yr
- $473 – $860
Fire risk 1/10 · Minimal
- Est. fire insurance / yr
- $804 – $1,492
Heat risk 5/10 · Moderate
- Hot days now (above 106°F)
- 7 days/yr
- Hot days in 30 yrs
- 21 days/yr
Wind risk 2/10 · Minimal
- Chance of severe wind over 30 yrs
- 2.0%
Air-quality risk 2/10 · Minimal
- Unhealthy air days now
- 0 days/yr
- Unhealthy air days in 30 yrs
- 1 days/yr
Risk factors via First Street. Map © Google.
Why this score? — see what drove the B- grade
The composite is a weighted blend of 9 inputs, each scored 0–100. Each bar is that input's sub-score; the figure is the points it added to the 100-point composite (weight × sub-score).
- Cash flow +30.0/30.0
- DSCR +10.0/10.0
- 1% rule +9.9/10.0
- ARV discount +7.5/15.0
- Livability +2.9/5.0
- Rent growth +2.5/5.0
- Condition / age +2.5/5.0
- Schools +1.2/10.0
- Appreciation +0.0/10.0
$62,000
🖨 Deal sheet 📄 Offer letter ✓ Due diligence
Listing remarks
Looking for the perfect starter home or a comfortable place to retire? This charming home in Sparta, IL on East Main St, could be just what you've been waiting for! Featuring 3 bedrooms, 1 full bath, a cozy living room, dining room, and kitchen, this home offers a practical layout with plenty of potential. Sitting on a generous lot, and includes a large two-car garage perfect for parking, storage, or a workshop. There is one bedroom on the main level and 2 on the second level sharing a spacious closet. With minimal TLC, this home could be a wonderful fit for its next owner.
Key facts
- 0.32 acre lot
- 2 garage spots
- Built 1952
Property features AI
Finance
- Other: Estimated living area 1,250; Estimated above-grade finished area 250; Estimated below-grade finished area 1,000; Taxes listed (2024)
- Financial info: Lease not considered; No second mortgage indicated
Exterior
- Parking: Garage and off-street parking; Two-car garage
- Utilities: Public water; Public sewer; Electric service (Ameren); Electricity connected; Natural gas connected
- Home design: Attached single-family residence; Two levels
- Construction: Vinyl siding; Block, full, unfinished walk-up basement
- Exterior features: Awning-covered porch; Deck; Private yard; Landscaped lot with front and back yard and a few trees; Irregular city lot
Interior
- Kitchen: Free-standing electric range; Refrigerator
- Bedrooms: Three bedrooms total (one on the main level, two on the upper level)
- Bathrooms: One full bathroom (main/upper levels)
- Heating & cooling: Natural gas heating; Central air conditioning
- Interior features: Free-standing electric range; Refrigerator; Central air; Natural gas heating
Neighborhood map
What this means for you Summary
Snapshot
- This is a 3-bed/1.0-bath single-family listed at $62k.
Deal economics
- At list price, monthly cash flow is $313 ($4k/yr) — positive.
- The deal already cash-flows at list — no discount required.
- Meets the 1% rule at list price ($921 rent vs $62k).
- Cap rate 12.4% vs local median 6.7% in Sparta — top-decile yield for the area; either an underpriced asset or a hidden risk that comps aren't pricing in. Stress-test before assuming the spread holds.
Location & tenants
- Location reads 58/100 on livability (#1,090 in IL) — a working-class tenant base; expect higher turnover. Strengths: cost of living A+, housing A+, crime B+; Watch: employment C-, amenities F, commute F.
- Sparta CUSD 140 (town): math 13% / reading 14% proficiency, ranked #535 of 620 in IL (top 86%) — low school quality limits family demand, transient renter base, plan for 1-2y turnover.
- Zoned schools: Sparta High School (math 12% / reading 8%, grade F, #567 of 693 statewide, top 83%, 327 students, 0% FRL) — zoned schools average 0% FRL vs 49% district-wide (49 pts lower); this property's tenant base skews higher-income than the district average.
- Market conditions: 31 active listings in the ZIP; 3 units permitted in Randolph County in 2024 (0 in 5+ unit buildings).
Forward outlook
- Local home prices are declining (-3.0%/yr); year-one equity from $429 of loan paydown is wiped out by about $2k of value loss. Plan a longer hold.
- Randolph County population projected at -14% by 2050 — secular population decline; favor cash flow + early exit over multi-decade hold.
- At projected returns (-3.0% appreciation + 3.0% rent growth), your $17k cash investment doubles in ~6 years — after that, you're playing with house money.
Negotiation context
- Only 10 days on market — expect competitive offers; lowballing is unlikely to land.
Risks & watch-outs
- Watch-outs: built in 1952 — expect roof / HVAC / electrical / plumbing capex.
- Climate carrying-cost: extreme-heat days projected 7→21/yr by 2055 (HVAC capex compounding) — expect insurance premiums to compound above CPI over the hold.
Questions for the listing agent
- Built in 1952 — when were the roof, HVAC, electrical panel, plumbing, and water heater last replaced?
- Is there a deadline driving the sale (1031 exchange, divorce, estate, relocation)? That informs how much negotiation room exists.
- Schools are F-rated, which usually means shorter tenancies and higher turnover. Who's the typical renter profile here, and what's been the actual vacancy rate?
- What's the average days-on-market for RENTAL listings here right now (not sales)? A rising rental-DOM trend means longer vacancies and softer asking-rent achievability than the comps imply.
- What's the recent tenant-quality profile in this submarket — average credit score on applications, eviction rate, late-payment / NSF rate, and stable-employment percentage? A property-management company in the area should have these aggregated.
- How much new for-sale + rental construction is in the pipeline within 1–3 miles? Heavy new supply typically softens prices + rents 12–24 months out; constrained supply supports both.
Investment metrics
- 1% rule
- 1.49% ✓
- Cap rate
- 12.36%
- Cash-on-cash
- 21.66%
- DSCR
- 1.96
- GRM
- 5.6
CMA / ARV
- ARV (on-the-fly)
- $137,500
- Comps found
- 12
Show comp detail 12 sales within ~0.75 mi
| Address | Dist | Beds/Ba | Sqft | Sold | Price | $/sf | Match |
|---|---|---|---|---|---|---|---|
| 504 E Main | 0.06mi | 3/1.0 | 1,353 (+8%) | 14mo | $50,000 | $37 | 72 |
| 206 S Dewey St | 0.15mi | 3/1.5 | 1,080 (-14%) | 2mo | $155,000 | $144 | 67 |
| 321 S Market St | 0.48mi | 3/1.0 | 1,337 (+7%) | 4mo | $147,500 | $110 | 63 |
| 307 W Church St | 0.58mi | 3/1.0 | 1,216 (-3%) | 8mo | $115,000 | $95 | 62 |
| 316 N St. Louis St | 0.54mi | 2/1.5 (-1) | 1,310 (+5%) | 2mo | $169,900 | $130 | 58 |
| 109 S Washington St | 0.27mi | 2/1.0 (-1) | 1,072 (-14%) | 1mo | $14,000 | $13 | 58 |
| 515 S Market St | 0.60mi | 3/1.5 | 1,326 (+6%) | 9mo | $160,000 | $121 | 52 |
| 221 W Belmont St | 0.75mi | 2/0.5 (-1) | 1,249 (-0%) | 8mo | $185,000 | $148 | 51 |
| 317 N Washington St | 0.34mi | 2/1.0 (-1) | 1,100 (-12%) | 10mo | $32,100 | $29 | 51 |
| 717 N Saint Louis St | 0.68mi | 2/2.0 (-1) | 1,302 (+4%) | 14mo | $126,000 | $97 | 41 |
| 305 Peggy Ln | 0.75mi | 3/2.0 | 1,112 (-11%) | 4mo | $125,000 | $112 | 39 |
| 700 N James St | 0.74mi | 3/4.0 | 1,196 (-4%) | 12mo | $70,000 | $59 | 36 |
Match score weights: distance 35% · size 25% · config 20% · recency 20%. Top-matched comps best support the ARV.
Projected returns pro-forma
-3.0% appreciation · 3.0% rent growth · sell at horizon
- IRR
- 14.3%
- Equity multiple
- 1.57×
- Total profit
- $9,916
- Equity at exit
- $9,244
- IRR
- 23.0%
- Equity multiple
- 2.98×
- Total profit
- $34,355
- Equity at exit
- $5,361
Cash invested: $17,360 (down + closing). Projections, not guarantees.
Landlord ↔ Tenant lean methodology
- Overall (STATE)
- 43 Moderately Tenant-Leaning
- State Illinois
- 43 Moderately Tenant-Leaning · D+7
- County
- — inherits STATE
- City
- — inherits STATE
ZIP-level market 62286
- Home prices YoY
- -31.0%
- Active inventory
- 31
- Price-to-rent
- 5.6×
Monthly cashflow live
- Estimated rent
- $921 medium interval (Pro) →
- Mortgage (P&I)
- −$325
- Tax from tax record
- −$64 /mo · $764/yr
- Insurance
- −$26
- HOA
- −$0
- Vacancy / Maint / Mgmt
- −$194
- Net cashflow
- $313
Break-even live
Sensitivity live
| Price | -10% $348 | -5% $331 | +0% $313 | +5% $296 | +10% $278 |
|---|---|---|---|---|---|
| Rent | -10% $241 | -5% $277 | +0% $313 | +5% $350 | +10% $386 |
| Rate | -1.0pp $345 | -0.5pp $329 | base $313 | +0.5pp $297 | +1.0pp $281 |
UW: 25.0% down · 7.5% · 30yr · 1.5% tax · 5.0% vac · 8.0% maint · 8.0% mgmt
Financing live
Cash to close
- Down payment
- $15,500
- Closing costs
- $1,860
- Reserves months
- —
- Total cash needed
- —
Loan-product check · same deal, 3 products live
Conventional
25% down · 7.5% · 30yr
- Down + closing
- —
- Monthly P&I
- —
- Monthly cashflow
- —
- DSCR
- —
- Eligible?
- —
Personal DTI + credit; lowest rate.
DSCR
20% down · 8.5% · 30yr
- Down + closing
- —
- Monthly P&I
- —
- Monthly cashflow
- —
- DSCR
- —
- Eligible?
- —
No personal income docs; deal must DSCR.
Hard money
10% down · 12.0% · 12mo
- Down + closing
- —
- Monthly P&I
- —
- Monthly cashflow
- —
- DSCR
- —
- Eligible?
- —
Short-term bridge; refi at stabilization.
Listing history 8 events
-
2026-06-18days on market $62,000 Active 10 DOM
-
2026-06-17days on market $62,000 Active 9 DOM
-
2026-06-16days on market $62,000 Active 8 DOM
-
2026-06-15days on market $62,000 Active 7 DOM
-
2026-06-13days on market $62,000 Active 5 DOM
-
2026-06-12days on market $62,000 Active 4 DOM
-
2026-06-09remarks 582-char remark
-
2026-06-09$62,000 Active 1 DOM
ⓘ Source: listings_history table (triggers on properties + properties_extension) + one-shot
backfill from property_details.listing_events for pre-trigger history.
Tax reassessment forecast IL · Partial reset (capped growth)
- Current annual tax
- $764 · $64/mo
- Projected year-2 tax
- $1,085 · $90/mo
- Expected delta
- +$322/yr (+$27/mo · 42.2%)
ⓘ Screening estimate from a state-policy table — verify with the county assessor before closing.
Climate risk First Street
- Flood 1/10 Low FEMA zone X (unshaded) · 0% chance over 30 yrs
- Wildfire 1/10 Low
- Heat 5/10 Major 7 d/yr ≥106°F today · 21 d/yr by 30 yrs out
- Wind 2/10 Low 2% chance of damaging wind over 30 yrs
- Air quality 2/10 Low 0 unhealthy d/yr today · 1 by 30 yrs out
Nearby sold comps map
Loading sold comps map…
Walkable amenities ~0.75 mi
Loading nearby amenities…
Taxation est. · year 1
- Rental income
- $11,057
- − Mortgage interest
- −$3,473
- − Property taxes
- −$764
- − Insurance
- −$310
- − Repairs & maintenance
- −$885
- − Management
- −$885
- − Depreciation
- −$1,804
- Taxable income
- $2,938
- Est. tax owed @ 24.0%
- −$705
- After-tax cash flow
- $3,055/yr
For passive investors: Depreciation is non-cash, so a rental often shows a tax loss while cash-flowing — sheltering income. Rental losses are passive: they offset passive income freely, and up to $25,000/yr can offset ordinary (W-2) income if you actively participate and your MAGI is under $100k (phasing out to $0 by $150k); unused losses carry forward. On sale, claimed depreciation is recaptured at up to 25%, and gains may owe capital-gains tax (a 1031 exchange can defer both). Figures are a year-1 estimate at your 24.0% rate — not tax advice; consult a CPA.
Schools (NCES district)
- District
- Sparta CUSD 140
- NCES district ID
- 1736900
- Math proficiency
- 13% ▼ -10.00%
- Reading proficiency
- 14% ▼ -13.00%
- Median HH income
- $43,992
- Composite
- 11.95/100
- National rank
- #9668
- State rank
- #535 of 620 in IL
Livability — Sparta
- Score
- 58/100
- State rank
- #1090
- US rank
- #20732
Category grades
Schools grade is shown separately in the Schools card above.
Census & demographics
- Census place
- Sparta, IL
- City population
- 5,482
- Population (ZIP)
- 5,482
Population outlook (Randolph County) Hauer SSP2
- Today (2025)
- 31,417 people
- By 2030
- 30,519 · -2.9%
- By 2040
- 28,841 · -8.2%
- By 2050
- 27,150 · -13.6%
- By 2075
- 22,569 · -28.2%
- By 2100
- 16,584 · -47.2%
Race, ethnicity, and origin ACS 2023
- Neighborhood character
- Predominantly White (82%)
- Race & ethnicity
- White 82% Black 10% Two or more races 7% Hispanic / Latino 3%
- Common ancestry
- Serbian 9% Lithuanian 2% Slovak 2%
- Languages at home
- 99% English-only · French/Haitian/Cajun 1%
Political lean MEDSL · Randolph
- 2024 margin
- Solid R (+50.0) · D 24.1% · R 74.1% · Other 1.7%
- 2008→2024 swing
- -49.0pp toward R · 2008: -0.9pp · 2024: -50.0pp
- All cycles
- 2024: R+50.0 2020: R+50.2 2016: R+46.8 2012: R+17.6 2008: R+0.9
Not yet ingested
- Civics
- —
Market trends
- HPI YoY
- ▼ -52.47%
- Current HPI
- 116.6798
- Rent YoY
- —
- Metro
- —
- State GDP YoY
- ▲ 1.59%
- F500 in state
- 60
Industry mix (Fortune 500 HQ in IL)
| Industry | F500 HQs | Revenue |
|---|---|---|
| Insurance | 4 | $201B |
|
||
| Consumer Goods | 4 | $87B |
|
||
| Industrial Machinery | 3 | $64B |
|
||
| Healthcare | 2 | $55B |
|
||
| Retail / Pharmacy | 1 | $148B |
|
||
| Agriculture / Food | 1 | $86B |
|
||
Price history
3 events — show timeline
- 2026-06-08 Listed $62,000 MARIS as Distributed by MLS Grid
- 2021-08-06 Listing Removed — RMLSA as Distributed by MLS Grid
- 2008-06-25 Listing Removed — MRED as Distributed by MLS Grid
Property tax history
+0.9%/yrLatest (2024): $764 · +6.5% YoY. Source: county tax records.
Cash-flow waterfall
monthlySold comps — $/sqft
last 12 mo · ≤1 miLoading sold comps…