 Multi-family
54 E 8th St · New York, NY
Flood risk 1/10 · Minimal
- FEMA flood zone
- X (unshaded)
- Chance of flooding over 30 yrs
- 0.0%
- Est. flood insurance / yr
- $507 – $1,088
Fire risk 1/10 · Minimal
- Est. fire insurance / yr
- $691 – $1,283
Heat risk 7/10 · Major
- Hot days now (above 99°F)
- 7 days/yr
- Hot days in 30 yrs
- 15 days/yr
Wind risk 6/10 · Moderate
- Chance of severe wind over 30 yrs
- 27.0%
Air-quality risk 4/10 · Minor
- Unhealthy air days now
- 5 days/yr
- Unhealthy air days in 30 yrs
- 7 days/yr
Risk factors via First Street. Map © Google.
Why this score? — see what drove the A- grade
The composite is a weighted blend of 9 inputs, each scored 0–100. Each bar is that input's sub-score; the figure is the points it added to the 100-point composite (weight × sub-score).
- Cash flow +30.0/30.0
- 1% rule +10.0/10.0
- DSCR +10.0/10.0
- Appreciation +9.7/10.0
- ARV discount +7.5/15.0
- Schools +5.0/10.0
- Rent growth +4.8/5.0
- Livability +3.8/5.0
- Condition / age +3.8/5.0
$1,095,000
🖨 Deal sheet 📄 Offer letter ✓ Due diligence
Multi-family units
County records classify this as Multi-Family (2-4 Unit). Listing-text estimate: 1 unit. estimate disagrees with records
Listing remarks
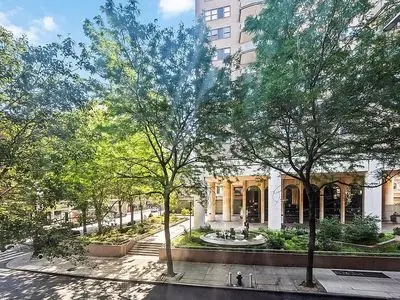
Beautiful Studio in the Heart of NoHo / Greenwich Village Welcome to 54 East 8th Street, perfectly positioned at the corner of Mercer and 8th. This sun-filled studio faces east, with charming views over tree-lined Mercer Street, a picturesque courtyard fountain, and the neighborhood & acirc; & euro; & trade; s iconic architecture. The location is truly unmatched. This pristine, move-in-ready home features a newly renovated kitchen with dishwasher and microwave, a modern, impeccably redone bathroom, a generous living area with a custom Murphy bed, and exceptional closet space & acirc; & euro; & rdquo; plus private storage available for rent. The building is pet-frien
Key facts
- Custom murphy bed
- Co op star rebate
- Built 1952
Tags
Neighborhood map
What this means for you Summary
Snapshot
- This is a ?-bed/1.0-bath multifamily listed at $1.09M. Condition is rated good.
Deal economics
- At list price, monthly cash flow is $8k ($93k/yr) — positive.
- The deal already cash-flows at list — no discount required.
- Meets the 1% rule at list price ($19k rent vs $1.09M).
- Cap rate 14.8% vs local median 2.6% in New York — top-decile yield for the area; either an underpriced asset or a hidden risk that comps aren't pricing in. Stress-test before assuming the spread holds.
Location & tenants
- Location reads 75/100 on livability (#268 in NY, #4,188 nationally) — a middle-class / working-renter tenant base. Strengths: amenities A+, commute A+, health & safety A; Watch: crime F, cost of living F.
- Market conditions: Rents rising fast (+9.2%/yr); 361 active listings in the ZIP; 40 comparable units currently listed for rent nearby; rentals at typical pace (median 19d on market — plan ~3-4 weeks tenant-placement turnaround); high-income renter base; 4,467 units permitted in New York County in 2024 (4,463 in 5+ unit buildings).
- At $19,402/mo this rent would consume 151% of the median local household income ($154k/yr) (locally 3480% of renters already pay >50% of income on rent) — very limited rent-growth headroom before tenants either downsize or default.
Forward outlook
- In year one you build about $110k of equity ($8k loan paydown + $102k appreciation (9.3% local appreciation)).
- New York County population projected at +21% by 2050 — long-run rental-demand tailwind backs the buy-and-hold thesis.
- At projected returns (9.3% appreciation + 8.0% rent growth), your $307k cash investment doubles in ~2 years — after that, you're playing with house money.
- By year 2, paydown + projected appreciation supports a ~$176k cash-out refi (75% LTV) — recoverable capital for the next deal without selling this one.
Negotiation context
- Only 11 days on market — expect competitive offers; lowballing is unlikely to land.
Risks & watch-outs
- Watch-outs: built in 1952 — expect roof / HVAC / electrical / plumbing capex.
- Climate carrying-cost: major wind risk, 27% chance of damaging wind over 30y; extreme-heat days projected 7→15/yr by 2055 (HVAC capex compounding) — expect insurance premiums to compound above CPI over the hold.
Questions for the listing agent
- Built in 1952 — when were the roof, HVAC, electrical panel, plumbing, and water heater last replaced?
- Is there a deadline driving the sale (1031 exchange, divorce, estate, relocation)? That informs how much negotiation room exists.
- Schools are B-rated — typically a magnet for longer-tenancy family renters. What's the average tenant stay here, and is there a school-zone premium baked into asking?
- Crime grade is F in this area — have there been break-ins, vandalism, or insurance claims at this property in the last 3 years? What carrier currently insures it and at what premium?
- What's the average days-on-market for RENTAL listings here right now (not sales)? A rising rental-DOM trend means longer vacancies and softer asking-rent achievability than the comps imply.
- What's the recent tenant-quality profile in this submarket — average credit score on applications, eviction rate, late-payment / NSF rate, and stable-employment percentage? A property-management company in the area should have these aggregated.
- How much new apartment / multifamily construction is in the pipeline within 1–3 miles? Heavy new supply (>2% of stock underway) typically softens rents 12–24 months out; light construction supports rent growth.
Investment metrics
- 1% rule
- 1.77% ✓
- Cap rate
- 14.80%
- Cash-on-cash
- 30.37%
- DSCR
- 2.35
- GRM
- 4.7
CMA / ARV
No comps found within radius.
Show comp detail 2 sales within ~0.75 mi
| Address | Dist | Beds/Ba | Sqft | Sold | Price | $/sf | Match |
|---|---|---|---|---|---|---|---|
| 10 W 15th St #1419 | 0.41mi | —/— | — | 15mo | $965,000 | — | 56 |
| 6 Charles St Unit BB | 0.46mi | 7/— | 2,402 | 18mo | $615,000 | $256 | 50 |
Match score weights: distance 35% · size 25% · config 20% · recency 20%. Top-matched comps best support the ARV.
Projected returns pro-forma
9.32% appreciation · 8.0% rent growth · sell at horizon
- IRR
- 49.6%
- Equity multiple
- 4.73×
- Total profit
- $1,142,739
- Equity at exit
- $932,515
- IRR
- 45.9%
- Equity multiple
- 11.50×
- Total profit
- $3,219,589
- Equity at exit
- $1,956,234
Cash invested: $306,600 (down + closing). Projections, not guarantees.
Landlord ↔ Tenant lean methodology
- Overall (CITY)
- 0 Strongly Tenant-Friendly
- State New York
- 15 Strongly Tenant-Friendly · D+10
- County
- — inherits STATE
- City New York
- 0 Strongly Tenant-Friendly · D+34
ZIP-level market 10003
- Home prices YoY
- 3.4%
- Rents YoY
- 9.2%
- Active inventory
- 361
- Price-to-rent
- 9.4×
Monthly cashflow live
- Estimated rent
- $19,402 high interval (Pro) →
- Mortgage (P&I)
- −$5,742
- Tax est. 1.5%
- −$1,369 /mo · $16,425/yr
- Insurance
- −$456
- HOA
- −$0
- Vacancy / Maint / Mgmt
- −$4,074
- Net cashflow
- $7,760
Break-even live
2-unit breakdown (identical units grouped — click to expand)
| Units | Beds | Baths | Est. rent |
|---|---|---|---|
| 2× units | 1 | 1 | $19,402 |
| #1 | 1 | 1 | $9,701 |
| #2 | 1 | 1 | $9,701 |
| Total (2 units) | $19,402 | ||
UW: 25.0% down · 7.5% · 30yr · 1.5% tax · 5.0% vac · 8.0% maint · 8.0% mgmt
Financing live
Cash to close
- Down payment
- $273,750
- Closing costs
- $32,850
- Reserves months
- —
- Total cash needed
- —
Loan-product check · same deal, 3 products live
Conventional
25% down · 7.5% · 30yr
- Down + closing
- —
- Monthly P&I
- —
- Monthly cashflow
- —
- DSCR
- —
- Eligible?
- —
Personal DTI + credit; lowest rate.
DSCR
20% down · 8.5% · 30yr
- Down + closing
- —
- Monthly P&I
- —
- Monthly cashflow
- —
- DSCR
- —
- Eligible?
- —
No personal income docs; deal must DSCR.
Hard money
10% down · 12.0% · 12mo
- Down + closing
- —
- Monthly P&I
- —
- Monthly cashflow
- —
- DSCR
- —
- Eligible?
- —
Short-term bridge; refi at stabilization.
Rent comps 40 comps
| Address | Beds | Baths | Sqft | Rent | $/sqft | DOM | Units | Dist |
|---|---|---|---|---|---|---|---|---|
| 60 E 8th St New York, NY | 2.0 | 2.0 | — | $11,000 | — | 24d | 1 | 0.06mi |
| 28 E 10th St Unit 10B New York, NY | 2.0 | 2.0 | 1375 | $16,000 | $11.64 | 5d | 1 | 0.10mi |
| 11 5th Ave Unit 20-X New York, NY | 2.0 | 1.0 | — | $7,900 | — | 7d | 1 | 0.12mi |
| 3 E 9th St Unit 1541442P New York, NY | 1.0–2.0 | 1.0 | 1119 | $15,690 | $14.02 | 5d | 2 | 0.14mi |
| 10 5th Ave Unit 1255906P New York, NY | 2.0 | 1.0 | 990 | $18,150 | $18.33 | 5d | 2 | 0.17mi |
| 815 Broadway #204 New York, NY | 1.0 | 1.0 | 522 | $8,250 | $15.80 | 7d | 1 | 0.19mi |
| 15 E 11th St New York, NY | 3.0 | 1.0 | — | $8,108 | — | 7d | 1 | 0.20mi |
| 101 E 10th St #1153 New York, NY | 1.0–2.0 | 1.0–2.0 | 575 | $16,510 | $28.71 | 2d | 2 | 0.28mi |
| 125 E 12th St Unit 1C New York, NY | 3.0 | 2.5 | 2059 | $20,000 | $9.71 | 5d | 1 | 0.30mi |
| 112 E 10th St Unit 1021937P New York, NY | 1.0–3.0 | 1.0–2.5 | 1296 | $13,688 | $10.56 | 3d | 2 | 0.30mi |
| 1 Union Sq S #1174 New York, NY | 2.0 | 1.0–2.0 | 775 | $13,210 | $17.05 | 10d | 3 | 0.30mi |
| 1 Union Sq S New York, NY | 1.0–2.0 | 1.5–2.0 | — | $14,320 | — | 24d | 3 | 0.30mi |
| 354 Bowery Unit 1035017P New York, NY | 1.0 | 1.0 | 1194 | $18,390 | $15.40 | 6d | 1 | 0.31mi |
| 145 4th Ave Unit 9F New York, NY | 2.0 | 2.0 | — | $9,900 | — | 24d | 1 | 0.31mi |
| 145 4th Ave New York, NY | 2.0 | 2.0 | — | $9,700 | — | 20d | 2 | 0.32mi |
| 145 4th Ave New York, NY | 2.0 | 2.0 | — | $9,075 | — | 7d | 3 | 0.32mi |
| 131 MacDougal St Unit 1503012P New York, NY | 1.0 | 1.0 | 1270 | $16,761 | $13.20 | 24d | 1 | 0.32mi |
| 364 6th Ave Unit 1023432P New York, NY | 1.0 | 1.0 | 441 | $9,135 | $20.71 | 22d | 1 | 0.34mi |
| 71 W 10th St New York, NY | 3.0 | 2.0 | — | $12,500 | — | 24d | 1 | 0.35mi |
| 202 E 13th St New York, NY | 3.0 | 2.0 | — | $8,995 | — | 19d | 1 | 0.36mi |
| 202 E 13th St New York, NY | 3.0 | 2.0 | — | $8,995 | — | 22d | 1 | 0.36mi |
| 202 E 13th St New York, NY | 3.0 | 2.0 | — | $8,995 | — | 24d | 1 | 0.36mi |
| 104 MacDougal St Unit 1056263P New York, NY | 2.0 | 1.0 | 441 | $9,375 | $21.26 | 22d | 1 | 0.37mi |
| 179 Sullivan St Unit 1255362P New York, NY | 1.0–2.0 | 1.0 | 1221 | $21,900 | $17.94 | 2d | 2 | 0.40mi |
| 179 Sullivan St Unit 1257494P New York, NY | 1.0 | 1.0 | 1248 | $21,900 | $17.55 | 24d | 1 | 0.40mi |
| 166 2nd Ave Unit 9KK New York, NY | 2.0 | 1.5 | 950 | $8,100 | $8.53 | 7d | 1 | 0.41mi |
| 181 W 4th St Unit 1316448P New York, NY | 1.0 | 1.0 | — | $20,003 | — | 24d | 1 | 0.42mi |
| 207 2nd Ave New York, NY | 3.0 | 1.0 | — | $8,250 | — | 7d | 2 | 0.43mi |
| 177 Waverly Pl Unit 1075286P New York, NY | 1.0 | 1.0 | 452 | $10,000 | $22.12 | 24d | 1 | 0.43mi |
| 212 E 10th St Unit 5A New York, NY | 3.0 | 2.0 | — | $11,500 | — | 7d | 1 | 0.43mi |
| 251 E 13th St New York, NY | 3.0 | 2.0 | — | $10,795 | — | 24d | 1 | 0.44mi |
| 251 E 13th St New York, NY | 3.0 | 2.0 | — | $10,795 | — | 7d | 1 | 0.44mi |
| 138 E 16th St New York, NY | 3.0 | 1.0 | — | $8,595 | — | 7d | 1 | 0.44mi |
| 51 E Houston St New York, NY | 3.0 | 2.0 | — | $10,500 | — | 24d | 1 | 0.45mi |
| 237 Bleecker St New York, NY | 2.0 | 3.0 | — | $8,800 | — | 24d | 1 | 0.45mi |
| 10 Sheridan Sq #949 New York, NY | 2.0 | 2.0 | 1000 | $12,050 | $12.05 | 20d | 1 | 0.46mi |
| 310 E 12th St Unit 5J New York, NY | 3.0 | 2.0 | — | $8,700 | — | 24d | 1 | 0.46mi |
| 37 Cornelia St New York, NY | 3.0 | 2.0 | — | $12,495 | — | 24d | 1 | 0.46mi |
| 11 E 1st St New York, NY | 2.0 | 1.0–2.0 | 1060 | $11,225 | $10.59 | 1d | 1 | 0.47mi |
| 540 6th Ave Unit 6A New York, NY | 1.0 | 1.0 | 793 | $8,450 | $10.66 | 7d | 1 | 0.48mi |
Listing history 7 events
-
2026-06-18days on market $1,095,000 Active 11 DOM
-
2026-06-17days on market $1,095,000 Active 10 DOM
-
2026-06-15days on market $1,095,000 Active 8 DOM
-
2026-06-13days on market $1,095,000 Active 6 DOM
-
2026-06-10days on market $1,095,000 Active 2 DOM
-
2026-06-08remarks 675-char remark
-
2026-06-08$1,095,000 Active 1 DOM
ⓘ Source: listings_history table (triggers on properties + properties_extension) + one-shot
backfill from property_details.listing_events for pre-trigger history.
Climate risk First Street
- Flood 1/10 Low FEMA zone X (unshaded) · 0% chance over 30 yrs
- Wildfire 1/10 Low
- Heat 7/10 Severe 7 d/yr ≥99°F today · 15 d/yr by 30 yrs out
- Wind 6/10 Major 27% chance of damaging wind over 30 yrs
- Air quality 4/10 Moderate 5 unhealthy d/yr today · 7 by 30 yrs out
Nearby sold comps map
Loading sold comps map…
Walkable amenities ~0.75 mi
Loading nearby amenities…
Taxation est. · year 1
- Rental income
- $232,824
- − Mortgage interest
- −$61,337
- − Property taxes
- −$16,425
- − Insurance
- −$5,475
- − Repairs & maintenance
- −$18,626
- − Management
- −$18,626
- − Depreciation
- −$31,855
- Taxable income
- $80,481
- Est. tax owed @ 24.0%
- −$19,315
- After-tax cash flow
- $73,808/yr
For passive investors: Depreciation is non-cash, so a rental often shows a tax loss while cash-flowing — sheltering income. Rental losses are passive: they offset passive income freely, and up to $25,000/yr can offset ordinary (W-2) income if you actively participate and your MAGI is under $100k (phasing out to $0 by $150k); unused losses carry forward. On sale, claimed depreciation is recaptured at up to 25%, and gains may owe capital-gains tax (a 1031 exchange can defer both). Figures are a year-1 estimate at your 24.0% rate — not tax advice; consult a CPA.
Condition & rehab AI · 2 photos
This move-in-ready studio in the heart of NoHo/Greenwich Village is in good condition with a well-maintained exterior and interior. It offers a prime location and modern updates, making it an attractive investment.
Value-add opportunities
- Both Landscaping — A well-maintained courtyard and landscaping can enhance both the resale and rental value of the property.
- Both Interior updates — A fresh coat of paint and minor updates to the interior can significantly enhance the home's appeal and value.
- Both Exterior updates — A fresh coat of paint and minor updates to the exterior can significantly enhance the home's appeal and value.
- Both Kitchen and bathroom updates — A fresh coat of paint and minor updates to the kitchen and bathroom can significantly enhance the home's appeal and value.
Renovation cost estimate screening
Value-add ROI direction
- Both Landscaping — A well-maintained courtyard and landscaping can enhance both the resale and rental value of the property. ↑
- Both Interior updates — A fresh coat of paint and minor updates to the interior can significantly enhance the home's appeal and value. ↑
- Both Exterior updates — A fresh coat of paint and minor updates to the exterior can significantly enhance the home's appeal and value. ↑
- Both Kitchen and bathroom updates — A fresh coat of paint and minor updates to the kitchen and bathroom can significantly enhance the home's appeal and value. ↑
ⓘ Cost ranges are severity-bucket heuristics (US national rule-of-thumb). Get contractor quotes + a written scope before underwriting a rehab budget.
Schools (NCES district)
No district data.
Livability — New York
- Score
- 75/100
- State rank
- #268
- US rank
- #4188
Category grades
Schools grade is shown separately in the Schools card above.
Census & demographics
- Census place
- New York, NY
- County
- New York County · 1,599,927 people
- City population
- 7,731,280
- Metro
- New York-Newark-Jersey City, NY-NJ-PA
- Population (ZIP)
- 53,560
- Household income
- $154,262
- Rent vs Own
- Severe rent burden
- 3480.0
Population outlook (New York County) Hauer SSP2
- Today (2025)
- 1,825,725 people
- By 2030
- 1,904,611 · +4.3%
- By 2040
- 2,052,719 · +12.4%
- By 2050
- 2,206,601 · +20.9%
- By 2075
- 2,509,427 · +37.4%
- By 2100
- 2,702,933 · +48.0%
Race, ethnicity, and origin ACS 2023
- Neighborhood character
- Majority White (64%)
- Race & ethnicity
- White 64% Asian 18% Hispanic / Latino 10% Two or more races 8% Black 4%
- Hispanic origin (detail)
- Puerto Rican 2%
- Common ancestry
- Scotch-Irish 5% Romanian 5% Lithuanian 3%
- Foreign-born
- 20% · Canada, China, South Korea
- Languages at home
- 78% English-only · Spanish 5% Chinese 4% French/Haitian/Cajun 3%
Political lean MEDSL · New York
- 2024 margin
- Solid D (+64.8) · D 82.4% · R 17.6%
- 2008→2024 swing
- -7.4pp toward R · 2008: 72.2pp · 2024: 64.8pp
- All cycles
- 2024: D+64.8 2020: D+74.5 2016: D+77.2 2012: D+69.6 2008: D+72.2
Not yet ingested
- Civics
- —
Market trends
- HPI YoY
- ▲ 9.32%
- Current HPI
- 284.9232
- Rent YoY
- ▲ 9.24%
- Metro
- New York-Newark-Jersey City, NY-NJ-PA
- State GDP YoY
- ▲ 2.60%
- F500 in state
- 92
Industry mix (Fortune 500 HQ in NY)
| Industry | F500 HQs | Revenue |
|---|---|---|
| Financial Services | 10 | $950B |
|
||
| Consumer Goods | 9 | $162B |
|
||
| Insurance | 4 | $225B |
|
||
| Telecommunications | 2 | $144B |
|
||
| Pharmaceuticals | 2 | $112B |
|
||
| Media / Entertainment | 2 | $69B |
|
||
Price history
1 event — show timeline
- 2026-06-08 Listed $1,095,000 FSBO.com
Cash-flow waterfall
monthlySold comps — $/sqft
last 12 mo · ≤1 miLoading sold comps…