 Multi-family
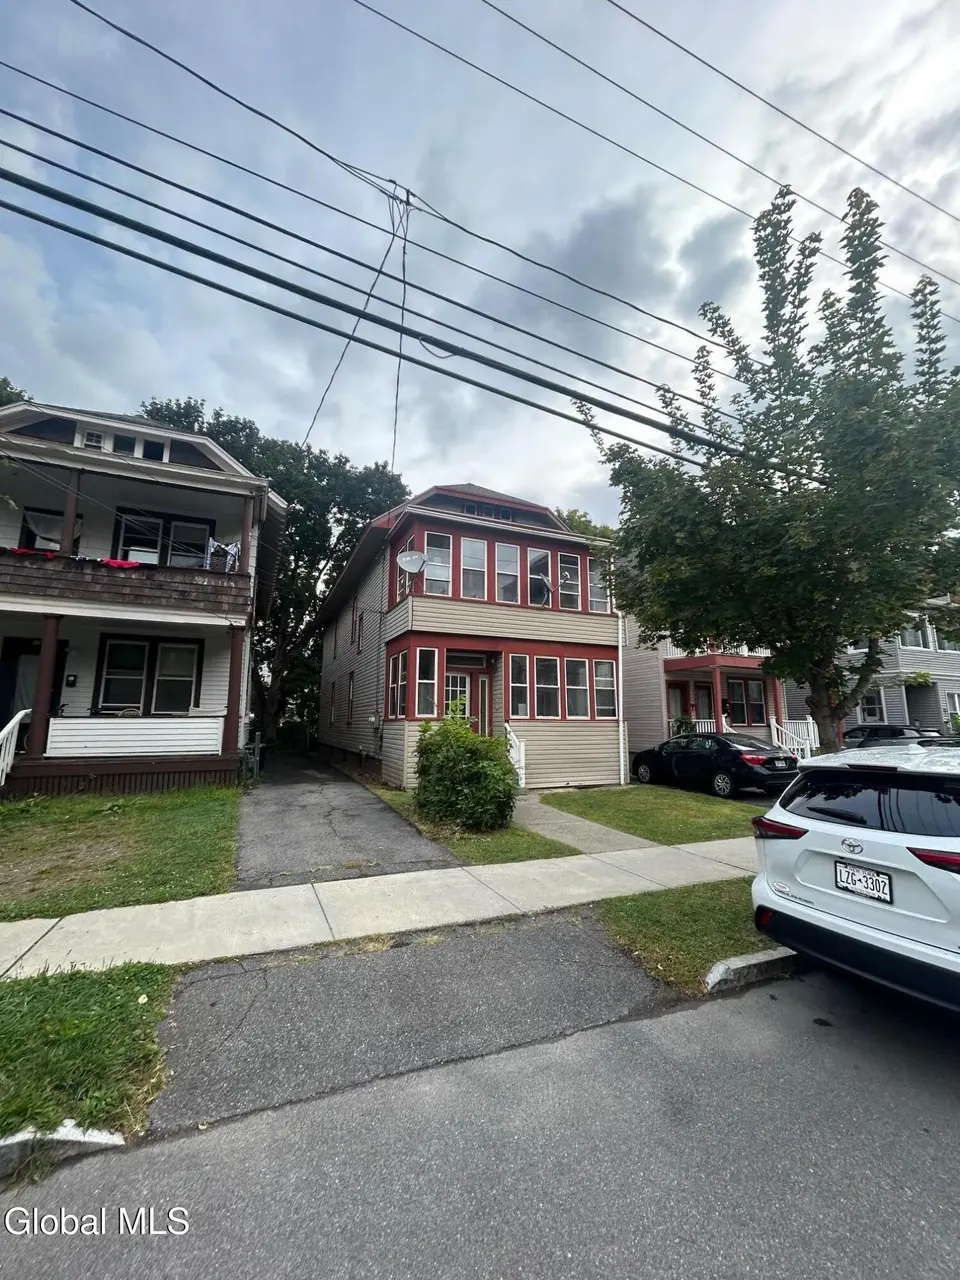
443 Myrtle Ave · Albany, NY
Flood risk 5/10 · Moderate
- FEMA flood zone
- X (unshaded)
- Chance of flooding over 30 yrs
- 0.54%
- Est. flood insurance / yr
- $473 – $860
Fire risk 1/10 · Minimal
- Est. fire insurance / yr
- $691 – $1,283
Heat risk 4/10 · Minor
- Hot days now (above 97°F)
- 7 days/yr
- Hot days in 30 yrs
- 17 days/yr
Wind risk 3/10 · Minor
- Chance of severe wind over 30 yrs
- 6.0%
Air-quality risk 1/10 · Minimal
- Unhealthy air days now
- 0 days/yr
- Unhealthy air days in 30 yrs
- 0 days/yr
Risk factors via First Street. Map © Google.
Why this score? — see what drove the D grade
The composite is a weighted blend of 9 inputs, each scored 0–100. Each bar is that input's sub-score; the figure is the points it added to the 100-point composite (weight × sub-score).
- Cash flow +18.9/30.0
- DSCR +6.0/10.0
- 1% rule +5.2/10.0
- Livability +4.0/5.0
- Rent growth +3.8/5.0
- Schools +3.2/10.0
- Condition / age +2.5/5.0
- ARV discount +0.0/15.0
- Appreciation +0.0/10.0
$349,900
🖨 Deal sheet 📄 Offer letter ✓ Due diligence
Multi-family units
County records classify this as Multi-Family (2-4 Unit). Listing-text estimate: 1 unit. estimate disagrees with records
Listing remarks MLS
off street parking for multiple cars VERY close to Albany Medical Center walk up attic seperate washer and dryer rooms in basement enclosed front and back porches
Key facts
- Large walk up attic
- Off street parking
- 3,049 sq ft lot
Tags
Property features AI
Finance
- Financial info: Two-unit multifamily property; tenants pay hot water, heat, internet, electricity, and gas; owner pays water, sewer, and trash collection
Exterior
- Parking: Paved parking for 4 vehicles
- Security: Carbon monoxide detector(s); Fire alarm
- Utilities: Public water; Public sewer; Circuit breakers for electric; Cable available
- Home design: Duplex; Living area approximately 2,040; Vinyl siding; Asphalt roof
- Construction: Vinyl siding construction
- Exterior features: Covered patio/porch; Level, cleared lot
Interior
- Bedrooms: Two 3-bedroom units (each unit has 3 bedrooms)
- Flooring: Vinyl; Tile; Carpet
- Bathrooms: Each unit has 1 full bath (2 total full baths)
- Heating & cooling: Hot water heating; Natural gas
- Interior features: Full, unfinished basement; Covered first- and second-floor bathrooms; Carbon monoxide detector(s); Fire alarm
- Laundry & utility: Dedicated laundry room
Neighborhood map
What this means for you Summary
Snapshot
- This is a 6-bed/2.0-bath multifamily listed at $350k.
Deal economics
- At list price, monthly cash flow is $361 ($4k/yr) — positive.
- The deal already cash-flows at list — no discount required.
- Meets the 1% rule at list price ($4k rent vs $350k).
- Recommended offer: $345k (1.5% below list) — sets the bar for market timing.
- Cap rate 7.5% vs local median 5.7% in Albany — top-decile yield for the area; either an underpriced asset or a hidden risk that comps aren't pricing in. Stress-test before assuming the spread holds.
Location & tenants
- Location reads 79/100 on livability (#129 in NY, #2,083 nationally) — a middle-class / working-renter tenant base. Strengths: amenities A+, commute A+, housing A+; Watch: employment C-, crime F.
- Albany City School District (urban): math 37% / reading 40% proficiency, ranked #543 of 590 in NY (top 92%) — families likely to look elsewhere, expect single-tenant / working-renter base with shorter leases; 66% free/reduced lunch — lower-income household profile, screen leases tightly.
- Zoned schools: Albany High School (math 74% / reading 67%, grade B+, #710 of 1,100 statewide, top 65%, 2,676 students, 69% FRL) — zoned schools at 69% FRL track the district average.
- Zoned-school proficiency averages 70% at this address vs 38% district-wide (+32 pts) — the actual schools serving this property are materially stronger than the Albany City School District average implies; a family-tenant draw the district grade alone would hide.
- Market conditions: Rents rising fast (+5.0%/yr); 99 active listings in the ZIP; 1 comparable units currently listed for rent nearby; 675 units permitted in Albany County in 2024 (451 in 5+ unit buildings).
Forward outlook
- Local home prices are declining (-3.0%/yr); year-one equity from $2k of loan paydown is wiped out by about $10k of value loss. Plan a longer hold.
- Albany County population projected at +9% by 2050 — modest demand growth; plan on rents tracking national, not racing it.
Negotiation context
- It's been on market 20 days — a 2% lower offer ($345k) is reasonable based on typical stale-listing flexibility.
- 10 sale attempts since 26y ago with the ask held roughly flat each time — persistent listings suggest the price (not the market) is what's stuck; bring a comps-based counter.
- Current owner paid $295k; 19% above their basis — modest negotiation headroom, anchor on the comps not their cost.
Risks & watch-outs
- Watch-outs: built in 1928 — expect roof / HVAC / electrical / plumbing capex.
- Climate carrying-cost: moderate flood risk — expect insurance premiums to compound above CPI over the hold.
Questions for the listing agent
- Built in 1928 — when were the roof, HVAC, electrical panel, plumbing, and water heater last replaced?
- Is there a deadline driving the sale (1031 exchange, divorce, estate, relocation)? That informs how much negotiation room exists.
- Crime grade is F in this area — have there been break-ins, vandalism, or insurance claims at this property in the last 3 years? What carrier currently insures it and at what premium?
- The area grade is low — what's the realistic commute time and amenity access for the typical tenant pool here? Any planned neighborhood developments (good or bad) we should know about?
- What's the average days-on-market for RENTAL listings here right now (not sales)? A rising rental-DOM trend means longer vacancies and softer asking-rent achievability than the comps imply.
- What's the recent tenant-quality profile in this submarket — average credit score on applications, eviction rate, late-payment / NSF rate, and stable-employment percentage? A property-management company in the area should have these aggregated.
- How much new apartment / multifamily construction is in the pipeline within 1–3 miles? Heavy new supply (>2% of stock underway) typically softens rents 12–24 months out; light construction supports rent growth.
Investment metrics
- 1% rule
- 1.02% ✓
- Cap rate
- 7.53%
- Cash-on-cash
- 4.43%
- DSCR
- 1.20
- GRM
- 8.2
CMA / ARV
- ARV (on-the-fly)
- $275,400
- Comps found
- 12
Show comp detail 12 sales within ~0.75 mi
| Address | Dist | Beds/Ba | Sqft | Sold | Price | $/sf | Match |
|---|---|---|---|---|---|---|---|
| 645 Myrtle Ave | 0.45mi | 6/2.0 | 2,000 (-2%) | 5mo | $270,000 | $135 | 71 |
| 157 Western Ave | 0.45mi | 7/2.0 (+1) | 2,144 (+5%) | 5mo | $215,000 | $100 | 61 |
| 380-382 Morris St | 0.27mi | 6/2.0 | 2,344 (+15%) | 3mo | $300,000 | $128 | 60 |
| 676 Providence St | 0.59mi | 5/2.0 (-1) | 2,118 (+4%) | 2mo | $250,000 | $118 | 60 |
| 538 Myrtle Ave | 0.22mi | 5/5.0 (-1) | 2,216 (+9%) | 2mo | $410,000 | $185 | 57 |
| 184 Quail St | 0.51mi | 6/3.0 | 1,853 (-9%) | 4mo | $231,000 | $125 | 53 |
| 531 Hamilton St | 0.61mi | 5/3.0 (-1) | 2,112 (+4%) | 5mo | $284,750 | $135 | 53 |
| 687 Myrtle Ave | 0.57mi | 6/2.0 | 2,238 (+10%) | 6mo | $310,000 | $139 | 52 |
| 189 Elk St | 0.73mi | 6/2.0 | 1,880 (-8%) | 2mo | $89,900 | $48 | 51 |
| 563 Morris St | 0.69mi | 6/2.0 | 2,224 (+9%) | 6mo | $275,000 | $124 | 48 |
| 391 Washington Ave | 0.53mi | 7/4.0 (+1) | 2,217 (+9%) | 5mo | $350,000 | $158 | 44 |
| 454 Ontario St | 0.59mi | 5/2.0 (-1) | 1,776 (-13%) | 5mo | $290,000 | $163 | 42 |
Match score weights: distance 35% · size 25% · config 20% · recency 20%. Top-matched comps best support the ARV.
Projected returns pro-forma
-3.0% appreciation · 5.05% rent growth · sell at horizon
- IRR
- -7.0%
- Equity multiple
- 0.73×
- Total profit
- $-26,078
- Equity at exit
- $52,171
- IRR
- 5.0%
- Equity multiple
- 1.40×
- Total profit
- $39,465
- Equity at exit
- $30,253
Cash invested: $97,972 (down + closing). Projections, not guarantees.
Landlord ↔ Tenant lean methodology
- Overall (STATE)
- 15 Strongly Tenant-Friendly
- State New York
- 15 Strongly Tenant-Friendly · D+10
- County
- — inherits STATE
- City
- — inherits STATE
ZIP-level market 12208
- Home prices YoY
- -30.1%
- Rents YoY
- 5.0%
- Active inventory
- 99
- Price-to-rent
- 16.3×
Monthly cashflow live
- Estimated rent
- $3,576 high interval (Pro) →
- Mortgage (P&I)
- −$1,835
- Tax from tax record
- −$483 /mo · $5,796/yr
- Insurance
- −$146
- HOA
- −$0
- Vacancy / Maint / Mgmt
- −$751
- Net cashflow
- $361
Break-even live
2-unit breakdown (identical units grouped — click to expand)
| Units | Beds | Baths | Est. rent |
|---|---|---|---|
| 2× units | 2 | 1 | $3,576 |
| #1 | 2 | 1 | $1,788 |
| #2 | 2 | 1 | $1,788 |
| Total (2 units) | $3,576 | ||
UW: 25.0% down · 7.5% · 30yr · 1.5% tax · 5.0% vac · 8.0% maint · 8.0% mgmt
Financing live
Cash to close
- Down payment
- $87,475
- Closing costs
- $10,497
- Reserves months
- —
- Total cash needed
- —
Loan-product check · same deal, 3 products live
Conventional
25% down · 7.5% · 30yr
- Down + closing
- —
- Monthly P&I
- —
- Monthly cashflow
- —
- DSCR
- —
- Eligible?
- —
Personal DTI + credit; lowest rate.
DSCR
20% down · 8.5% · 30yr
- Down + closing
- —
- Monthly P&I
- —
- Monthly cashflow
- —
- DSCR
- —
- Eligible?
- —
No personal income docs; deal must DSCR.
Hard money
10% down · 12.0% · 12mo
- Down + closing
- —
- Monthly P&I
- —
- Monthly cashflow
- —
- DSCR
- —
- Eligible?
- —
Short-term bridge; refi at stabilization.
Rent comps 1 comps
| Address | Beds | Baths | Sqft | Rent | $/sqft | DOM | Units | Dist |
|---|---|---|---|---|---|---|---|---|
| 69 Winthrop Ave Albany, NY | 6.0 | 2.0 | 2800 | $2,795 | $1.00 | 23d | 1 | 1.44mi |
Listing history 36 events
-
2026-06-14status $349,900 Pending 20 DOM
-
2026-06-10days on market $349,900 Active 20 DOM
-
2026-06-08days on market $349,900 Active 18 DOM
-
2026-06-07days on market $349,900 Active 17 DOM
-
2026-06-03days on market $349,900 Active 13 DOM
-
2026-06-02days on market $349,900 Active 12 DOM
-
2026-06-01days on market $349,900 Active 11 DOM
-
2026-05-31days on market $349,900 Active 10 DOM
-
2026-05-31days on market $349,900 Active 9 DOM
-
2026-05-21$349,900 Active
-
2025-10-29historical
-
2025-10-27historical $1,650
-
2025-10-20$339,900 Active
-
2025-10-13price $1,650
-
2025-09-11$1,750
-
2024-09-20soldstatus $295,000 Closed 166-char remark
Show marketing remark (166 chars)
off street parking for multiple cars VERY close to Albany Medical Center walk up attic seperate washer and dryer rooms in basement enclosed front and back porches
-
2024-06-10status Pending 166-char remark
Show marketing remark (166 chars)
off street parking for multiple cars VERY close to Albany Medical Center walk up attic seperate washer and dryer rooms in basement enclosed front and back porches
-
2024-06-07$289,000 Active 166-char remark
Show marketing remark (166 chars)
off street parking for multiple cars VERY close to Albany Medical Center walk up attic seperate washer and dryer rooms in basement enclosed front and back porches
-
2010-10-26soldstatus $165,500
-
2010-09-30soldstatus $165,400
-
2010-08-20historical
-
2009-06-16$168,800
-
2009-05-25historical
-
2008-11-24$188,500
-
2008-11-12historical
-
2008-10-23$199,900
-
2008-10-01historical
-
2008-06-04$199,900
-
2005-03-16soldstatus $175,000
-
2005-03-14soldstatus $175,000
-
2005-02-07historical
-
2005-02-03$161,000
-
2000-10-30soldstatus $29,900
-
2000-10-20soldstatus $29,900
-
2000-08-22$29,900
-
2000-07-27soldstatus $75,000
ⓘ Source: listings_history table (triggers on properties + properties_extension) + one-shot
backfill from property_details.listing_events for pre-trigger history.
Tax reassessment forecast NY · Partial reset (capped growth)
- Current annual tax
- $5,796 · $483/mo
- Projected year-2 tax
- $5,855 · $488/mo
- Expected delta
- +$59/yr (+$5/mo · 1.0%)
ⓘ Screening estimate from a state-policy table — verify with the county assessor before closing.
Climate risk First Street
- Flood 5/10 Major FEMA zone X (unshaded) · 54% chance over 30 yrs
- Wildfire 1/10 Low
- Heat 4/10 Moderate 7 d/yr ≥97°F today · 17 d/yr by 30 yrs out
- Wind 3/10 Moderate 6% chance of damaging wind over 30 yrs
- Air quality 1/10 Low 0 unhealthy d/yr today · 0 by 30 yrs out
Nearby sold comps map
Loading sold comps map…
Walkable amenities ~0.75 mi
Loading nearby amenities…
Taxation est. · year 1
- Rental income
- $42,912
- − Mortgage interest
- −$19,600
- − Property taxes
- −$5,796
- − Insurance
- −$1,750
- − Repairs & maintenance
- −$3,433
- − Management
- −$3,433
- − Depreciation
- −$10,179
- Taxable loss
- −$1,278
- Est. tax savings @ 24.0%
- +$307
- After-tax cash flow
- $4,643/yr
For passive investors: Depreciation is non-cash, so a rental often shows a tax loss while cash-flowing — sheltering income. Rental losses are passive: they offset passive income freely, and up to $25,000/yr can offset ordinary (W-2) income if you actively participate and your MAGI is under $100k (phasing out to $0 by $150k); unused losses carry forward. On sale, claimed depreciation is recaptured at up to 25%, and gains may owe capital-gains tax (a 1031 exchange can defer both). Figures are a year-1 estimate at your 24.0% rate — not tax advice; consult a CPA.
Schools (NCES district)
- District
- Albany City School District
- NCES district ID
- 3602460
- Math proficiency
- 37% ▲ 6.00%
- Reading proficiency
- 40% ▲ 7.00%
- Median HH income
- $40,568
- Composite
- 32.34/100
- National rank
- #5744
- State rank
- #543 of 590 in NY
Livability — Albany
- Score
- 79/100
- State rank
- #129
- US rank
- #2083
Category grades
Schools grade is shown separately in the Schools card above.
Census & demographics
- Census place
- Albany, NY
- County
- Albany County · 196,626 people
- City population
- 116,921
- Metro
- Albany-Schenectady-Troy, NY
- Population (ZIP)
- 23,289
- Household income
- $70,413
- Rent vs Own
- Severe rent burden
- 1952.0
Population outlook (Albany County) Hauer SSP2
- Today (2025)
- 320,794 people
- By 2030
- 327,401 · +2.1%
- By 2040
- 338,218 · +5.4%
- By 2050
- 348,467 · +8.6%
- By 2075
- 381,693 · +19.0%
- By 2100
- 393,809 · +22.8%
Race, ethnicity, and origin ACS 2023
- Neighborhood character
- Predominantly White (66%)
- Race & ethnicity
- White 66% Black 12% Asian 10% Hispanic / Latino 7% Two or more races 7%
- Hispanic origin (detail)
- Puerto Rican 3%
- Common ancestry
- Romanian 5% Italian 3% Scotch-Irish 3%
- Foreign-born
- 16% · Canada, China, Philippines
- Languages at home
- 83% English-only · Other Indo-European 4% Other Asian/Pacific 3% French/Haitian/Cajun 2%
Political lean MEDSL · Albany
- 2024 margin
- Strong D (+25.8) · D 62.9% · R 37.1%
- 2008→2024 swing
- -3.6pp toward R · 2008: 29.4pp · 2024: 25.8pp
- All cycles
- 2024: D+25.8 2020: D+31.4 2016: D+24.3 2012: D+31.0 2008: D+29.4
Not yet ingested
- Civics
- —
Market trends
- HPI YoY
- ▼ -120.46%
- Current HPI
- 279.716
- Rent YoY
- ▲ 5.05%
- Metro
- Albany-Schenectady-Troy, NY
- State GDP YoY
- ▲ 2.60%
- F500 in state
- 92
Industry mix (Fortune 500 HQ in NY)
| Industry | F500 HQs | Revenue |
|---|---|---|
| Financial Services | 10 | $950B |
|
||
| Consumer Goods | 9 | $162B |
|
||
| Insurance | 4 | $225B |
|
||
| Telecommunications | 2 | $144B |
|
||
| Pharmaceuticals | 2 | $112B |
|
||
| Media / Entertainment | 2 | $69B |
|
||
Price history
+366.5% since first listed27 events — show timeline
- 2026-05-21 Listed $349,900 Global MLS
- 2025-10-29 Listing Removed — Global MLS
- 2025-10-27 Rental Removed $1,650 GLOBALMLS
- 2025-10-20 Listed $339,900 Global MLS
- 2025-10-13 Price Changed $1,650 GLOBALMLS
- 2025-09-11 Listed for Rent $1,750 GLOBALMLS
- 2024-09-20 Sold (MLS) $295,000 Global MLS
- 2024-06-10 Pending — Global MLS
- 2024-06-07 Listed $289,000 Global MLS
- 2010-10-26 Sold (Public Records) $165,500 Public Records
- 2010-09-30 Sold (MLS) $165,400 Global MLS
- 2010-08-20 Listing Removed — Global MLS
- 2009-06-16 Listed $168,800 Global MLS
- 2009-05-25 Listing Removed — Global MLS
- 2008-11-24 Listed $188,500 Global MLS
- 2008-11-12 Listing Removed — Global MLS
- 2008-10-23 Listed $199,900 Global MLS
- 2008-10-01 Listing Removed — Global MLS
- 2008-06-04 Listed $199,900 Global MLS
- 2005-03-16 Sold (Public Records) $175,000 Public Records
- 2005-03-14 Sold (MLS) $175,000 Global MLS
- 2005-02-07 Listing Removed — Global MLS
- 2005-02-03 Listed $161,000 Global MLS
- 2000-10-30 Sold (Public Records) $29,900 Public Records
- 2000-10-20 Sold (MLS) $29,900 Global MLS
- 2000-08-22 Listed $29,900 Global MLS
- 2000-07-27 Sold (Public Records) $75,000 Public Records
Property tax history
-0.2%/yrLatest (2025): $5,796 · +3.2% YoY. Source: county tax records.
Cash-flow waterfall
monthlySold comps — $/sqft
last 12 mo · ≤1 miLoading sold comps…