14 Patriot Cir · The Pinehills, MA
Flood risk 1/10 · Minimal
- FEMA flood zone
- X (unshaded)
- Chance of flooding over 30 yrs
- 0.0%
- Est. flood insurance / yr
- $507 – $1,088
Fire risk 2/10 · Minimal
- Est. fire insurance / yr
- $915 – $1,699
Heat risk 5/10 · Moderate
- Hot days now (above 92°F)
- 7 days/yr
- Hot days in 30 yrs
- 17 days/yr
Wind risk 8/10 · Major
- Chance of severe wind over 30 yrs
- 80.0%
Air-quality risk 2/10 · Minimal
- Unhealthy air days now
- 1 days/yr
- Unhealthy air days in 30 yrs
- 1 days/yr
Risk factors via First Street. Map © Google.
Why this score? — see what drove the B grade
The composite is a weighted blend of 9 inputs, each scored 0–100. Each bar is that input's sub-score; the figure is the points it added to the 100-point composite (weight × sub-score).
- Cash flow +30.0/30.0
- 1% rule +10.0/10.0
- DSCR +10.0/10.0
- ARV discount +7.3/15.0
- Schools +4.1/10.0
- Rent growth +3.9/5.0
- Livability +3.1/5.0
- Condition / age +2.5/5.0
- Appreciation +0.0/10.0
$149,999
🖨 Deal sheet (PDF) 📄 Offer letter ✓ Due diligence
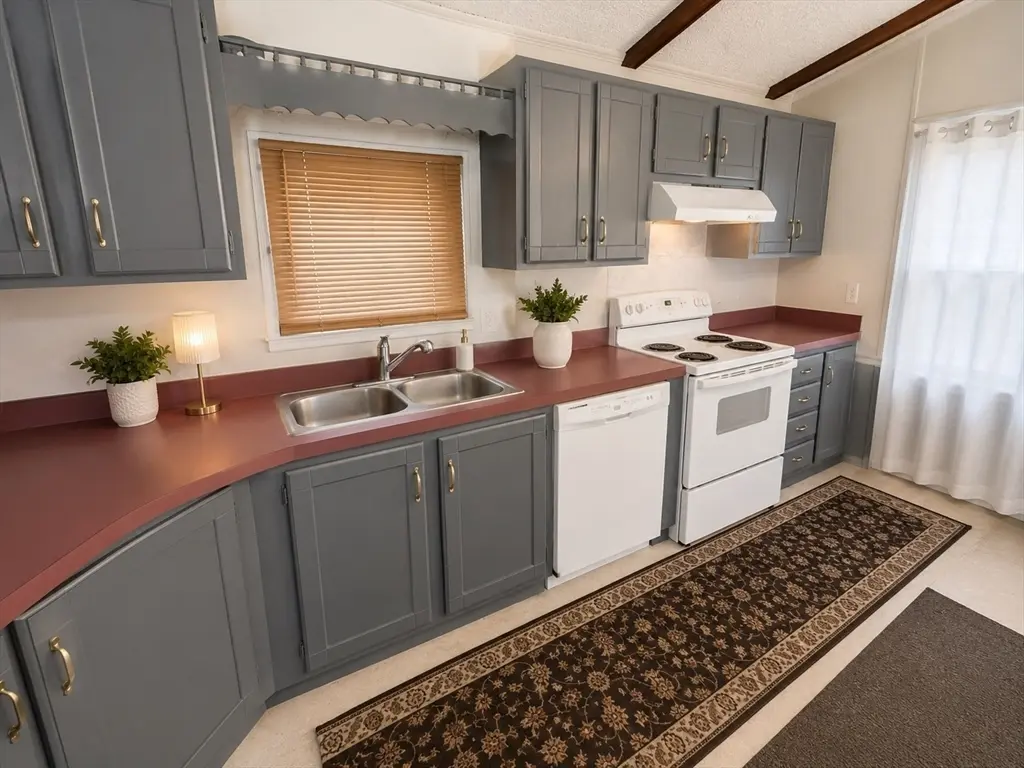
Listing remarks
Welcome to 14 Patriot Circle in Plymouth—an incredible opportunity to own the lowest-priced mobile home in town! This turn-key 2 bedroom, 1 bathroom home is ready for immediate occupancy and offers unbeatable value for buyers looking to get into the market or downsize with ease. Step inside to find a well-maintained interior with a functional layout, comfortable living space, and everything you need already in place. This home truly needs nothing—just move right in and enjoy. Whether you’re looking for affordable year-round living or a low-maintenance retreat, this property checks all the boxes. Conveniently located close to shopping, restaurants, and highway access, makin
Key facts
- Functional layout
- Conveniently located
- 4 parking spots
Tags
Property features AI
Finance
- HOA & community: Not a senior community; Nearby community features include public transportation, shopping, walk/jog trails, highway access, and public school
Exterior
- Parking: Off-street parking with driveway; Four open parking spaces
- Utilities: Public water; Public sewer; 100 Amp electric service
- Home design: Mobile Home; Single-story/first-floor living (features listed at main/first level)
- Construction: Shingle roof; Slab foundation; Year built reported by owner
- Exterior features: Wood deck; Storage; Fenced yard; Private maintained road
Interior
- Kitchen: Pantry; Overhead lighting; Range; Dishwasher; Refrigerator
- Bedrooms: Two main-level bedrooms (both feature ceiling fans and picture windows)
- Flooring: Vinyl flooring in the living room
- Bathrooms: One full bathroom on the main level with picture window
- Heating & cooling: Forced air heating; Propane heating; Heating present
- Interior features: Ceiling fans in bedrooms and living room; Picture windows in bedrooms, living room, kitchen, and bathroom; Overhead lighting in kitchen and living room; Total of 5 rooms
- Laundry & utility: Washer and dryer on the main level/first floor
Neighborhood map
What this means for you Summary
Snapshot
- This is a 2-bed/1.0-bath manufactured listed at $150k.
Deal economics
- At list price, monthly cash flow is $848 ($10k/yr) — positive.
- The deal already cash-flows at list — no discount required.
- Meets the 1% rule at list price ($2k rent vs $150k).
- Recommended offer: $145k (3.0% below list) — sets the bar for market timing.
- Cap rate 13.1% vs local median 1.4% in The Pinehills — top-decile yield for the area; either an underpriced asset or a hidden risk that comps aren't pricing in. Stress-test before assuming the spread holds.
Location & tenants
- Location reads 62/100 on livability (#208 in MA) — a middle-class / working-renter tenant base. Strengths: crime A+, employment A+; Watch: amenities F, commute F, cost of living F.
- Plymouth (suburban): math 35% / reading 54% proficiency, ranked #158 of 302 in MA (top 52%) — families likely to look elsewhere, expect single-tenant / working-renter base with shorter leases.
- Market conditions: Rents rising fast (+5.4%/yr); 269 active listings in the ZIP; 4 comparable units currently listed for rent nearby; rentals at typical pace (median 25d on market — plan ~3-4 weeks tenant-placement turnaround); high-income renter base; 1,255 units permitted in Plymouth County in 2024 (411 in 5+ unit buildings).
Forward outlook
- Local home prices are declining (-3.0%/yr); year-one equity from $1k of loan paydown is wiped out by about $4k of value loss. Plan a longer hold.
- At projected returns (-3.0% appreciation + 5.4% rent growth), your $42k cash investment doubles in ~5 years — after that, you're playing with house money.
Negotiation context
- It's been on market 48 days — a 3% lower offer ($145k) is reasonable based on typical stale-listing flexibility.
Risks & watch-outs
- Climate carrying-cost: severe wind risk, 80% chance of damaging wind over 30y; extreme-heat days projected 7→17/yr by 2055 (HVAC capex compounding) — expect insurance premiums to compound above CPI over the hold.
Questions for the listing agent
- It's been on market 48 days. Have you received any prior offers? Is the seller open to a 3% concession, seller financing, or rate buy-down credit?
- Is there a deadline driving the sale (1031 exchange, divorce, estate, relocation)? That informs how much negotiation room exists.
- What's the average days-on-market for RENTAL listings here right now (not sales)? A rising rental-DOM trend means longer vacancies and softer asking-rent achievability than the comps imply.
- What's the recent tenant-quality profile in this submarket — average credit score on applications, eviction rate, late-payment / NSF rate, and stable-employment percentage? A property-management company in the area should have these aggregated.
- How much new for-sale + rental construction is in the pipeline within 1–3 miles? Heavy new supply typically softens prices + rents 12–24 months out; constrained supply supports both.
Investment metrics
- 1% rule
- 1.59% ✓
- Cap rate
- 13.08%
- Cash-on-cash
- 24.23%
- DSCR
- 2.08
- GRM
- 5.2
CMA / ARV
- ARV (median comp)
- $149,227
- List price
- $149,999
- Delta
- 0.52%
- Verdict
- FAIR
- Comps
- 2 within 1.0 mi
Show comp detail 3 sales within ~0.75 mi
| Address | Dist | Beds/Ba | Sqft | Sold | Price | $/sf | Match |
|---|---|---|---|---|---|---|---|
| 39 Patriot Cir | 0.09mi | 2/1.0 | 900 (-4%) | 10mo | $150,000 | $167 | 80 |
| 25 Patriot Cir | 0.05mi | 2/1.0 | 1,040 (+10%) | 11mo | $145,000 | $139 | 71 |
| 38 Patriot Cir | 0.08mi | 3/2.0 (+1) | 1,008 (+7%) | 22mo | $164,900 | $164 | 57 |
Match score weights: distance 35% · size 25% · config 20% · recency 20%. Top-matched comps best support the ARV.
Projected returns pro-forma
-3.0% appreciation · 5.43% rent growth · sell at horizon
- IRR
- 20.2%
- Equity multiple
- 1.85×
- Total profit
- $35,725
- Equity at exit
- $22,365
- IRR
- 30.1%
- Equity multiple
- 4.01×
- Total profit
- $126,584
- Equity at exit
- $12,969
Cash invested: $42,000 (down + closing). Projections, not guarantees.
Landlord ↔ Tenant lean methodology
- Overall (STATE)
- 20 Strongly Tenant-Friendly
- State Massachusetts
- 20 Strongly Tenant-Friendly · D+15
- County
- — inherits STATE
- City
- — inherits STATE
ZIP-level market 02360
- Rents YoY
- 5.4%
- Active inventory
- 269
- Price-to-rent
- 5.2×
Monthly cashflow live
- Estimated rent
- $2,386 medium interval (Pro) →
- Mortgage (P&I)
- −$787
- Tax est. 1.5%
- −$187 /mo · $2,250/yr
- Insurance
- −$62
- HOA
- −$0
- Vacancy / Maint / Mgmt
- −$501
- Net cashflow
- $848
Break-even live
Sensitivity live
| Price | -10% $952 | -5% $900 | +0% $848 | +5% $796 | +10% $745 |
|---|---|---|---|---|---|
| Rent | -10% $660 | -5% $754 | +0% $848 | +5% $942 | +10% $1,037 |
| Rate | -1.0pp $924 | -0.5pp $886 | base $848 | +0.5pp $809 | +1.0pp $770 |
UW: 25.0% down · 7.5% · 30yr · 1.5% tax · 5.0% vac · 8.0% maint · 8.0% mgmt
Financing live
Cash to close
- Down payment
- $37,500
- Closing costs
- $4,500
- Reserves months
- —
- Total cash needed
- —
Loan-product check · same deal, 3 products live
Conventional
25% down · 7.5% · 30yr
- Down + closing
- —
- Monthly P&I
- —
- Monthly cashflow
- —
- DSCR
- —
- Eligible?
- —
Personal DTI + credit; lowest rate.
DSCR
20% down · 8.5% · 30yr
- Down + closing
- —
- Monthly P&I
- —
- Monthly cashflow
- —
- DSCR
- —
- Eligible?
- —
No personal income docs; deal must DSCR.
Hard money
10% down · 12.0% · 12mo
- Down + closing
- —
- Monthly P&I
- —
- Monthly cashflow
- —
- DSCR
- —
- Eligible?
- —
Short-term bridge; refi at stabilization.
Rent comps 4 comps
| Address | Beds | Baths | Sqft | Rent | $/sqft | DOM | Units | Dist |
|---|---|---|---|---|---|---|---|---|
| 10 Tideview Path #18 Plymouth, MA | 2.0 | 1.0 | 791 | $1,950 | $2.47 | 25d | 1 | 0.89mi |
| 9 Tideview Path #8 Plymouth, MA | 2.0 | 1.0 | 723 | $2,300 | $3.18 | 19d | 1 | 0.91mi |
| 2 Tideview Path Plymouth, MA | 2.0 | 1.0 | 750 | $2,300 | $3.07 | 44d | 1 | 0.92mi |
| 28 Cochituate Rd Plymouth, MA | 2.0 | 1.0 | 700 | $2,400 | $3.43 | 17d | 1 | 1.06mi |
Listing history 17 events
-
2026-06-21days on market $149,999 Active 48 DOM
-
2026-06-18days on market $149,999 Active 45 DOM
-
2026-06-17days on market $149,999 Active 44 DOM
-
2026-06-16days on market $149,999 Active 43 DOM
-
2026-06-15days on market $149,999 Active 42 DOM
-
2026-06-13days on market $149,999 Active 40 DOM
-
2026-06-13days on market $149,999 Active 39 DOM
-
2026-06-09days on market $149,999 Active 36 DOM
-
2026-06-08days on market $149,999 Active 35 DOM
-
2026-06-08statusdays on market $149,999 Active 34 DOM
-
2026-06-04pricestatusdays on market $149,999 Price Changed 31 DOM
-
2026-06-03days on market $152,500 Active 30 DOM
-
2026-06-02days on market $152,500 Active 29 DOM
-
2026-06-01statusdays on market $152,500 Active 28 DOM
-
2026-05-31days on market $152,500 Price Changed 27 DOM
-
2026-05-13price $164,900 923-char remark
-
2026-05-04$179,000 New 923-char remark
ⓘ Source: listings_history table (triggers on properties + properties_extension) + one-shot
backfill from property_details.listing_events for pre-trigger history.
Climate risk First Street
- Flood 1/10 Low FEMA zone X (unshaded) · 0% chance over 30 yrs
- Wildfire 2/10 Low
- Heat 5/10 Major 7 d/yr ≥92°F today · 17 d/yr by 30 yrs out
- Wind 8/10 Severe 80% chance of damaging wind over 30 yrs
- Air quality 2/10 Low 1 unhealthy d/yr today · 1 by 30 yrs out
Nearby sold comps map
Loading sold comps map…
Walkable amenities ~0.75 mi
Loading nearby amenities…
Taxation est. · year 1
- Rental income
- $28,630
- − Mortgage interest
- −$8,402
- − Property taxes
- −$2,250
- − Insurance
- −$750
- − Repairs & maintenance
- −$2,290
- − Management
- −$2,290
- − Depreciation
- −$4,364
- Taxable income
- $8,283
- Est. tax owed @ 24.0%
- −$1,988
- After-tax cash flow
- $8,190/yr
For passive investors: Depreciation is non-cash, so a rental often shows a tax loss while cash-flowing — sheltering income. Rental losses are passive: they offset passive income freely, and up to $25,000/yr can offset ordinary (W-2) income if you actively participate and your MAGI is under $100k (phasing out to $0 by $150k); unused losses carry forward. On sale, claimed depreciation is recaptured at up to 25%, and gains may owe capital-gains tax (a 1031 exchange can defer both). Figures are a year-1 estimate at your 24.0% rate — not tax advice; consult a CPA.
Schools (NCES district)
- District
- Plymouth
- NCES district ID
- 2509720
- Math proficiency
- 35% ▼ -12.00%
- Reading proficiency
- 54% ▼ -2.00%
- Median HH income
- $77,630
- Composite
- 40.79/100
- National rank
- #3640
- State rank
- #158 of 302 in MA
Livability — The Pinehills
- Score
- 62/100
- State rank
- #208
- US rank
- #16473
Category grades
Schools grade is shown separately in the Schools card above.
Census & demographics
- County
- Plymouth County · 358,589 people
- Metro
- Boston-Cambridge-Newton, MA-NH
- Population (ZIP)
- 63,689
- Household income
- $116,941
- Rent vs Own
- Severe rent burden
- 1655.0
Population outlook (Plymouth County) Hauer SSP2
- Today (2025)
- 533,105 people
- By 2030
- 541,862 · +1.6%
- By 2040
- 549,791 · +3.1%
- By 2050
- 542,476 · +1.8%
- By 2075
- 518,429 · -2.8%
- By 2100
- 448,179 · -15.9%
Race, ethnicity, and origin ACS 2023
- Neighborhood character
- Predominantly White (88%)
- Race & ethnicity
- White 88% Two or more races 5% Hispanic / Latino 3% Black 1% Asian 1%
- Common ancestry
- Russian 6% Lithuanian 4% Romanian 3%
- Foreign-born
- 6% · Canada, Vietnam
- Languages at home
- 92% English-only · Other Indo-European 4% Spanish 2% Vietnamese 1%
Political lean MEDSL · Plymouth
- 2024 margin
- Lean D (+8.8) · D 53.6% · R 44.7% · Other 1.7%
- 2008→2024 swing
- +1.3pp toward D · 2008: 7.6pp · 2024: 8.8pp
- All cycles
- 2024: D+8.8 2020: D+17.4 2016: D+7.2 2012: D+3.8 2008: D+7.6
Not yet ingested
- Civics
- —
Market trends
- HPI YoY
- ▼ -495.82%
- Current HPI
- 306.0925
- Rent YoY
- ▲ 5.43%
- Metro
- Boston-Cambridge-Newton, MA-NH
- State GDP YoY
- ▲ 2.28%
- F500 in state
- 38
Industry mix (Fortune 500 HQ in MA)
| Industry | F500 HQs | Revenue |
|---|---|---|
| Technology | 3 | $17B |
|
||
| Insurance | 2 | $84B |
|
||
| Retail | 2 | $76B |
|
||
| Life Sciences | 1 | $43B |
|
||
| Energy Technology | 1 | $31B |
|
||
| Aerospace / Defense | 1 | $18B |
|
||
Price history
-16.2% since first listed5 events — show timeline
- 2026-06-03 Price Changed $149,999 MLS PIN
- 2026-05-28 Price Changed $152,500 MLS PIN
- 2026-05-20 Price Changed $159,000 MLS PIN
- 2026-05-13 Price Changed $164,900 MLS PIN
- 2026-05-04 Listed $179,000 MLS PIN
Cash-flow waterfall
monthlySold comps — $/sqft
last 12 mo · ≤1 miLoading sold comps…