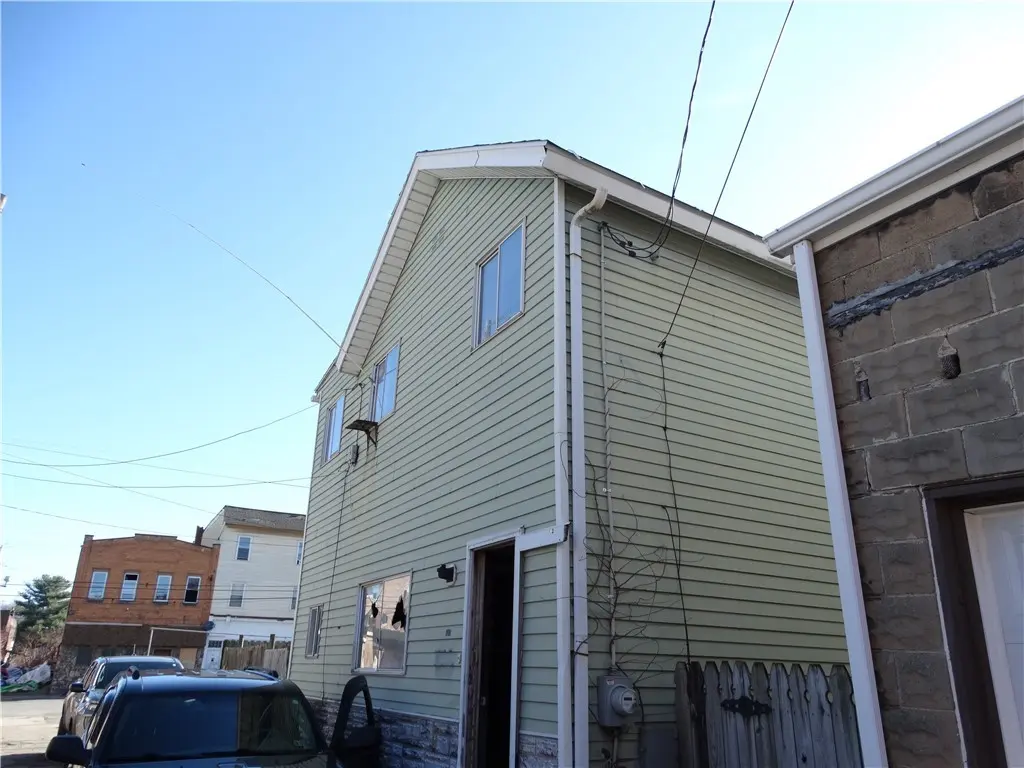
113 Clay Way · McKees Rocks, PA
Flood risk 10/10 · Severe
- FEMA flood zone
- X (shaded)
- Chance of flooding over 30 yrs
- 0.99%
- Est. flood insurance / yr
- $473 – $860
Fire risk 1/10 · Minimal
- Est. fire insurance / yr
- $511 – $949
Heat risk 4/10 · Minor
- Hot days now (above 98°F)
- 7 days/yr
- Hot days in 30 yrs
- 18 days/yr
Wind risk 2/10 · Minimal
- Chance of severe wind over 30 yrs
- —
Air-quality risk 3/10 · Minor
- Unhealthy air days now
- 3 days/yr
- Unhealthy air days in 30 yrs
- 3 days/yr
Risk factors via First Street. Map © Google.
Why this score? — see what drove the B+ grade
The composite is a weighted blend of 9 inputs, each scored 0–100. Each bar is that input's sub-score; the figure is the points it added to the 100-point composite (weight × sub-score).
- Cash flow +30.0/30.0
- ARV discount +15.0/15.0
- 1% rule +10.0/10.0
- DSCR +10.0/10.0
- Rent growth +5.0/5.0
- Livability +4.1/5.0
- Condition / age +2.5/5.0
- Schools +0.9/10.0
- Appreciation +0.0/10.0
$35,000
🖨 Deal sheet 📄 Offer letter ✓ Due diligence
Listing remarks MLS
Ready for your next investment. .. this may be the one. Whether you want to renovate, or rent, bring this home back to life.
Key facts
- 1,041 sq ft lot
- Built 1910
- Listed 88 days
Neighborhood map
What this means for you Summary
Snapshot
- This is a 2-bed/1.0-bath single-family listed at $35k.
Deal economics
- At list price, monthly cash flow is $619 ($7k/yr) — positive.
- The deal already cash-flows at list — no discount required.
- Meets the 1% rule at list price ($1k rent vs $35k).
- Recommended offer: $33k (6.0% below list) — sets the bar for market timing.
- Cap rate 29.4% vs local median 11.7% in McKees Rocks — top-decile yield for the area; either an underpriced asset or a hidden risk that comps aren't pricing in. Stress-test before assuming the spread holds.
Location & tenants
- Location reads 82/100 on livability (#143 in PA, #1,154 nationally) — a professional / high-income tenant draw. Strengths: amenities A+, commute A+, cost of living A+; Watch: schools F, employment F.
- Sto-Rox SD (suburban): math 4% / reading 18% proficiency, ranked #532 of 539 in PA (top 99%) — low school quality limits family demand, transient renter base, plan for 1-2y turnover; 77% free/reduced lunch — lower-income household profile, screen leases tightly.
- Market conditions: Rents rising fast (+13.1%/yr); 125 active listings in the ZIP; 21 comparable units currently listed for rent nearby; rentals at typical pace (median 24d on market — plan ~3-4 weeks tenant-placement turnaround); 43% of comp listings sitting > 30 days — soft ceiling on asking rent; 2,996 units permitted in Allegheny County in 2024 (1,588 in 5+ unit buildings).
Forward outlook
- Local home prices are declining (-3.0%/yr); year-one equity from $242 of loan paydown is wiped out by about $1k of value loss. Plan a longer hold.
- At projected returns (-3.0% appreciation + 8.0% rent growth), your $10k cash investment doubles in ~2 years — after that, you're playing with house money.
Negotiation context
- It's been on market 89 days — a 6% lower offer ($33k) is reasonable based on typical stale-listing flexibility.
- 2 sale attempts since 3y ago with the ask held roughly flat each time — persistent listings suggest the price (not the market) is what's stuck; bring a comps-based counter.
Risks & watch-outs
- Watch-outs: flood insurance adds $56/mo; built in 1910 — expect roof / HVAC / electrical / plumbing capex.
- Climate carrying-cost: severe flood risk — expect insurance premiums to compound above CPI over the hold.
Questions for the listing agent
- It's been on market 89 days. Have you received any prior offers? Is the seller open to a 6% concession, seller financing, or rate buy-down credit?
- Built in 1910 — when were the roof, HVAC, electrical panel, plumbing, and water heater last replaced?
- What's the actual annual flood-insurance premium (NFIP or private), and is the property in a SFHA with mandatory coverage?
- Why hasn't it sold? Are there any deal-killer items the seller is aware of (foundation, flood, title, zoning, code violations)?
- Is there a deadline driving the sale (1031 exchange, divorce, estate, relocation)? That informs how much negotiation room exists.
- Schools are F-rated, which usually means shorter tenancies and higher turnover. Who's the typical renter profile here, and what's been the actual vacancy rate?
- What's the average days-on-market for RENTAL listings here right now (not sales)? A rising rental-DOM trend means longer vacancies and softer asking-rent achievability than the comps imply.
- What's the recent tenant-quality profile in this submarket — average credit score on applications, eviction rate, late-payment / NSF rate, and stable-employment percentage? A property-management company in the area should have these aggregated.
- How much new for-sale + rental construction is in the pipeline within 1–3 miles? Heavy new supply typically softens prices + rents 12–24 months out; constrained supply supports both.
Investment metrics
- 1% rule
- 3.36% ✓
- Cap rate
- 29.41%
- Cash-on-cash
- 82.55%
- DSCR
- 4.67
- GRM
- 2.5
CMA / ARV
- ARV (median comp)
- $48,595
- List price
- $35,000
- Delta
- -27.98%
- Verdict
- UNDERPRICED
- Comps
- 20 within 1.0 mi
Show comp detail 8 sales within ~0.75 mi
| Address | Dist | Beds/Ba | Sqft | Sold | Price | $/sf | Match |
|---|---|---|---|---|---|---|---|
| 313 Linton St | 0.46mi | 1/1.0 (-1) | 810 (-1%) | 9mo | $27,000 | $33 | 64 |
| 1005 3rd St | 0.68mi | 2/1.0 | 800 (-2%) | 19mo | $110,000 | $138 | 49 |
| 331 Fair Oaks St | 0.58mi | 2/1.0 | 880 (+7%) | 16mo | $40,136 | $46 | 47 |
| 26 May Ave | 0.73mi | 2/1.0 | 750 (-8%) | 12mo | $40,000 | $53 | 41 |
| 553 Fair Oaks St | 0.61mi | 3/2.0 (+1) | 864 (+5%) | 22mo | $110,000 | $127 | 35 |
| 87 Harlem Ave | 0.63mi | 2/1.0 | 924 (+13%) | 19mo | $66,000 | $71 | 34 |
| 412 Woodward Ave | 0.62mi | 3/1.0 (+1) | 920 (+12%) | 23mo | $40,000 | $43 | 27 |
| 1151 Stowe Ave | 0.67mi | 3/1.0 (+1) | 928 (+13%) | 19mo | $18,000 | $19 | 26 |
Match score weights: distance 35% · size 25% · config 20% · recency 20%. Top-matched comps best support the ARV.
Projected returns pro-forma
-3.0% appreciation · 8.0% rent growth · sell at horizon
- IRR
- 81.7%
- Equity multiple
- 5.08×
- Total profit
- $39,992
- Equity at exit
- $5,219
- IRR
- 86.4%
- Equity multiple
- 12.64×
- Total profit
- $114,044
- Equity at exit
- $3,026
Cash invested: $9,800 (down + closing). Projections, not guarantees.
Landlord ↔ Tenant lean methodology
- Overall (STATE)
- 62 Landlord-Friendly
- State Pennsylvania
- 62 Landlord-Friendly · EVEN
- County
- — inherits STATE
- City
- — inherits STATE
ZIP-level market 15136
- Home prices YoY
- -30.4%
- Rents YoY
- 13.1%
- Active inventory
- 125
- Price-to-rent
- 2.5×
Monthly cashflow live
- Estimated rent
- $1,174 high interval (Pro) →
- Mortgage (P&I)
- −$184
- Tax from tax record
- −$56 /mo · $667/yr
- Insurance
- −$15
- Flood insurance flood zone
- −$56 /mo · $666/yr
- HOA
- −$0
- Vacancy / Maint / Mgmt
- −$247
- Net cashflow
- $619
Break-even live
UW: 25.0% down · 7.5% · 30yr · 1.5% tax · 5.0% vac · 8.0% maint · 8.0% mgmt
Financing live
Cash to close
- Down payment
- $8,750
- Closing costs
- $1,050
- Reserves months
- —
- Total cash needed
- —
Loan-product check · same deal, 3 products live
Conventional
25% down · 7.5% · 30yr
- Down + closing
- —
- Monthly P&I
- —
- Monthly cashflow
- —
- DSCR
- —
- Eligible?
- —
Personal DTI + credit; lowest rate.
DSCR
20% down · 8.5% · 30yr
- Down + closing
- —
- Monthly P&I
- —
- Monthly cashflow
- —
- DSCR
- —
- Eligible?
- —
No personal income docs; deal must DSCR.
Hard money
10% down · 12.0% · 12mo
- Down + closing
- —
- Monthly P&I
- —
- Monthly cashflow
- —
- DSCR
- —
- Eligible?
- —
Short-term bridge; refi at stabilization.
Rent comps 21 comps
| Address | Beds | Baths | Sqft | Rent | $/sqft | DOM | Units | Dist |
|---|---|---|---|---|---|---|---|---|
| 214 Erwin Pl Mc Kees Rocks, PA | 3.0 | 1.0 | 1026 | $1,685 | $1.64 | 43d | 1 | 0.47mi |
| 614 Woodward Ave McKees Rocks, PA | 2.0 | 1.0 | 1000 | $950 | $0.95 | 7d | 1 | 0.70mi |
| 907 Chartiers Ave Unit 2 McKees Rocks, PA | 2.0 | 1.0 | 900 | $1,100 | $1.22 | 23d | 1 | 0.72mi |
| 705 Russellwood Ave Apt 1 McKees Rocks, PA | 2.0 | 1.0 | 800 | $1,549 | $1.94 | 23d | 1 | 0.87mi |
| 33 Greenough Ave Pittsburgh, PA | 2.0 | 1.0 | 900 | $1,300 | $1.44 | 43d | 1 | 0.89mi |
| 214 Wright St Unit Na McKees Rocks, PA | 2.0 | 1.0 | 954 | $1,175 | $1.23 | 14d | 1 | 0.92mi |
| 933 Woodward Ave Unit MC McKees Rocks, PA | 2.0 | 1.0 | 1100 | $1,400 | $1.27 | 23d | 1 | 1.02mi |
| 933 Woodward Ave Unit NA McKees Rocks, PA | 2.0 | 1.0 | 1100 | $1,400 | $1.27 | 20d | 1 | 1.02mi |
| 114 Singer Ave McKees Rocks, PA | 1.0 | 1.0 | 650 | $800 | $1.23 | 44d | 1 | 1.05mi |
| 219 Woodlawn Ave Pittsburgh, PA | 2.0 | 1.0 | 925 | $1,075 | $1.16 | 43d | 1 | 1.05mi |
| 117 Crawford Ave Unit 2 Pittsburgh, PA | 1.0 | 1.0 | 700 | $900 | $1.29 | 43d | 1 | 1.06mi |
| 27 Rudolph St Mc Kees Rocks, PA | 3.0 | 1.0 | 1084 | $1,100 | $1.01 | 2d | 1 | 1.12mi |
| 149 S Euclid Ave Unit 1 Pittsburgh, PA | 1.0 | 1.0 | 800 | $1,200 | $1.50 | 17d | 1 | 1.12mi |
| 802 13th St Unit 2 McKees Rocks, PA | 2.0 | 1.0 | 1100 | $920 | $0.84 | 43d | 1 | 1.12mi |
| 145 Washington Ave Pittsburgh, PA | 1.0 | 1.0 | 650 | $950 | $1.46 | 43d | 1 | 1.19mi |
| 25 Grant Ave #1 Bellevue, PA | 1.0 | 1.0 | 950 | $1,095 | $1.15 | 2d | 1 | 1.29mi |
| 136 Sheridan Ave Pittsburgh, PA | 1.0 | 1.0 | 625 | $890 | $1.42 | 23d | 1 | 1.30mi |
| 71-73 Sheridan Ave Unit 73 Pittsburgh, PA | 2.0 | 1.0 | 900 | $1,100 | $1.22 | 43d | 1 | 1.36mi |
| 60 Sumner Ave Bellevue, PA | 1.0 | 1.0 | 600 | $1,004 | $1.67 | 16d | 2 | 1.37mi |
| 118 Arch Ave Pittsburgh, PA | 2.0 | 1.0 | 850 | $1,100 | $1.29 | 23d | 1 | 1.41mi |
| 16 N Fremont Ave Pittsburgh, PA | 2.0 | 1.0 | 1000 | $1,100 | $1.10 | 43d | 1 | 1.47mi |
Listing history 13 events
-
2026-06-09days on market $35,000 Active 89 DOM
-
2026-06-08days on market $35,000 Active 88 DOM
-
2026-06-07days on market $35,000 Active 87 DOM
-
2026-06-05days on market $35,000 Active 84 DOM
-
2026-06-03days on market $35,000 Active 83 DOM
-
2026-06-02days on market $35,000 Active 82 DOM
-
2026-06-01days on market $35,000 Active 81 DOM
-
2026-05-31days on market $35,000 Active 80 DOM
-
2026-03-12$35,000 Active 124-char remark
Show marketing remark (124 chars)
Ready for your next investment. .. this may be the one. Whether you want to renovate, or rent, bring this home back to life.
-
2023-12-28historical Expired 96-char remark
Show marketing remark (96 chars)
Property is currently occupied by a 20+yr tenant who would like to continue to live in the home.
-
2023-03-14price $40,000 96-char remark
Show marketing remark (96 chars)
Property is currently occupied by a 20+yr tenant who would like to continue to live in the home.
-
2023-01-11price $45,000 96-char remark
Show marketing remark (96 chars)
Property is currently occupied by a 20+yr tenant who would like to continue to live in the home.
-
2023-01-02$32,000 Active 96-char remark
Show marketing remark (96 chars)
Property is currently occupied by a 20+yr tenant who would like to continue to live in the home.
ⓘ Source: listings_history table (triggers on properties + properties_extension) + one-shot
backfill from property_details.listing_events for pre-trigger history.
Tax reassessment forecast PA · Partial reset (capped growth)
- Current annual tax
- $667 · $56/mo
- Projected year-2 tax
- $667 · $56/mo
- Expected delta
- $0/yr ($0/mo · 0.0%)
ⓘ Screening estimate from a state-policy table — verify with the county assessor before closing.
Climate risk First Street
- Flood 10/10 Extreme FEMA zone X (shaded) · 99% chance over 30 yrs
- Wildfire 1/10 Low
- Heat 4/10 Moderate 7 d/yr ≥98°F today · 18 d/yr by 30 yrs out
- Wind 2/10 Low
- Air quality 3/10 Moderate 3 unhealthy d/yr today · 3 by 30 yrs out
Nearby sold comps map
Loading sold comps map…
Walkable amenities ~0.75 mi
Loading nearby amenities…
Taxation est. · year 1
- Rental income
- $14,093
- − Mortgage interest
- −$1,961
- − Property taxes
- −$667
- − Insurance
- −$842
- − Repairs & maintenance
- −$1,127
- − Management
- −$1,127
- − Depreciation
- −$1,018
- Taxable income
- $7,351
- Est. tax owed @ 24.0%
- −$1,764
- After-tax cash flow
- $5,659/yr
For passive investors: Depreciation is non-cash, so a rental often shows a tax loss while cash-flowing — sheltering income. Rental losses are passive: they offset passive income freely, and up to $25,000/yr can offset ordinary (W-2) income if you actively participate and your MAGI is under $100k (phasing out to $0 by $150k); unused losses carry forward. On sale, claimed depreciation is recaptured at up to 25%, and gains may owe capital-gains tax (a 1031 exchange can defer both). Figures are a year-1 estimate at your 24.0% rate — not tax advice; consult a CPA.
Schools (NCES district)
- District
- Sto-Rox SD
- NCES district ID
- 4222830
- Math proficiency
- 4% ▼ -5.00%
- Reading proficiency
- 18% ▼ -4.00%
- Median HH income
- $30,268
- Composite
- 8.51/100
- National rank
- #9904
- State rank
- #532 of 539 in PA
Livability — McKees Rocks
- Score
- 82/100
- State rank
- #143
- US rank
- #1154
Category grades
Schools grade is shown separately in the Schools card above.
Census & demographics
- Census place
- McKees Rocks, PA
- County
- Allegheny County · 1,022,028 people
- City population
- 22,623
- Metro
- Pittsburgh, PA
- Population (ZIP)
- 22,623
- Household income
- $69,099
- Rent vs Own
- Severe rent burden
- 768.0
Population outlook (Allegheny County) Hauer SSP2
- Today (2025)
- 1,250,282 people
- By 2030
- 1,256,482 · +0.5%
- By 2040
- 1,256,318 · +0.5%
- By 2050
- 1,244,169 · -0.5%
- By 2075
- 1,197,693 · -4.2%
- By 2100
- 1,093,187 · -12.6%
Race, ethnicity, and origin ACS 2023
- Neighborhood character
- Predominantly White (75%)
- Race & ethnicity
- White 75% Black 18% Two or more races 4% Hispanic / Latino 2%
- Common ancestry
- Romanian 10% Subsaharan African 3% Scotch-Irish 2%
- Foreign-born
- 3% · Canada
- Languages at home
- 96% English-only · Spanish 1% Other Indo-European 1%
Political lean MEDSL · Allegheny
- 2024 margin
- Strong D (+20.3) · D 59.7% · R 39.4%
- 2008→2024 swing
- +4.8pp toward D · 2008: 15.5pp · 2024: 20.3pp
- All cycles
- 2024: D+20.3 2020: D+20.4 2016: D+16.4 2012: D+14.4 2008: D+15.5
Not yet ingested
- Civics
- —
Market trends
- HPI YoY
- ▼ -107.07%
- Current HPI
- 244.6934
- Rent YoY
- ▲ 13.12%
- Metro
- Pittsburgh, PA
- State GDP YoY
- ▲ 1.68%
- F500 in state
- 34
Industry mix (Fortune 500 HQ in PA)
| Industry | F500 HQs | Revenue |
|---|---|---|
| Healthcare | 2 | $309B |
|
||
| Insurance | 2 | $27B |
|
||
| Telecommunications / Media | 1 | $124B |
|
||
| Industrial Distribution | 1 | $22B |
|
||
| Financial Services | 1 | $20B |
|
||
| Chemicals / Materials | 1 | $18B |
|
||
Price history
+9.4% since first listed5 events — show timeline
- 2026-03-12 Listed $35,000 West Penn MLS
- 2023-12-28 Delisted — West Penn MLS
- 2023-03-14 Price Changed $40,000 West Penn MLS
- 2023-01-11 Price Changed $45,000 West Penn MLS
- 2023-01-02 Listed $32,000 West Penn MLS
Property tax history
+2.6%/yrLatest (2026): $667 · +4.1% YoY. Source: county tax records.
Cash-flow waterfall
monthlySold comps — $/sqft
last 12 mo · ≤1 miLoading sold comps…