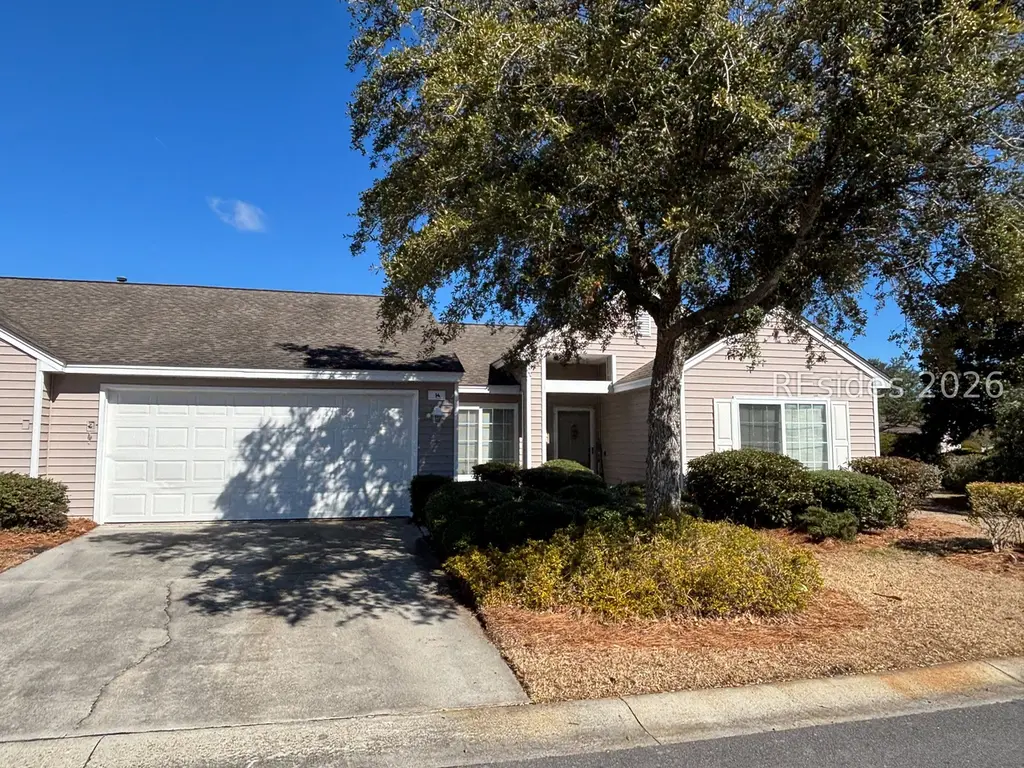
14 Huquenin Ln · Hardeeville, SC
Flood risk 3/10 · Minor
- FEMA flood zone
- X (unshaded)
- Chance of flooding over 30 yrs
- 0.12%
- Est. flood insurance / yr
- $507 – $1,088
Fire risk 3/10 · Minor
- Est. fire insurance / yr
- $783 – $1,453
Heat risk 10/10 · Severe
- Hot days now (above 107°F)
- 7 days/yr
- Hot days in 30 yrs
- 18 days/yr
Wind risk 8/10 · Major
- Chance of severe wind over 30 yrs
- 99.0%
Air-quality risk 2/10 · Minimal
- Unhealthy air days now
- 2 days/yr
- Unhealthy air days in 30 yrs
- 2 days/yr
Risk factors via First Street. Map © Google.
Why this score? — see what drove the C grade
The composite is a weighted blend of 9 inputs, each scored 0–100. Each bar is that input's sub-score; the figure is the points it added to the 100-point composite (weight × sub-score).
- Cash flow +20.1/30.0
- ARV discount +11.7/15.0
- DSCR +6.4/10.0
- Rent growth +4.8/5.0
- Schools +4.1/10.0
- 1% rule +4.0/10.0
- Livability +3.2/5.0
- Condition / age +2.5/5.0
- Appreciation +0.0/10.0
$270,000
🖨 Deal sheet 📄 Offer letter ✓ Due diligence
Listing remarks MLS
Two-bedrοom, twο-bаth Ѕummerton Villа wіth a patio.
Key facts
- 2 garage spots
- Community pool
- Built 1997
Neighborhood map
What this means for you Summary
Snapshot
- This is a 2-bed/2.0-bath townhouse listed at $270k.
Deal economics
- At list price, monthly cash flow is $336 ($4k/yr) — positive.
- The deal already cash-flows at list — no discount required.
- To meet the 1% rule (rent ≥ 1% of price), the offer needs to be $243k (10.1% below list).
- Recommended offer: $243k (10.1% below list) — sets the bar for 1% rule.
- Cap rate 7.8% vs local median 3.6% in Hardeeville — top-decile yield for the area; either an underpriced asset or a hidden risk that comps aren't pricing in. Stress-test before assuming the spread holds.
Location & tenants
- Location reads 65/100 on livability (#136 in SC) — a middle-class / working-renter tenant base. Strengths: health & safety A+, crime B+, housing B+; Watch: schools F, amenities F, commute F.
- Beaufort 01 (town): math 42% / reading 51% proficiency, ranked #17 of 80 in SC (top 21%) — families likely to look elsewhere, expect single-tenant / working-renter base with shorter leases.
- Market conditions: Rents rising fast (+9.3%/yr); 650 active listings in the ZIP; 4 comparable units currently listed for rent nearby; rentals lingering (median 44d on market — plan ~5-8 weeks vacancy on turnover, expect pricing pressure); 50% of comp listings sitting > 30 days — soft ceiling on asking rent; solid renter incomes; 1,824 units permitted in Beaufort County in 2024 (618 in 5+ unit buildings).
- This rent runs 32% of the median local income ($91k/yr) — at the standard rent-burdened threshold; future hikes will face affordability resistance.
Forward outlook
- Local home prices are declining (-3.0%/yr); year-one equity from $2k of loan paydown is wiped out by about $8k of value loss. Plan a longer hold.
- Beaufort County population projected at +30% by 2050 — long-run rental-demand tailwind backs the buy-and-hold thesis.
- At projected returns (-3.0% appreciation + 8.0% rent growth), your $76k cash investment doubles in ~10 years — after that, you're playing with house money.
Negotiation context
- It's been on market 51 days — a 3% lower offer ($262k) is reasonable based on typical stale-listing flexibility.
- 4 sale attempts since 18y ago with the ask held roughly flat each time — persistent listings suggest the price (not the market) is what's stuck; bring a comps-based counter.
- Current owner paid $120k; list at $270k implies a 125% gain — meaningful room to come down on a strong offer.
Risks & watch-outs
- Climate carrying-cost: severe wind risk, 99% chance of damaging wind over 30y; extreme-heat days projected 7→18/yr by 2055 (HVAC capex compounding) — expect insurance premiums to compound above CPI over the hold.
Questions for the listing agent
- It's been on market 51 days. Have you received any prior offers? Is the seller open to a 10% concession, seller financing, or rate buy-down credit?
- Is there a deadline driving the sale (1031 exchange, divorce, estate, relocation)? That informs how much negotiation room exists.
- Schools are F-rated, which usually means shorter tenancies and higher turnover. Who's the typical renter profile here, and what's been the actual vacancy rate?
- What's the average days-on-market for RENTAL listings here right now (not sales)? A rising rental-DOM trend means longer vacancies and softer asking-rent achievability than the comps imply.
- What's the recent tenant-quality profile in this submarket — average credit score on applications, eviction rate, late-payment / NSF rate, and stable-employment percentage? A property-management company in the area should have these aggregated.
- How much new for-sale + rental construction is in the pipeline within 1–3 miles? Heavy new supply typically softens prices + rents 12–24 months out; constrained supply supports both.
Investment metrics
- 1% rule
- 0.90% ✗
- Cap rate
- 7.78%
- Cash-on-cash
- 5.33%
- DSCR
- 1.24
- GRM
- 9.3
CMA / ARV
- ARV (median comp)
- $297,908
- List price
- $270,000
- Delta
- -9.37%
- Verdict
- FAIR
- Comps
- 20 within 1.0 mi
Show comp detail 12 sales within ~0.75 mi
| Address | Dist | Beds/Ba | Sqft | Sold | Price | $/sf | Match |
|---|---|---|---|---|---|---|---|
| 41 Huquenin Ln | 0.07mi | 2/2.0 | 1,246 (+2%) | 6mo | $240,000 | $193 | 89 |
| 36 Purry Cir | 0.12mi | 2/2.0 | 1,210 (-2%) | 9mo | $210,000 | $174 | 84 |
| 4 Huquenin Ct | 0.05mi | 2/2.0 | 1,151 (-6%) | 10mo | $260,000 | $226 | 79 |
| 16 Seaford Pl | 0.27mi | 2/2.0 | 1,247 (+2%) | 8mo | $330,000 | $265 | 79 |
| 42 Purry Cir | 0.12mi | 2/2.0 | 1,169 (-5%) | 11mo | $230,000 | $197 | 78 |
| 8 Purry Cir | 0.09mi | 2/2.0 | 1,133 (-8%) | 9mo | $275,000 | $243 | 75 |
| 16 Huquenin Ln | 0.01mi | 2/2.0 | 1,089 (-11%) | 10mo | $200,000 | $184 | 73 |
| 89 Padgett Dr | 0.42mi | 2/2.0 | 1,246 (+2%) | 10mo | $274,000 | $220 | 69 |
| 30 Zubler St | 0.11mi | 2/2.0 | 1,053 (-14%) | 7mo | $249,000 | $236 | 66 |
| 48 Purry Cir | 0.13mi | 2/2.0 | 1,396 (+14%) | 12mo | $245,000 | $176 | 61 |
| 12 Padgett Ct | 0.33mi | 2/2.0 | 1,350 (+10%) | 9mo | $275,000 | $204 | 61 |
| 60 Padgett Dr | 0.50mi | 2/2.0 | 1,089 (-11%) | 7mo | $240,000 | $220 | 52 |
Match score weights: distance 35% · size 25% · config 20% · recency 20%. Top-matched comps best support the ARV.
Projected returns pro-forma
-3.0% appreciation · 8.0% rent growth · sell at horizon
- IRR
- -3.3%
- Equity multiple
- 0.87×
- Total profit
- $-9,682
- Equity at exit
- $40,258
- IRR
- 10.8%
- Equity multiple
- 2.02×
- Total profit
- $76,922
- Equity at exit
- $23,345
Cash invested: $75,600 (down + closing). Projections, not guarantees.
Landlord ↔ Tenant lean methodology
- Overall (STATE)
- 90 Strongly Landlord-Friendly
- State South Carolina
- 90 Strongly Landlord-Friendly · R+6
- County
- — inherits STATE
- City
- — inherits STATE
ZIP-level market 29909
- Home prices YoY
- -12.5%
- Rents YoY
- 9.3%
- Active inventory
- 650
- Price-to-rent
- 9.3×
Monthly cashflow live
- Estimated rent
- $2,427 medium interval (Pro) →
- Mortgage (P&I)
- −$1,416
- Tax from tax record
- −$53 /mo · $641/yr
- Insurance
- −$112
- HOA
- −$0
- Vacancy / Maint / Mgmt
- −$510
- Net cashflow
- $336
Break-even live
UW: 25.0% down · 7.5% · 30yr · 1.5% tax · 5.0% vac · 8.0% maint · 8.0% mgmt
Financing live
Cash to close
- Down payment
- $67,500
- Closing costs
- $8,100
- Reserves months
- —
- Total cash needed
- —
Loan-product check · same deal, 3 products live
Conventional
25% down · 7.5% · 30yr
- Down + closing
- —
- Monthly P&I
- —
- Monthly cashflow
- —
- DSCR
- —
- Eligible?
- —
Personal DTI + credit; lowest rate.
DSCR
20% down · 8.5% · 30yr
- Down + closing
- —
- Monthly P&I
- —
- Monthly cashflow
- —
- DSCR
- —
- Eligible?
- —
No personal income docs; deal must DSCR.
Hard money
10% down · 12.0% · 12mo
- Down + closing
- —
- Monthly P&I
- —
- Monthly cashflow
- —
- DSCR
- —
- Eligible?
- —
Short-term bridge; refi at stabilization.
Rent comps 4 comps
| Address | Beds | Baths | Sqft | Rent | $/sqft | DOM | Units | Dist |
|---|---|---|---|---|---|---|---|---|
| 55 Purry Cir Bluffton, SC | 2.0 | 2.0 | 1445 | $2,500 | $1.73 | 43d | 1 | 0.09mi |
| 61 Zubler St Bluffton, SC | 2.0 | 2.0 | 1053 | $1,970 | $1.87 | 21d | 1 | 0.15mi |
| 60 Padgett Dr Bluffton, SC | 2.0 | 2.0 | 1089 | $2,300 | $2.11 | 43d | 1 | 0.50mi |
| 329 Mystic Point Dr Okatie, SC | 2.0 | 2.0 | 1084 | $2,500 | $2.31 | 13d | 1 | 0.63mi |
Listing history 23 events
-
2026-06-18days on market $270,000 Active 51 DOM
-
2026-06-17days on market $270,000 Active 50 DOM
-
2026-06-16days on market $270,000 Active 49 DOM
-
2026-06-15days on market $270,000 Active 48 DOM
-
2026-06-14days on market $270,000 Active 46 DOM
-
2026-06-13days on market $270,000 Active 45 DOM
-
2026-06-10days on market $270,000 Active 43 DOM
-
2026-06-09days on market $270,000 Active 42 DOM
-
2026-06-08days on market $270,000 Active 41 DOM
-
2026-06-07days on market $270,000 Active 40 DOM
-
2026-06-05days on market $270,000 Active 37 DOM
-
2026-06-03days on market $270,000 Active 36 DOM
-
2026-06-02days on market $270,000 Active 35 DOM
-
2026-06-01days on market $270,000 Active 34 DOM
-
2026-05-31days on market $270,000 Active 33 DOM
-
2026-05-01status Active 67-char remark
Show marketing remark (67 chars)
Two-bedrοom, twο-bаth Ѕummerton Villа wіth a patio.
-
2026-04-16historical 67-char remark
Show marketing remark (67 chars)
Two-bedrοom, twο-bаth Ѕummerton Villа wіth a patio.
-
2026-04-15$270,000 Active 51-char remark
Show marketing remark (67 chars)
Two-bedrοom, twο-bаth Ѕummerton Villа wіth a patio.
-
2026-04-15$270,000 Active 67-char remark
Show marketing remark (67 chars)
Two-bedrοom, twο-bаth Ѕummerton Villа wіth a patio.
-
2008-12-31soldstatus $120,000
-
2008-12-29soldstatus $120,000
-
2008-04-04$139,999
-
1997-10-22soldstatus $123,359
ⓘ Source: listings_history table (triggers on properties + properties_extension) + one-shot
backfill from property_details.listing_events for pre-trigger history.
Tax reassessment forecast SC · Resets to sale price
- Current annual tax
- $641 · $53/mo
- Projected year-2 tax
- $1,539 · $128/mo
- Expected delta
- +$898/yr (+$75/mo · 140.0%)
ⓘ Screening estimate from a state-policy table — verify with the county assessor before closing.
Climate risk First Street
- Flood 3/10 Moderate FEMA zone X (unshaded) · 12% chance over 30 yrs
- Wildfire 3/10 Moderate
- Heat 10/10 Extreme 7 d/yr ≥107°F today · 18 d/yr by 30 yrs out
- Wind 8/10 Severe 99% chance of damaging wind over 30 yrs
- Air quality 2/10 Low 2 unhealthy d/yr today · 2 by 30 yrs out
Nearby sold comps map
Loading sold comps map…
Walkable amenities ~0.75 mi
Loading nearby amenities…
Taxation est. · year 1
- Rental income
- $29,127
- − Mortgage interest
- −$15,124
- − Property taxes
- −$641
- − Insurance
- −$1,350
- − Repairs & maintenance
- −$2,330
- − Management
- −$2,330
- − Depreciation
- −$7,855
- Taxable loss
- −$503
- Est. tax savings @ 24.0%
- +$121
- After-tax cash flow
- $4,149/yr
For passive investors: Depreciation is non-cash, so a rental often shows a tax loss while cash-flowing — sheltering income. Rental losses are passive: they offset passive income freely, and up to $25,000/yr can offset ordinary (W-2) income if you actively participate and your MAGI is under $100k (phasing out to $0 by $150k); unused losses carry forward. On sale, claimed depreciation is recaptured at up to 25%, and gains may owe capital-gains tax (a 1031 exchange can defer both). Figures are a year-1 estimate at your 24.0% rate — not tax advice; consult a CPA.
Schools (NCES district)
- District
- Beaufort 01
- NCES district ID
- 4501110
- Math proficiency
- 42% ▼ -8.00%
- Reading proficiency
- 51% ▲ 2.00%
- Median HH income
- $57,430
- Composite
- 40.56/100
- National rank
- #3699
- State rank
- #17 of 80 in SC
Livability — Hardeeville
- Score
- 65/100
- State rank
- #136
- US rank
- #13105
Category grades
Schools grade is shown separately in the Schools card above.
Census & demographics
- County
- Beaufort County · 163,770 people
- City population
- 11,373
- Metro
- Hilton Head Island-Bluffton, SC
- Population (ZIP)
- 24,003
- Household income
- $91,294
- Rent vs Own
- Severe rent burden
- 268.0
Population outlook (Beaufort County) Hauer SSP2
- Today (2025)
- 211,915 people
- By 2030
- 227,272 · +7.2%
- By 2040
- 253,861 · +19.8%
- By 2050
- 275,126 · +29.8%
- By 2075
- 311,022 · +46.8%
- By 2100
- 321,286 · +51.6%
Race, ethnicity, and origin ACS 2023
- Neighborhood character
- Predominantly White (89%)
- Race & ethnicity
- White 89% Black 4% Hispanic / Latino 4% Two or more races 3% Asian 1%
- Common ancestry
- Romanian 5% Lithuanian 3% Slovak 2%
- Foreign-born
- 6% · Canada, Vietnam
- Languages at home
- 94% English-only · Spanish 2% Other Indo-European 1%
Political lean MEDSL · Beaufort
- 2024 margin
- R (+14.5) · D 42.1% · R 56.6% · Other 1.2%
- 2008→2024 swing
- -3.7pp toward R · 2008: -10.8pp · 2024: -14.5pp
- All cycles
- 2024: R+14.5 2020: R+10.0 2016: R+14.3 2012: R+17.5 2008: R+10.8
Not yet ingested
- Civics
- —
Market trends
- HPI YoY
- ▼ -27.99%
- Current HPI
- 196.0491
- Rent YoY
- ▲ 9.31%
- Metro
- Hilton Head Island-Bluffton, SC
- State GDP YoY
- ▲ 4.51%
- F500 in state
- 2
Industry mix (Fortune 500 HQ in SC)
| Industry | F500 HQs | Revenue |
|---|---|---|
| Packaging | 1 | $7B |
|
||
Price history
+118.9% since first listed8 events — show timeline
- 2026-05-01 Relisted — RSMLS
- 2026-04-16 Delisted — RSMLS
- 2026-04-15 Listed $270,000 LRMLS
- 2026-04-15 Listed $270,000 RSMLS
- 2008-12-31 Sold (Public Records) $120,000 Public Records
- 2008-12-29 Sold (MLS) $120,000 RSMLS
- 2008-04-04 Listed $139,999 RSMLS
- 1997-10-22 Sold (Public Records) $123,359 Public Records
Property tax history
+5.0%/yrLatest (2025): $641 · -0.1% YoY. Source: county tax records.
Cash-flow waterfall
monthlySold comps — $/sqft
last 12 mo · ≤1 miLoading sold comps…