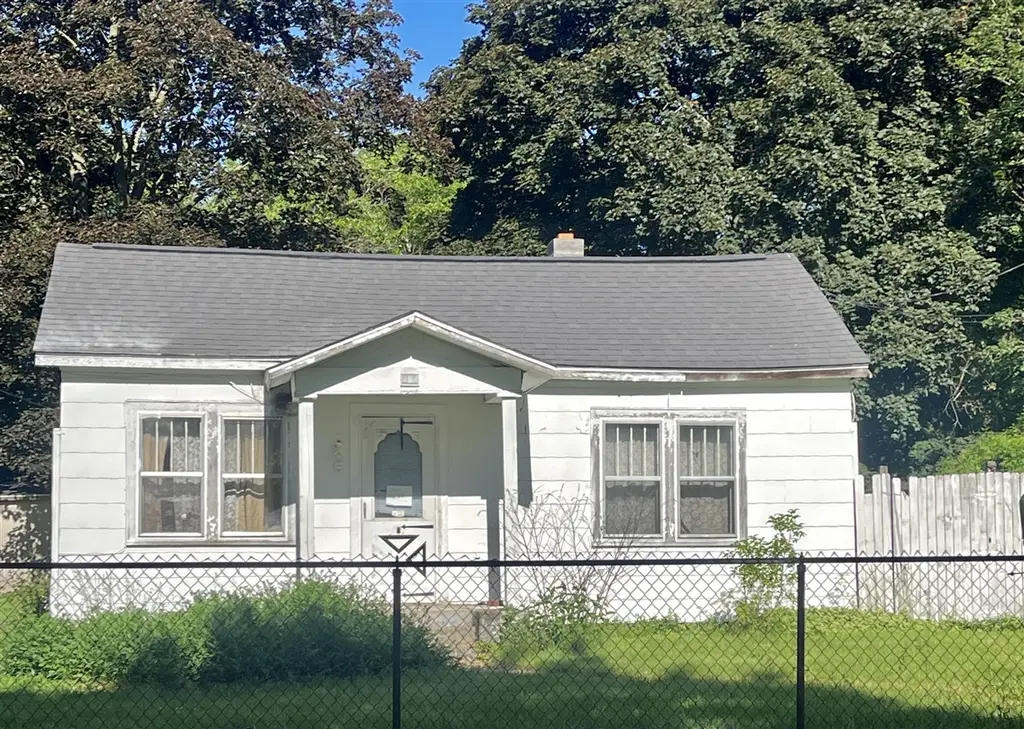
112 Elm St · Coldwater, MI
Flood risk 1/10 · Minimal
- FEMA flood zone
- X (unshaded)
- Chance of flooding over 30 yrs
- 0.0%
- Est. flood insurance / yr
- $473 – $860
Fire risk 1/10 · Minimal
- Est. fire insurance / yr
- $784 – $1,456
Heat risk 3/10 · Minor
- Hot days now (above 98°F)
- 7 days/yr
- Hot days in 30 yrs
- 16 days/yr
Wind risk 2/10 · Minimal
- Chance of severe wind over 30 yrs
- —
Air-quality risk 2/10 · Minimal
- Unhealthy air days now
- 1 days/yr
- Unhealthy air days in 30 yrs
- 2 days/yr
Risk factors via First Street. Map © Google.
Why this score? — see what drove the B grade
The composite is a weighted blend of 9 inputs, each scored 0–100. Each bar is that input's sub-score; the figure is the points it added to the 100-point composite (weight × sub-score).
- Cash flow +29.8/30.0
- ARV discount +15.0/15.0
- DSCR +10.0/10.0
- 1% rule +7.2/10.0
- Livability +3.6/5.0
- Schools +2.7/10.0
- Rent growth +2.5/5.0
- Condition / age +2.5/5.0
- Appreciation +0.0/10.0
$90,000
🖨 Deal sheet 📄 Offer letter ✓ Due diligence
Listing remarks MLS
Nestled on a beautiful 0.52-acre lot shaded by mature trees, this 2-bedroom, 1-bath home offers space, character, and plenty of potential. Inside, you'll find generously sized living areas, a functional layout that includes a large kitchen, spacious bedrooms, and a dedicated laundry room. Several updates have already been started, including improvements to the bathroom and laundry room, as well as some new kitchen cabinets. Outside, the expansive yard offers room to garden, entertain, or simply enjoy the peaceful setting. Whether you're an investor, first-time buyer, or someone looking for a renovation project with strong potential, this property is ready for your vision and finishing touches. Property is being sold as-is. It is the responsibility of the parties looking to satisfy themselves as to the accuracy of this information. Taxes were obtained from the local accessor and the taxes could changer the buyer after a close transaction.
Key facts
- 0.52-acre lot
- Expansive yard
- Large kitchen
Tags
Property features AI
Exterior
- Utilities: Public water
- Home design: Traditional-style single family residence; Built in 1915
- Construction: Other construction materials; Asphalt shingle roof
- Exterior features: Paved road access; Shed(s) on the property
Interior
- Bathrooms: One full bathroom
- Heating & cooling: Forced air heating; Has heating
- Interior features: Six total rooms; Crawl space and Michigan-style basement
Neighborhood map
What this means for you Summary
Snapshot
- This is a 3-bed/1.0-bath single-family listed at $90k.
Deal economics
- At list price, monthly cash flow is $329 ($4k/yr) — positive.
- The deal already cash-flows at list — no discount required.
- Meets the 1% rule at list price ($1k rent vs $90k).
- Cap rate 10.7% vs local median 3.3% in Coldwater — top-decile yield for the area; either an underpriced asset or a hidden risk that comps aren't pricing in. Stress-test before assuming the spread holds.
Location & tenants
- Location reads 71/100 on livability (#270 in MI) — a middle-class / working-renter tenant base. Strengths: cost of living A+, housing A+, health & safety A+; Watch: schools C-, employment D+, amenities F.
- Coldwater Community Schools (town): math 26% / reading 37% proficiency, ranked #344 of 540 in MI (top 64%) — families likely to look elsewhere, expect single-tenant / working-renter base with shorter leases.
- Market conditions: 140 active listings in the ZIP; 2 comparable units currently listed for rent nearby; 43 units permitted in Branch County in 2024 (0 in 5+ unit buildings).
Forward outlook
- Local home prices are declining (-3.0%/yr); year-one equity from $622 of loan paydown is wiped out by about $3k of value loss. Plan a longer hold.
- Branch County population projected at -18% by 2050 — secular population decline; favor cash flow + early exit over multi-decade hold.
- At projected returns (-3.0% appreciation + 3.0% rent growth), your $25k cash investment doubles in ~8 years — after that, you're playing with house money.
Negotiation context
- Only 2 days on market — expect competitive offers; lowballing is unlikely to land.
- 3 sale attempts with the ask held roughly flat each time — persistent listings suggest the price (not the market) is what's stuck; bring a comps-based counter.
Risks & watch-outs
- Watch-outs: built in 1915 — expect roof / HVAC / electrical / plumbing capex.
Questions for the listing agent
- Built in 1915 — when were the roof, HVAC, electrical panel, plumbing, and water heater last replaced?
- Is there a deadline driving the sale (1031 exchange, divorce, estate, relocation)? That informs how much negotiation room exists.
- What's the average days-on-market for RENTAL listings here right now (not sales)? A rising rental-DOM trend means longer vacancies and softer asking-rent achievability than the comps imply.
- What's the recent tenant-quality profile in this submarket — average credit score on applications, eviction rate, late-payment / NSF rate, and stable-employment percentage? A property-management company in the area should have these aggregated.
- How much new for-sale + rental construction is in the pipeline within 1–3 miles? Heavy new supply typically softens prices + rents 12–24 months out; constrained supply supports both.
Investment metrics
- 1% rule
- 1.22% ✓
- Cap rate
- 10.68%
- Cash-on-cash
- 15.68%
- DSCR
- 1.70
- GRM
- 6.8
CMA / ARV
- ARV (on-the-fly)
- $163,560
- Comps found
- 12
Show comp detail 12 sales within ~0.75 mi
| Address | Dist | Beds/Ba | Sqft | Sold | Price | $/sf | Match |
|---|---|---|---|---|---|---|---|
| 112 Elm St | 0.00mi | 2/1.0 (-1) | 1,128 (0%) | 0mo | $81,000 | $72 | 95 |
| 227 Church St | 0.40mi | 2/1.5 (-1) | 1,156 (+2%) | 0mo | $105,000 | $91 | 70 |
| 58 Sherman St | 0.45mi | 3/1.0 | 1,059 (-6%) | 2mo | $185,000 | $175 | 67 |
| 169 E Washington St | 0.10mi | 4/1.0 (+1) | 1,296 (+15%) | 1mo | $100,500 | $78 | 64 |
| 95 S Monroe St | 0.51mi | 3/1.0 | 1,200 (+6%) | 3mo | $71,000 | $59 | 63 |
| 112 Cutter Ave | 0.54mi | 3/1.0 | 1,180 (+5%) | 10mo | $167,500 | $142 | 59 |
| 28 Avery Dr | 0.62mi | 3/1.5 | 1,176 (+4%) | 5mo | $140,000 | $119 | 58 |
| 88 N Sprague St | 0.42mi | 3/1.0 | 1,267 (+12%) | 5mo | $190,000 | $150 | 56 |
| 228 Cutter Ave | 0.64mi | 2/1.0 (-1) | 1,200 (+6%) | 8mo | $180,000 | $150 | 48 |
| 236 Rose St | 0.63mi | 3/1.0 | 1,213 (+8%) | 12mo | $200,000 | $165 | 47 |
| 176 Smith St | 0.67mi | 3/1.0 | 1,255 (+11%) | 8mo | $200,000 | $159 | 43 |
| 195 Cutter Ave | 0.63mi | 2/1.5 (-1) | 1,024 (-9%) | 7mo | $148,450 | $145 | 42 |
Match score weights: distance 35% · size 25% · config 20% · recency 20%. Top-matched comps best support the ARV.
Projected returns pro-forma
-3.0% appreciation · 3.0% rent growth · sell at horizon
- IRR
- 6.5%
- Equity multiple
- 1.25×
- Total profit
- $6,355
- Equity at exit
- $13,419
- IRR
- 15.8%
- Equity multiple
- 2.29×
- Total profit
- $32,397
- Equity at exit
- $7,782
Cash invested: $25,200 (down + closing). Projections, not guarantees.
Landlord ↔ Tenant lean methodology
- Overall (STATE)
- 62 Landlord-Friendly
- State Michigan
- 62 Landlord-Friendly · EVEN
- County
- — inherits STATE
- City
- — inherits STATE
ZIP-level market 49036
- Active inventory
- 140
- Price-to-rent
- 6.8×
Monthly cashflow live
- Estimated rent
- $1,097 medium interval (Pro) →
- Mortgage (P&I)
- −$472
- Tax from tax record
- −$28 /mo · $334/yr
- Insurance
- −$38
- HOA
- −$0
- Vacancy / Maint / Mgmt
- −$230
- Net cashflow
- $329
Break-even live
UW: 25.0% down · 7.5% · 30yr · 1.5% tax · 5.0% vac · 8.0% maint · 8.0% mgmt
Financing live
Cash to close
- Down payment
- $22,500
- Closing costs
- $2,700
- Reserves months
- —
- Total cash needed
- —
Loan-product check · same deal, 3 products live
Conventional
25% down · 7.5% · 30yr
- Down + closing
- —
- Monthly P&I
- —
- Monthly cashflow
- —
- DSCR
- —
- Eligible?
- —
Personal DTI + credit; lowest rate.
DSCR
20% down · 8.5% · 30yr
- Down + closing
- —
- Monthly P&I
- —
- Monthly cashflow
- —
- DSCR
- —
- Eligible?
- —
No personal income docs; deal must DSCR.
Hard money
10% down · 12.0% · 12mo
- Down + closing
- —
- Monthly P&I
- —
- Monthly cashflow
- —
- DSCR
- —
- Eligible?
- —
Short-term bridge; refi at stabilization.
Rent comps 2 comps
| Address | Beds | Baths | Sqft | Rent | $/sqft | DOM | Units | Dist |
|---|---|---|---|---|---|---|---|---|
| 39 Whispering Pines Dr Coldwater, MI | 1.0–3.0 | 1.0–2.0 | 1012 | $1,040 | $1.03 | 43d | 1 | 0.41mi |
| 313 W Chicago St Coldwater, MI | 3.0 | 1.0 | 802 | $1,300 | $1.62 | 43d | 1 | 1.17mi |
Listing history 5 events
-
2026-06-09$90,000 Pending 2 DOM
-
2026-06-02status $90,000 Pending 2 DOM
-
2026-06-01days on market $90,000 Active 2 DOM
-
2026-05-31remarks 699-char remark
-
2026-05-31$90,000 Active 1 DOM
ⓘ Source: listings_history table (triggers on properties + properties_extension) + one-shot
backfill from property_details.listing_events for pre-trigger history.
Tax reassessment forecast MI · Partial reset (capped growth)
- Current annual tax
- $334 · $28/mo
- Projected year-2 tax
- $860 · $72/mo
- Expected delta
- +$526/yr (+$44/mo · 157.8%)
ⓘ Screening estimate from a state-policy table — verify with the county assessor before closing.
Climate risk First Street
- Flood 1/10 Low FEMA zone X (unshaded) · 0% chance over 30 yrs
- Wildfire 1/10 Low
- Heat 3/10 Moderate 7 d/yr ≥98°F today · 16 d/yr by 30 yrs out
- Wind 2/10 Low
- Air quality 2/10 Low 1 unhealthy d/yr today · 2 by 30 yrs out
Nearby sold comps map
Loading sold comps map…
Walkable amenities ~0.75 mi
Loading nearby amenities…
Taxation est. · year 1
- Rental income
- $13,163
- − Mortgage interest
- −$5,041
- − Property taxes
- −$334
- − Insurance
- −$450
- − Repairs & maintenance
- −$1,053
- − Management
- −$1,053
- − Depreciation
- −$2,618
- Taxable income
- $2,614
- Est. tax owed @ 24.0%
- −$627
- After-tax cash flow
- $3,324/yr
For passive investors: Depreciation is non-cash, so a rental often shows a tax loss while cash-flowing — sheltering income. Rental losses are passive: they offset passive income freely, and up to $25,000/yr can offset ordinary (W-2) income if you actively participate and your MAGI is under $100k (phasing out to $0 by $150k); unused losses carry forward. On sale, claimed depreciation is recaptured at up to 25%, and gains may owe capital-gains tax (a 1031 exchange can defer both). Figures are a year-1 estimate at your 24.0% rate — not tax advice; consult a CPA.
Schools (NCES district)
- District
- Coldwater Community Schools
- NCES district ID
- 2610140
- Math proficiency
- 26% ▼ -12.00%
- Reading proficiency
- 37% ▼ -5.00%
- Median HH income
- $44,373
- Composite
- 26.87/100
- National rank
- #7101
- State rank
- #344 of 540 in MI
Livability — Coldwater
- Score
- 71/100
- State rank
- #270
- US rank
- #6664
Category grades
Schools grade is shown separately in the Schools card above.
Census & demographics
- Census place
- Coldwater, MI
- Population (ZIP)
- 24,697
Population outlook (Branch County) Hauer SSP2
- Today (2025)
- 41,079 people
- By 2030
- 39,622 · -3.5%
- By 2040
- 36,584 · -10.9%
- By 2050
- 33,462 · -18.5%
- By 2075
- 26,612 · -35.2%
- By 2100
- 18,580 · -54.8%
Race, ethnicity, and origin ACS 2023
- Neighborhood character
- Predominantly White (86%)
- Race & ethnicity
- White 86% Hispanic / Latino 7% Two or more races 5% Black 3%
- Hispanic origin (detail)
- Mexican 4%
- Common ancestry
- Romanian 5% Iranian 3% Lithuanian 2%
- Foreign-born
- 8% · Canada
- Languages at home
- 86% English-only · Arabic 7% Spanish 5% German/W. Germanic 1%
Political lean MEDSL · Branch
- 2024 margin
- Solid R (+42.4) · D 28.0% · R 70.4% · Other 1.6%
- 2008→2024 swing
- -36.2pp toward R · 2008: -6.1pp · 2024: -42.4pp
- All cycles
- 2024: R+42.4 2020: R+38.5 2016: R+38.1 2012: R+18.7 2008: R+6.1
Not yet ingested
- Civics
- —
Market trends
- HPI YoY
- ▼ -214.60%
- Current HPI
- 192.653
- Rent YoY
- —
- Metro
- —
- State GDP YoY
- ▲ 1.37%
- F500 in state
- 28
Industry mix (Fortune 500 HQ in MI)
| Industry | F500 HQs | Revenue |
|---|---|---|
| Automotive Parts | 3 | $48B |
|
||
| Automotive | 2 | $372B |
|
||
| Chemicals | 1 | $45B |
|
||
| Automotive Retail | 1 | $29B |
|
||
| Healthcare / Medical Devices | 1 | $23B |
|
||
| Automotive Technology | 1 | $20B |
|
||
Price history
+0.0% since first listed3 events — show timeline
- 2026-05-30 Listed $90,000 REALCOMP
- 2026-05-30 Listed $90,000 MiRealSource-MiMLS
- 2026-05-30 Listed $90,000 SW Michigan MLS
Property tax history
-42.5%/yrLatest (2024): $334 · -67.0% YoY. Source: county tax records.
Cash-flow waterfall
monthlySold comps — $/sqft
last 12 mo · ≤1 miLoading sold comps…