4870 US Hwy 93 S #35 · Evergreen, MT
Flood risk 6/10 · Moderate
- FEMA flood zone
- X (shaded)
- Chance of flooding over 30 yrs
- 0.7%
- Est. flood insurance / yr
- $507 – $1,088
Fire risk 4/10 · Minor
- Est. fire insurance / yr
- $918 – $1,706
Heat risk 2/10 · Minimal
- Hot days now (above 90°F)
- 7 days/yr
- Hot days in 30 yrs
- 15 days/yr
Wind risk 1/10 · Minimal
- Chance of severe wind over 30 yrs
- —
Air-quality risk 8/10 · Major
- Unhealthy air days now
- 14 days/yr
- Unhealthy air days in 30 yrs
- 17 days/yr
Risk factors via First Street. Map © Google.
Why this score? — see what drove the B grade
The composite is a weighted blend of 9 inputs, each scored 0–100. Each bar is that input's sub-score; the figure is the points it added to the 100-point composite (weight × sub-score).
- Cash flow +30.0/30.0
- 1% rule +10.0/10.0
- DSCR +10.0/10.0
- ARV discount +7.5/15.0
- Rent growth +3.9/5.0
- Condition / age +3.8/5.0
- Schools +3.5/10.0
- Livability +3.4/5.0
- Appreciation +0.0/10.0
$130,000
🖨 Deal sheet 📄 Offer letter ✓ Due diligence
Key facts
- Outdoor recreation
- Private backyard
- Landscaped yard
Tags
Property features AI
Finance
- Other: Located in Forest Acres subdivision
- HOA & community: Land is leased
Exterior
- Parking: 1-car garage
- Utilities: Electricity connected; Public sewer
- Home design: Manufactured home (single wide); One level
- Construction: Aluminum siding; Other foundation
- Exterior features: Back yard; Garden; Level lot; Playground in the community
Interior
- Kitchen: Dishwasher; Microwave; Range; Refrigerator
- Bathrooms: 2 full bathrooms
- Heating & cooling: Electric heating; Forced air
- Interior features: Dishwasher; Microwave; Range; Refrigerator; Washer hookup; No basement
- Laundry & utility: Washer hookup
Neighborhood map
What this means for you Summary
Snapshot
- This is a 3-bed/2.0-bath manufactured listed at $130k. Condition is rated good.
Deal economics
- At list price, monthly cash flow is $1k ($13k/yr) — positive.
- The deal already cash-flows at list — no discount required.
- Meets the 1% rule at list price ($3k rent vs $130k).
- Recommended offer: $126k (3.0% below list) — sets the bar for market timing.
- Cap rate 16.5% vs local median 2.1% in Evergreen — top-decile yield for the area; either an underpriced asset or a hidden risk that comps aren't pricing in. Stress-test before assuming the spread holds.
Location & tenants
- Location reads 68/100 on livability (#89 in MT) — a middle-class / working-renter tenant base. Strengths: housing A+, health & safety A+, cost of living A; Watch: schools C-, crime C-, amenities F.
- Flathead H S (town): math 29% / reading 52% proficiency, ranked #55 of 116 in MT (top 47%) — families likely to look elsewhere, expect single-tenant / working-renter base with shorter leases.
- Market conditions: Rents rising fast (+5.5%/yr); 410 active listings in the ZIP; solid renter incomes; 281 units permitted in Flathead County in 2024 (80 in 5+ unit buildings).
- This rent runs 40% of the median local income ($75k/yr) — at the standard rent-burdened threshold; future hikes will face affordability resistance.
Forward outlook
- Local home prices are declining (-3.0%/yr); year-one equity from $899 of loan paydown is wiped out by about $4k of value loss. Plan a longer hold.
- Flathead County population projected at +20% by 2050 — long-run rental-demand tailwind backs the buy-and-hold thesis.
- At projected returns (-3.0% appreciation + 5.5% rent growth), your $36k cash investment doubles in ~4 years — after that, you're playing with house money.
Negotiation context
- It's been on market 43 days — a 3% lower offer ($126k) is reasonable based on typical stale-listing flexibility.
Risks & watch-outs
- Climate carrying-cost: major flood risk — expect insurance premiums to compound above CPI over the hold.
Questions for the listing agent
- It's been on market 43 days. Have you received any prior offers? Is the seller open to a 3% concession, seller financing, or rate buy-down credit?
- Is there a deadline driving the sale (1031 exchange, divorce, estate, relocation)? That informs how much negotiation room exists.
- What's the average days-on-market for RENTAL listings here right now (not sales)? A rising rental-DOM trend means longer vacancies and softer asking-rent achievability than the comps imply.
- What's the recent tenant-quality profile in this submarket — average credit score on applications, eviction rate, late-payment / NSF rate, and stable-employment percentage? A property-management company in the area should have these aggregated.
- How much new for-sale + rental construction is in the pipeline within 1–3 miles? Heavy new supply typically softens prices + rents 12–24 months out; constrained supply supports both.
Investment metrics
- 1% rule
- 1.95% ✓
- Cap rate
- 16.45%
- Cash-on-cash
- 36.28%
- DSCR
- 2.61
- GRM
- 4.3
CMA / ARV
- ARV (on-the-fly)
- $331,716
- Comps found
- 1
Show comp detail 1 sale within ~0.75 mi
| Address | Dist | Beds/Ba | Sqft | Sold | Price | $/sf | Match |
|---|---|---|---|---|---|---|---|
| 47 E Nicklaus Dr | 0.75mi | 2/2.0 (-1) | 1,056 (+14%) | 7mo | $379,000 | $359 | 30 |
Match score weights: distance 35% · size 25% · config 20% · recency 20%. Top-matched comps best support the ARV.
Projected returns pro-forma
-3.0% appreciation · 5.46% rent growth · sell at horizon
- IRR
- 34.8%
- Equity multiple
- 2.52×
- Total profit
- $55,475
- Equity at exit
- $19,383
- IRR
- 42.9%
- Equity multiple
- 5.57×
- Total profit
- $166,401
- Equity at exit
- $11,240
Cash invested: $36,400 (down + closing). Projections, not guarantees.
Landlord ↔ Tenant lean methodology
- Overall (STATE)
- 82 Strongly Landlord-Friendly
- State Montana
- 82 Strongly Landlord-Friendly · R+11
- County
- — inherits STATE
- City
- — inherits STATE
ZIP-level market 59937
- Rents YoY
- 5.5%
- Active inventory
- 410
- Price-to-rent
- 4.3×
Monthly cashflow live
- Estimated rent
- $2,530 medium interval (Pro) →
- Mortgage (P&I)
- −$682
- Tax est. 1.5%
- −$162 /mo · $1,950/yr
- Insurance
- −$54
- HOA
- −$0
- Vacancy / Maint / Mgmt
- −$531
- Net cashflow
- $1,100
Break-even live
UW: 25.0% down · 7.5% · 30yr · 1.5% tax · 5.0% vac · 8.0% maint · 8.0% mgmt
Financing live
Cash to close
- Down payment
- $32,500
- Closing costs
- $3,900
- Reserves months
- —
- Total cash needed
- —
Loan-product check · same deal, 3 products live
Conventional
25% down · 7.5% · 30yr
- Down + closing
- —
- Monthly P&I
- —
- Monthly cashflow
- —
- DSCR
- —
- Eligible?
- —
Personal DTI + credit; lowest rate.
DSCR
20% down · 8.5% · 30yr
- Down + closing
- —
- Monthly P&I
- —
- Monthly cashflow
- —
- DSCR
- —
- Eligible?
- —
No personal income docs; deal must DSCR.
Hard money
10% down · 12.0% · 12mo
- Down + closing
- —
- Monthly P&I
- —
- Monthly cashflow
- —
- DSCR
- —
- Eligible?
- —
Short-term bridge; refi at stabilization.
Listing history 18 events
-
2026-06-19days on market $130,000 Active 43 DOM
-
2026-06-18days on market $130,000 Active 42 DOM
-
2026-06-17days on market $130,000 Active 41 DOM
-
2026-06-16days on market $130,000 Active 40 DOM
-
2026-06-15days on market $130,000 Active 39 DOM
-
2026-06-14days on market $130,000 Active 37 DOM
-
2026-06-13days on market $130,000 Active 36 DOM
-
2026-06-10days on market $130,000 Active 34 DOM
-
2026-06-09days on market $130,000 Active 33 DOM
-
2026-06-08days on market $130,000 Active 32 DOM
-
2026-06-07days on market $130,000 Active 31 DOM
-
2026-06-05days on market $130,000 Active 28 DOM
-
2026-06-03days on market $130,000 Active 27 DOM
-
2026-06-02days on market $130,000 Active 26 DOM
-
2026-06-01days on market $130,000 Active 25 DOM
-
2026-05-31days on market $130,000 Active 24 DOM
-
2026-05-30days on market $130,000 Active 23 DOM
-
2026-05-07$130,000 Active
ⓘ Source: listings_history table (triggers on properties + properties_extension) + one-shot
backfill from property_details.listing_events for pre-trigger history.
Climate risk First Street
- Flood 6/10 Major FEMA zone X (shaded) · 70% chance over 30 yrs
- Wildfire 4/10 Moderate
- Heat 2/10 Low 7 d/yr ≥90°F today · 15 d/yr by 30 yrs out
- Wind 1/10 Low
- Air quality 8/10 Severe 14 unhealthy d/yr today · 17 by 30 yrs out
Nearby sold comps map
Loading sold comps map…
Walkable amenities ~0.75 mi
Loading nearby amenities…
Taxation est. · year 1
- Rental income
- $30,362
- − Mortgage interest
- −$7,282
- − Property taxes
- −$1,950
- − Insurance
- −$650
- − Repairs & maintenance
- −$2,429
- − Management
- −$2,429
- − Depreciation
- −$3,782
- Taxable income
- $11,840
- Est. tax owed @ 24.0%
- −$2,842
- After-tax cash flow
- $10,363/yr
For passive investors: Depreciation is non-cash, so a rental often shows a tax loss while cash-flowing — sheltering income. Rental losses are passive: they offset passive income freely, and up to $25,000/yr can offset ordinary (W-2) income if you actively participate and your MAGI is under $100k (phasing out to $0 by $150k); unused losses carry forward. On sale, claimed depreciation is recaptured at up to 25%, and gains may owe capital-gains tax (a 1031 exchange can defer both). Figures are a year-1 estimate at your 24.0% rate — not tax advice; consult a CPA.
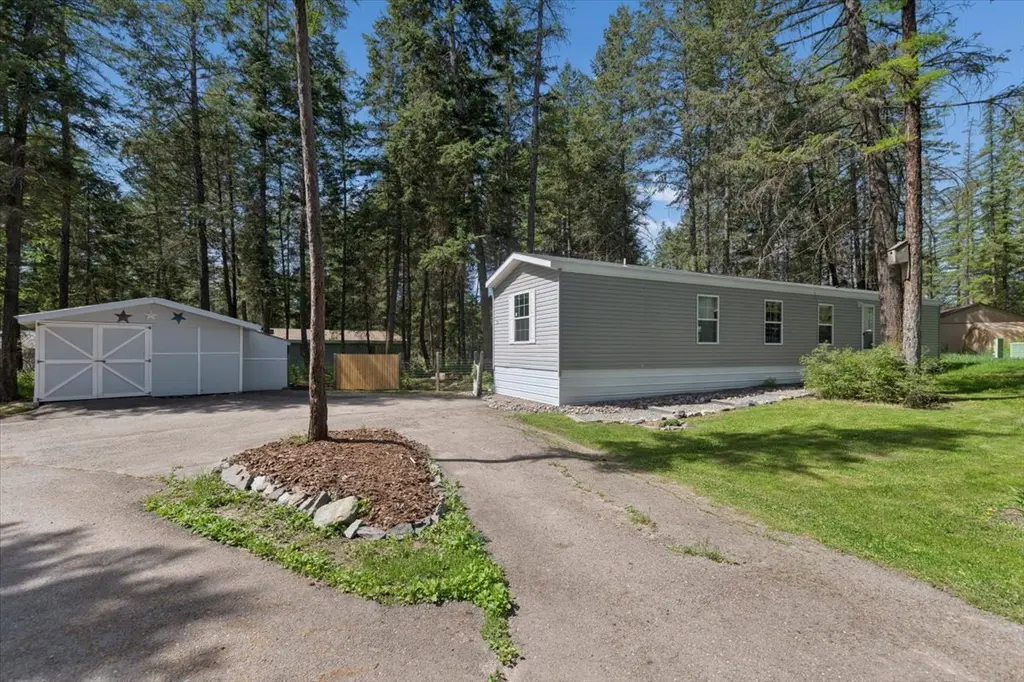
Condition & rehab AI · 6 photos
This manufactured home is in good condition with a good exterior and interior. It has a well-maintained landscaping and curb appeal. Minor updates such as painting and landscaping improvements can further enhance its value.
Value-add opportunities
- Both Painting the exterior siding — Fresh paint can enhance the curb appeal and property value.
- Both Landscaping improvements — Enhanced landscaping can improve the property's curb appeal and attract more potential buyers or renters.
- Both HVAC maintenance — A well-maintained HVAC system can improve comfort and energy efficiency, both of which are important factors for buyers and renters.
- Both Interior cleaning and staging — A clean and staged interior can make the property more appealing to potential buyers or renters and help it sell or rent faster.
Renovation cost estimate screening
Value-add ROI direction
- Both Painting the exterior siding — Fresh paint can enhance the curb appeal and property value. ↑
- Both Landscaping improvements — Enhanced landscaping can improve the property's curb appeal and attract more potential buyers or renters. ↑
- Both HVAC maintenance — A well-maintained HVAC system can improve comfort and energy efficiency, both of which are important factors for buyers and renters. ↑
- Both Interior cleaning and staging — A clean and staged interior can make the property more appealing to potential buyers or renters and help it sell or rent faster. ↑
ⓘ Cost ranges are severity-bucket heuristics (US national rule-of-thumb). Get contractor quotes + a written scope before underwriting a rehab budget.
Schools (NCES district)
- District
- Flathead H S
- NCES district ID
- 3015420
- Math proficiency
- 29% ▼ -6.00%
- Reading proficiency
- 52% ▼ -3.00%
- Median HH income
- $49,712
- Composite
- 34.79/100
- National rank
- #5115
- State rank
- #55 of 116 in MT
Livability — Evergreen
- Score
- 68/100
- State rank
- #89
- US rank
- #9272
Category grades
Schools grade is shown separately in the Schools card above.
Census & demographics
- Census place
- Evergreen, MT
- County
- Flathead County · 94,027 people
- Metro
- Kalispell, MT
- Population (ZIP)
- 15,114
- Household income
- $75,428
- Rent vs Own
- Severe rent burden
- 518.0
Population outlook (Flathead County) Hauer SSP2
- Today (2025)
- 108,002 people
- By 2030
- 113,362 · +5.0%
- By 2040
- 122,245 · +13.2%
- By 2050
- 129,517 · +19.9%
- By 2075
- 146,737 · +35.9%
- By 2100
- 155,045 · +43.6%
Race, ethnicity, and origin ACS 2023
- Neighborhood character
- Predominantly White (95%)
- Race & ethnicity
- White 95% Two or more races 3% Hispanic / Latino 2%
- Common ancestry
- Portuguese 8% Romanian 3% Lithuanian 3%
- Foreign-born
- 3% · Canada
- Languages at home
- 98% English-only · Spanish 1%
Political lean MEDSL · Flathead
- 2024 margin
- Solid R (+33.8) · D 31.8% · R 65.5% · Other 2.7%
- 2008→2024 swing
- -12.2pp toward R · 2008: -21.6pp · 2024: -33.8pp
- All cycles
- 2024: R+33.8 2020: R+29.9 2016: R+36.5 2012: R+33.4 2008: R+21.6
Not yet ingested
- Civics
- —
Market trends
- HPI YoY
- ▼ -300.57%
- Current HPI
- 256.7041
- Rent YoY
- ▲ 5.46%
- Metro
- Kalispell, MT
- State GDP YoY
- ▲ 3.41%
- F500 in state
- 2
Industry mix (Fortune 500 HQ in MT)
| Industry | F500 HQs | Revenue |
|---|---|---|
| Technology / Analytics | 1 | $2B |
|
||
Price history
1 event — show timeline
- 2026-05-07 Listed $130,000 MRMLS
Cash-flow waterfall
monthlySold comps — $/sqft
last 12 mo · ≤1 miLoading sold comps…