 🏗️ New Construction
943 Spotted Egret Loop · Ruskin, FL
Flood risk No data
- FEMA flood zone
- —
- Chance of flooding over 30 yrs
- —
- Est. flood insurance / yr
- —
Fire risk No data
- Est. fire insurance / yr
- —
Heat risk No data
- Hot days now (above threshold)
- —
- Hot days in 30 yrs
- —
Wind risk No data
- Chance of severe wind over 30 yrs
- —
Air-quality risk No data
- Unhealthy air days now
- —
- Unhealthy air days in 30 yrs
- —
Risk factors via First Street. Map © Google.
Why this score? — see what drove the D- grade
The composite is a weighted blend of 9 inputs, each scored 0–100. Each bar is that input's sub-score; the figure is the points it added to the 100-point composite (weight × sub-score).
- Cash flow +9.7/30.0
- ARV discount +7.5/15.0
- Schools +4.2/10.0
- Livability +3.6/5.0
- 1% rule +3.5/10.0
- DSCR +2.7/10.0
- Rent growth +2.7/5.0
- Condition / age +2.5/5.0
- Appreciation +0.0/10.0
$259,990
🖨 Deal sheet 📄 Offer letter ✓ Due diligence
Listing remarks
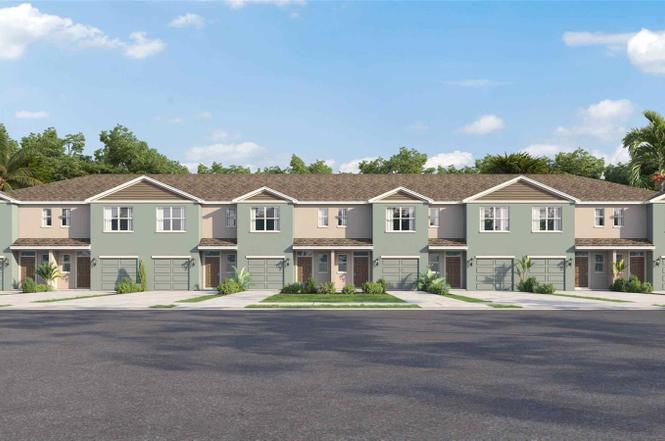
Under Construction. Ruskin Reserve is NO CDD community that offers a mix of single-family homes and townhomes designed for modern living. Conveniently located near US-41 and I-75, the community provides easy access to Tampa, Apollo Beach, and Sun City Center. Enjoy nearby outdoor attractions like EG Simmons Regional Park and Little Manatee River State Park, along with a variety of shopping, dining, and entertainment options. Homes in Ruskin Reserve feature Smart Home System, durable concrete block construction, and energy-efficient designs, making this community ideal for families and professionals alike. Pictures, photographs, colors, features, and sizes are for illustration purposes only
Key facts
- No cdd community
- Smart home system
- Easy access to tampa
Tags
Neighborhood map
What this means for you Summary
Snapshot
- This is a 3-bed/2.5-bath land listed at $260k.
Deal economics
- At list price, monthly cash flow is $-171 ($-2k/yr) — negative.
- To cash-flow at today's rent, offer at most $235k (9.5% below list).
- To meet the 1% rule (rent ≥ 1% of price), the offer needs to be $222k (14.6% below list).
- Recommended offer: $222k (14.6% below list) — sets the bar for 1% rule.
Location & tenants
- Location reads 71/100 on livability (#392 in FL) — a middle-class / working-renter tenant base. Strengths: cost of living A+, housing A+, commute B+; Watch: amenities F, health & safety F.
- Hillsborough (suburban): math 47% / reading 50% proficiency, ranked #41 of 73 in FL (top 56%) — families likely to look elsewhere, expect single-tenant / working-renter base with shorter leases.
- Zoned schools: Thompson Elementary (math 42% / reading 40%, grade F, #1,454 of 2,144 statewide, top 69%, 744 students, 69% FRL); Lennard High School (math 30% / reading 46%, grade F, #328 of 667 statewide, top 50%, 2,404 students, 47% FRL).
- Market conditions: Rents flat; 489 active listings in the ZIP; 22 comparable units currently listed for rent nearby; rentals leasing fast (median 5d on market — plan ~1-2 weeks tenant-placement turnaround); 9,053 units permitted in Hillsborough County in 2024 (4,555 in 5+ unit buildings).
- This rent runs 37% of the median local income ($72k/yr) — at the standard rent-burdened threshold; future hikes will face affordability resistance.
Forward outlook
- Local home prices are declining (-3.0%/yr); year-one equity from $2k of loan paydown is wiped out by about $8k of value loss. Plan a longer hold.
- Hillsborough County population projected at +37% by 2050 — long-run rental-demand tailwind backs the buy-and-hold thesis.
Negotiation context
- It's been on market 69 days — a 6% lower offer ($244k) is reasonable based on typical stale-listing flexibility.
Questions for the listing agent
- What do current leases actually rent for vs. the listed asking? Can we see a recent rent roll and the last 12 months of T-12 income?
- It's been on market 69 days. Have you received any prior offers? Is the seller open to a 15% concession, seller financing, or rate buy-down credit?
- What does the HOA fee cover, when was the last increase, and are there any pending special assessments or reserve-fund shortfalls?
- Why hasn't it sold? Are there any deal-killer items the seller is aware of (foundation, flood, title, zoning, code violations)?
- Is there a deadline driving the sale (1031 exchange, divorce, estate, relocation)? That informs how much negotiation room exists.
- Schools are F-rated, which usually means shorter tenancies and higher turnover. Who's the typical renter profile here, and what's been the actual vacancy rate?
- The area grade is low — what's the realistic commute time and amenity access for the typical tenant pool here? Any planned neighborhood developments (good or bad) we should know about?
- What's the average days-on-market for RENTAL listings here right now (not sales)? A rising rental-DOM trend means longer vacancies and softer asking-rent achievability than the comps imply.
- What's the recent tenant-quality profile in this submarket — average credit score on applications, eviction rate, late-payment / NSF rate, and stable-employment percentage? A property-management company in the area should have these aggregated.
- How much new for-sale + rental construction is in the pipeline within 1–3 miles? Heavy new supply typically softens prices + rents 12–24 months out; constrained supply supports both.
Investment metrics
- 1% rule
- 0.85% ✗
- Cap rate
- 5.51%
- Cash-on-cash
- -2.81%
- DSCR
- 0.87
- GRM
- 9.8
CMA / ARV
No comps found within radius.
Projected returns pro-forma
-3.0% appreciation · 0.9% rent growth · sell at horizon
- IRR
- -23.5%
- Equity multiple
- 0.21×
- Total profit
- $-57,471
- Equity at exit
- $38,765
- IRR
- -25.7%
- Equity multiple
- -0.12×
- Total profit
- $-81,645
- Equity at exit
- $22,479
Cash invested: $72,797 (down + closing). Projections, not guarantees.
Landlord ↔ Tenant lean methodology
- Overall (STATE)
- 87 Strongly Landlord-Friendly
- State Florida
- 87 Strongly Landlord-Friendly · R+3
- County
- — inherits STATE
- City
- — inherits STATE
ZIP-level market 33570
- Home prices YoY
- -28.8%
- Rents YoY
- 0.9%
- Active inventory
- 489
- Price-to-rent
- 9.8×
Monthly cashflow live
- Estimated rent
- $2,219 high interval (Pro) →
- Mortgage (P&I)
- −$1,363
- Tax est. 1.5%
- −$325 /mo · $3,900/yr
- Insurance
- −$108
- HOA
- −$127
- Vacancy / Maint / Mgmt
- −$466
- Net cashflow
- $-171
Break-even live
UW: 25.0% down · 7.5% · 30yr · 1.5% tax · 5.0% vac · 8.0% maint · 8.0% mgmt
Financing live
Cash to close
- Down payment
- $64,998
- Closing costs
- $7,800
- Reserves months
- —
- Total cash needed
- —
Loan-product check · same deal, 3 products live
Conventional
25% down · 7.5% · 30yr
- Down + closing
- —
- Monthly P&I
- —
- Monthly cashflow
- —
- DSCR
- —
- Eligible?
- —
Personal DTI + credit; lowest rate.
DSCR
20% down · 8.5% · 30yr
- Down + closing
- —
- Monthly P&I
- —
- Monthly cashflow
- —
- DSCR
- —
- Eligible?
- —
No personal income docs; deal must DSCR.
Hard money
10% down · 12.0% · 12mo
- Down + closing
- —
- Monthly P&I
- —
- Monthly cashflow
- —
- DSCR
- —
- Eligible?
- —
Short-term bridge; refi at stabilization.
Rent comps 22 comps
| Address | Beds | Baths | Sqft | Rent | $/sqft | DOM | Units | Dist |
|---|---|---|---|---|---|---|---|---|
| 1029 Spotted Egret Loop Ruskin, FL | 3.0 | 2.5 | 1463 | $2,150 | $1.47 | 5d | 1 | 0.03mi |
| 424 Newmont Cir Ruskin, FL | 3.0 | 3.0 | 1707 | $1,950 | $1.14 | 24d | 1 | 0.57mi |
| 1251 9th St SE Ruskin, FL | 3.0–4.0 | 2.0–2.5 | 1650 | $2,111 | $1.28 | 5d | 1 | 0.65mi |
| 724 Royal Empress Dr Ruskin, FL | 3.0 | 2.5 | 1796 | $2,195 | $1.22 | 3d | 1 | 0.68mi |
| 320 Blue Point Dr Ruskin, FL | 4.0 | 2.0 | 1767 | $2,145 | $1.21 | 3d | 1 | 0.72mi |
| 1409 Delano Trent St Ruskin, FL | 3.0 | 2.0 | 1238 | $1,800 | $1.45 | 5d | 1 | 0.73mi |
| 811 15th St NE Ruskin, FL | 3.0 | 3.0 | 1870 | $2,076 | $1.11 | 14d | 1 | 0.76mi |
| 1609 Carson White Ln Ruskin, FL | 4.0 | 3.0 | 1808 | $2,215 | $1.23 | 2d | 1 | 0.81mi |
| 1113 Brenton Leaf Dr Ruskin, FL | 3.0 | 2.0 | 1383 | $1,985 | $1.44 | 20d | 1 | 0.89mi |
| 2025 Peaceful Palm St Ruskin, FL | 4.0 | 2.0 | 1606 | $2,600 | $1.62 | 14d | 1 | 0.99mi |
| 1216 Humble Haven St Ruskin, FL | 2.0 | 1.0 | 1400 | $1,300 | $0.93 | 4d | 1 | 1.04mi |
| 213 6th Ave NW Ruskin, FL | 3.0 | 1.0 | 1620 | $1,795 | $1.11 | 2d | 1 | 1.14mi |
| 1740 Chatham Green Cir Ruskin, FL | 3.0 | 2.0 | 1378 | $2,200 | $1.60 | 3d | 1 | 1.20mi |
| 1501 21st St SE Ruskin, FL | 4.0 | 2.0 | 1618 | $2,155 | $1.33 | 4d | 1 | 1.22mi |
| 966 Kelly Fern Loop Ruskin, FL | 3.0 | 2.0 | 1412 | $2,190 | $1.55 | 4d | 1 | 1.23mi |
| 2541 Sunray Venus Way Ruskin, FL | 2.0 | 2.5 | 1690 | $1,900 | $1.12 | 15d | 1 | 1.24mi |
| 2340 Harris Hawk Ave Ruskin, FL | 3.0 | 2.0 | 1420 | $2,049 | $1.44 | 24d | 1 | 1.26mi |
| 837 Chatham Walk Dr Ruskin, FL | 3.0 | 2.0 | 1404 | $2,350 | $1.67 | 24d | 1 | 1.26mi |
| 720 Chatham Walk Dr Ruskin, FL | 3.0 | 2.0 | 1404 | $1,985 | $1.41 | 5d | 1 | 1.33mi |
| 2655 Buttercup Lucine Ln Ruskin, FL | 2.0 | 2.5 | 1540 | $2,000 | $1.30 | 11d | 1 | 1.35mi |
| 2304 Pleasure Run Dr Ruskin, FL | 3.0 | 2.0 | 1276 | $1,970 | $1.54 | 4d | 1 | 1.39mi |
| 1827 Harbour Blue St Ruskin, FL | 3.0 | 2.0 | 1352 | $1,995 | $1.48 | 24d | 1 | 1.47mi |
HOA detail
- Monthly dues
- $127 · $1,524/yr
Listing history 5 events
-
2026-04-13status Pending
-
2026-04-08price $259,990
-
2026-04-01price $282,990
-
2026-02-17price $281,990
-
2026-02-03$279,990 Active
ⓘ Source: listings_history table (triggers on properties + properties_extension) + one-shot
backfill from property_details.listing_events for pre-trigger history.
Nearby sold comps map
Loading sold comps map…
Walkable amenities ~0.75 mi
Loading nearby amenities…
Taxation est. · year 1
- Rental income
- $26,631
- − Mortgage interest
- −$14,563
- − Property taxes
- −$3,900
- − Insurance
- −$1,300
- − Repairs & maintenance
- −$2,130
- − Management
- −$2,130
- − HOA
- −$1,524
- − Depreciation
- −$7,563
- Taxable loss
- −$6,480
- Est. tax savings @ 24.0%
- +$1,555
- After-tax cash flow
- $-491/yr
For passive investors: Depreciation is non-cash, so a rental often shows a tax loss while cash-flowing — sheltering income. Rental losses are passive: they offset passive income freely, and up to $25,000/yr can offset ordinary (W-2) income if you actively participate and your MAGI is under $100k (phasing out to $0 by $150k); unused losses carry forward. On sale, claimed depreciation is recaptured at up to 25%, and gains may owe capital-gains tax (a 1031 exchange can defer both). Figures are a year-1 estimate at your 24.0% rate — not tax advice; consult a CPA.
Schools (NCES district)
- District
- Hillsborough
- NCES district ID
- 1200870
- Math proficiency
- 47% ▼ -8.00%
- Reading proficiency
- 50% ▼ -4.00%
- Median HH income
- $50,622
- Composite
- 41.6/100
- National rank
- #3435
- State rank
- #41 of 73 in FL
Livability — Ruskin
- Score
- 71/100
- State rank
- #392
- US rank
- #6879
Category grades
Schools grade is shown separately in the Schools card above.
Census & demographics
- Census place
- Ruskin, FL
- County
- Hillsborough County · 1,540,968 people
- City population
- 33,319
- Metro
- Tampa-St. Petersburg-Clearwater, FL
- Population (ZIP)
- 33,319
- Household income
- $72,172
- Rent vs Own
- Severe rent burden
- 611.0
Population outlook (Hillsborough County) Hauer SSP2
- Today (2025)
- 1,607,022 people
- By 2030
- 1,733,968 · +7.9%
- By 2040
- 1,979,565 · +23.2%
- By 2050
- 2,203,427 · +37.1%
- By 2075
- 2,667,893 · +66.0%
- By 2100
- 2,891,558 · +79.9%
Race, ethnicity, and origin ACS 2023
- Neighborhood character
- Diverse neighborhood (Simpson 0.69)
- Race & ethnicity
- White 40% Hispanic / Latino 32% Black 23% Two or more races 13% Asian 2%
- Hispanic origin (detail)
- Mexican 16% Puerto Rican 6% Cuban 1% Dominican 4%
- Common ancestry
- Italian 2% Romanian 2% Hispanic 2%
- Foreign-born
- 13% · Canada, Jamaica
- Languages at home
- 72% English-only · Spanish 23% French/Haitian/Cajun 2%
Political lean MEDSL · Hillsborough
- 2024 margin
- Toss-up / Even · D 47.8% · R 50.9% · Other 1.3%
- 2008→2024 swing
- -10.2pp toward R · 2008: 7.1pp · 2024: -3.1pp
- All cycles
- 2024: R+3.1 2020: D+6.9 2016: D+6.8 2012: D+6.7 2008: D+7.1
Not yet ingested
- Civics
- —
Market trends
- HPI YoY
- ▼ -112.10%
- Current HPI
- 277.8257
- Rent YoY
- ▲ 0.90%
- Metro
- Tampa-St. Petersburg-Clearwater, FL
- State GDP YoY
- ▲ 3.28%
- F500 in state
- 36
Industry mix (Fortune 500 HQ in FL)
| Industry | F500 HQs | Revenue |
|---|---|---|
| Industrial Technology | 2 | $29B |
|
||
| Insurance | 2 | $17B |
|
||
| Retail | 1 | $60B |
|
||
| Technology Distribution | 1 | $58B |
|
||
| Homebuilding | 1 | $35B |
|
||
| Technology Manufacturing | 1 | $35B |
|
||
Price history
-7.1% since first listed5 events — show timeline
- 2026-04-13 Pending — Stellar MLS as Distributed by MLS Grid
- 2026-04-08 Price Changed $259,990 Stellar MLS as Distributed by MLS Grid
- 2026-04-01 Price Changed $282,990 Stellar MLS as Distributed by MLS Grid
- 2026-02-17 Price Changed $281,990 Stellar MLS as Distributed by MLS Grid
- 2026-02-03 Listed $279,990 Stellar MLS as Distributed by MLS Grid
Cash-flow waterfall
monthlySold comps — $/sqft
last 12 mo · ≤1 miLoading sold comps…