1604 S 12th St · St. Joseph, MO
Flood risk No data
- FEMA flood zone
- —
- Chance of flooding over 30 yrs
- —
- Est. flood insurance / yr
- —
Fire risk No data
- Est. fire insurance / yr
- —
Heat risk No data
- Hot days now (above threshold)
- —
- Hot days in 30 yrs
- —
Wind risk No data
- Chance of severe wind over 30 yrs
- —
Air-quality risk No data
- Unhealthy air days now
- —
- Unhealthy air days in 30 yrs
- —
Risk factors via First Street. Map © Google.
Why this score? — see what drove the D grade
The composite is a weighted blend of 9 inputs, each scored 0–100. Each bar is that input's sub-score; the figure is the points it added to the 100-point composite (weight × sub-score).
- Cash flow +21.8/30.0
- DSCR +7.0/10.0
- 1% rule +4.7/10.0
- Schools +2.8/10.0
- Condition / age +2.8/5.0
- Rent growth +2.5/5.0
- Livability +2.5/5.0
- ARV discount +0.0/15.0
- Appreciation +0.0/10.0
$95,000
🖨 Deal sheet (PDF) 📄 Offer letter ✓ Due diligence
Listing remarks MLS
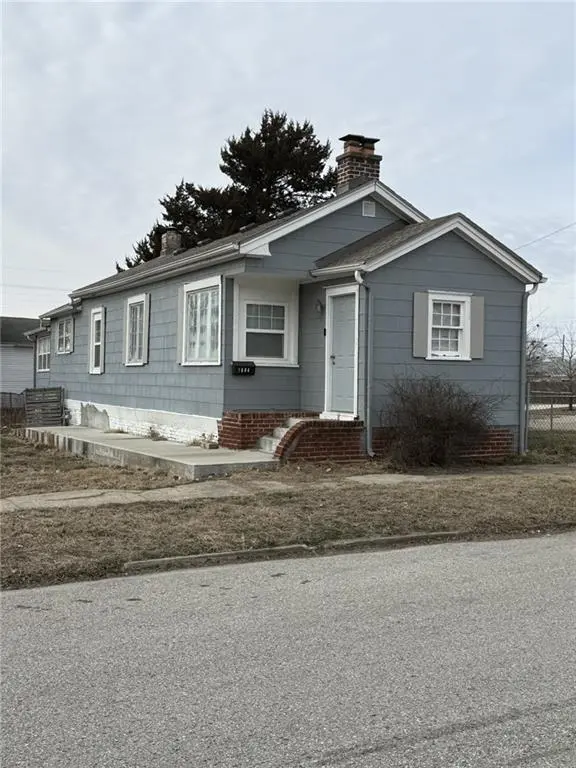
Attention investors! This two bedroom, one bathroom home was recently updated with luxury vinyl plank and fresh paint and an updated kitchen and bathroom. The home is currently occupied by long-term tenants. This turn-key property will make a great addition to any portfolio!
Key facts
- Luxury vinyl plank
- Updated kitchen
- Updated bathroom
Tags
Neighborhood map
What this means for you Summary
Snapshot
- This is a 2-bed/1.0-bath single-family listed at $95k. Condition is rated average.
Deal economics
- At list price, monthly cash flow is $148 ($2k/yr) — positive.
- The deal already cash-flows at list — no discount required.
- To meet the 1% rule (rent ≥ 1% of price), the offer needs to be $92k (3.0% below list).
- Recommended offer: $84k (12.0% below list) — sets the bar for market timing.
- Cap rate 8.2% vs local median 4.7% in St. Joseph — top-decile yield for the area; either an underpriced asset or a hidden risk that comps aren't pricing in. Stress-test before assuming the spread holds.
Location & tenants
- Location reads: area grade D — affects rentability + tenant quality, not the cash-flow math above.
- St. Joseph (urban): math 28% / reading 38% proficiency, ranked #241 of 324 in MO (top 74%) — families likely to look elsewhere, expect single-tenant / working-renter base with shorter leases.
- Zoned schools: Carden Park Elem (math 34% / reading 34%, grade F, #739 of 1,115 statewide, top 67%, 577 students, 100% FRL); Truman Middle (math 17% / reading 27%, grade F, #332 of 391 statewide, top 86%, 482 students, 99% FRL); Lafayette High (math 16% / reading 47%, grade F, #371 of 521 statewide, top 71%, 717 students, 100% FRL) — zoned schools average 100% FRL vs 53% district-wide (47 pts higher); higher-poverty schools than district average — tighter screening recommended.
- Market conditions: 89 active listings in the ZIP; 9 comparable units currently listed for rent nearby; rentals lingering (median 46d on market — plan ~5-8 weeks vacancy on turnover, expect pricing pressure); 100% of comp listings sitting > 30 days — soft ceiling on asking rent; 70 units permitted in Buchanan County in 2024 (0 in 5+ unit buildings).
Forward outlook
- Local home prices are declining (-3.0%/yr); year-one equity from $657 of loan paydown is wiped out by about $3k of value loss. Plan a longer hold.
- Buchanan County population projected to shrink 6% by 2050 — rents likely to lag national; underwrite the cash flow, not the appreciation.
Negotiation context
- It's been on market 137 days — a 12% lower offer ($84k) is reasonable based on typical stale-listing flexibility.
Risks & watch-outs
- Watch-outs: built in 1888 — expect roof / HVAC / electrical / plumbing capex.
Questions for the listing agent
- It's been on market 137 days. Have you received any prior offers? Is the seller open to a 12% concession, seller financing, or rate buy-down credit?
- Built in 1888 — when were the roof, HVAC, electrical panel, plumbing, and water heater last replaced?
- Why hasn't it sold? Are there any deal-killer items the seller is aware of (foundation, flood, title, zoning, code violations)?
- Is there a deadline driving the sale (1031 exchange, divorce, estate, relocation)? That informs how much negotiation room exists.
- The area grade is low — what's the realistic commute time and amenity access for the typical tenant pool here? Any planned neighborhood developments (good or bad) we should know about?
- What's the average days-on-market for RENTAL listings here right now (not sales)? A rising rental-DOM trend means longer vacancies and softer asking-rent achievability than the comps imply.
- What's the recent tenant-quality profile in this submarket — average credit score on applications, eviction rate, late-payment / NSF rate, and stable-employment percentage? A property-management company in the area should have these aggregated.
- How much new for-sale + rental construction is in the pipeline within 1–3 miles? Heavy new supply typically softens prices + rents 12–24 months out; constrained supply supports both.
Investment metrics
- 1% rule
- 0.97% ✗
- Cap rate
- 8.16%
- Cash-on-cash
- 6.67%
- DSCR
- 1.30
- GRM
- 8.6
CMA / ARV
- ARV (median comp)
- $72,621
- List price
- $95,000
- Delta
- 30.82%
- Verdict
- OVERPRICED
- Comps
- 20 within 1.0 mi
Show comp detail 12 sales within ~0.75 mi
| Address | Dist | Beds/Ba | Sqft | Sold | Price | $/sf | Match |
|---|---|---|---|---|---|---|---|
| 1616 S 10th St | 0.14mi | 2/1.0 | 835 (-1%) | 4mo | $35,000 | $42 | 90 |
| 1118 S 13th St | 0.29mi | 3/1.0 (+1) | 816 (-3%) | 4mo | $119,000 | $146 | 73 |
| 1409 Pacific St | 0.33mi | 2/1.0 | 896 (+7%) | 6mo | $112,067 | $125 | 68 |
| 1611 Seneca St | 0.44mi | 3/1.0 (+1) | 825 (-2%) | 8mo | $23,000 | $28 | 65 |
| 2502 S 15th St | 0.68mi | 2/1.0 | 826 (-2%) | 2mo | $56,000 | $68 | 64 |
| 1501 Pacific St | 0.35mi | 2/1.0 | 936 (+11%) | 2mo | $79,900 | $85 | 63 |
| 2115 S 10th St | 0.36mi | 1/1.0 (-1) | 765 (-9%) | 9mo | $7,900 | $10 | 56 |
| 2340 S 13th St | 0.57mi | 2/1.0 | 924 (+10%) | 8mo | $134,900 | $146 | 50 |
| 717 S 17th St | 0.65mi | 2/1.0 | 716 (-15%) | 3mo | $114,500 | $160 | 43 |
| 2403 S 16th St | 0.63mi | 3/1.0 (+1) | 934 (+11%) | 8mo | $154,000 | $165 | 40 |
| 2531 S 13th St | 0.64mi | 2/1.0 | 717 (-15%) | 9mo | $82,000 | $114 | 38 |
| 2419 S 10th St | 0.61mi | 3/1.0 (+1) | 950 (+13%) | 9mo | $147,000 | $155 | 37 |
Match score weights: distance 35% · size 25% · config 20% · recency 20%. Top-matched comps best support the ARV.
Projected returns pro-forma
-3.0% appreciation · 3.0% rent growth · sell at horizon
- IRR
- -6.1%
- Equity multiple
- 0.77×
- Total profit
- $-6,013
- Equity at exit
- $14,165
- IRR
- 3.5%
- Equity multiple
- 1.25×
- Total profit
- $6,753
- Equity at exit
- $8,214
Cash invested: $26,600 (down + closing). Projections, not guarantees.
Landlord ↔ Tenant lean methodology
- Overall (STATE)
- 81 Strongly Landlord-Friendly
- State Missouri
- 81 Strongly Landlord-Friendly · R+10
- County
- — inherits STATE
- City
- — inherits STATE
ZIP-level market 64503
- Active inventory
- 89
- Price-to-rent
- 8.6×
Monthly cashflow live
- Estimated rent
- $922 high interval (Pro) →
- Mortgage (P&I)
- −$498
- Tax from tax record
- −$43 /mo · $513/yr
- Insurance
- −$40
- HOA
- −$0
- Vacancy / Maint / Mgmt
- −$194
- Net cashflow
- $148
Break-even live
Sensitivity live
| Price | -10% $202 | -5% $175 | +0% $148 | +5% $121 | +10% $94 |
|---|---|---|---|---|---|
| Rent | -10% $75 | -5% $111 | +0% $148 | +5% $184 | +10% $221 |
| Rate | -1.0pp $196 | -0.5pp $172 | base $148 | +0.5pp $123 | +1.0pp $98 |
UW: 25.0% down · 7.5% · 30yr · 1.5% tax · 5.0% vac · 8.0% maint · 8.0% mgmt
Financing live
Cash to close
- Down payment
- $23,750
- Closing costs
- $2,850
- Reserves months
- —
- Total cash needed
- —
Loan-product check · same deal, 3 products live
Conventional
25% down · 7.5% · 30yr
- Down + closing
- —
- Monthly P&I
- —
- Monthly cashflow
- —
- DSCR
- —
- Eligible?
- —
Personal DTI + credit; lowest rate.
DSCR
20% down · 8.5% · 30yr
- Down + closing
- —
- Monthly P&I
- —
- Monthly cashflow
- —
- DSCR
- —
- Eligible?
- —
No personal income docs; deal must DSCR.
Hard money
10% down · 12.0% · 12mo
- Down + closing
- —
- Monthly P&I
- —
- Monthly cashflow
- —
- DSCR
- —
- Eligible?
- —
Short-term bridge; refi at stabilization.
Rent comps 9 comps
| Address | Beds | Baths | Sqft | Rent | $/sqft | DOM | Units | Dist |
|---|---|---|---|---|---|---|---|---|
| 1300 S 11th St Apt 22 St Joseph, MO | 2.0 | 1.0 | 866 | $998 | $1.15 | 45d | 1 | 0.21mi |
| 2219 S 10th St Saint Joseph, MO | 2.0 | 1.0 | 800 | $900 | $1.12 | 45d | 1 | 0.40mi |
| 1106 Olive St Saint Joseph, MO | 2.0 | 1.0 | 700 | $725 | $1.04 | 45d | 1 | 0.47mi |
| 303 S 13th St St Joseph, MO | 3.0 | 1.5 | 1000 | $950 | $0.95 | 45d | 1 | 0.89mi |
| 201 S 10th St Saint Joseph, MO | 2.0 | 1.0 | 600 | $1,000 | $1.67 | 45d | 1 | 0.93mi |
| 1015 Faraon St St Joseph, MO | 1.0 | 1.0 | 743 | $820 | $1.10 | 45d | 1 | 1.19mi |
| 516 N 10th St Saint Joseph, MO | 1.0–2.0 | 1.0 | 700 | $900 | $1.29 | 45d | 1 | 1.30mi |
| 2408 Jules St Saint Joseph, MO | 2.0 | 1.0 | 1032 | $1,100 | $1.07 | 45d | 1 | 1.36mi |
| 809 Hall St Unit B St Joseph, MO | 1.0 | 1.0 | 750 | $850 | $1.13 | 45d | 1 | 1.44mi |
Listing history 10 events
-
2026-06-09days on market $95,000 Active 137 DOM
-
2026-06-08days on market $95,000 Active 136 DOM
-
2026-06-07days on market $95,000 Active 135 DOM
-
2026-06-03days on market $95,000 Active 131 DOM
-
2026-06-02days on market $95,000 Active 130 DOM
-
2026-06-01days on market $95,000 Active 129 DOM
-
2026-05-31days on market $95,000 Active 128 DOM
-
2026-05-30days on market $95,000 Active 127 DOM
-
2026-01-23$95,000 Active 276-char remark
Show marketing remark (276 chars)
Attention investors! This two bedroom, one bathroom home was recently updated with luxury vinyl plank and fresh paint and an updated kitchen and bathroom. The home is currently occupied by long-term tenants. This turn-key property will make a great addition to any portfolio!
-
2023-05-29historical
ⓘ Source: listings_history table (triggers on properties + properties_extension) + one-shot
backfill from property_details.listing_events for pre-trigger history.
Tax reassessment forecast MO · Resets to sale price
- Current annual tax
- $513 · $43/mo
- Projected year-2 tax
- $922 · $77/mo
- Expected delta
- +$409/yr (+$34/mo · 79.6%)
ⓘ Screening estimate from a state-policy table — verify with the county assessor before closing.
Nearby sold comps map
Loading sold comps map…
Walkable amenities ~0.75 mi
Loading nearby amenities…
Taxation est. · year 1
- Rental income
- $11,063
- − Mortgage interest
- −$5,321
- − Property taxes
- −$513
- − Insurance
- −$475
- − Repairs & maintenance
- −$885
- − Management
- −$885
- − Depreciation
- −$2,764
- Taxable income
- $220
- Est. tax owed @ 24.0%
- −$53
- After-tax cash flow
- $1,721/yr
For passive investors: Depreciation is non-cash, so a rental often shows a tax loss while cash-flowing — sheltering income. Rental losses are passive: they offset passive income freely, and up to $25,000/yr can offset ordinary (W-2) income if you actively participate and your MAGI is under $100k (phasing out to $0 by $150k); unused losses carry forward. On sale, claimed depreciation is recaptured at up to 25%, and gains may owe capital-gains tax (a 1031 exchange can defer both). Figures are a year-1 estimate at your 24.0% rate — not tax advice; consult a CPA.
Condition & rehab AI · 1 photo
This two-bedroom, one-bathroom home has been recently updated with luxury vinyl plank flooring and fresh paint, making it a turn-key investment opportunity. However, some landscaping and exterior painting would further enhance its curb appeal and value.
Value-add opportunities
- Both Landscaping and curb appeal improvements — Enhances curb appeal and can attract more tenants.
- Both Painting exterior — Fresh paint can improve the home's appearance and value.
- Both Landscaping and curb appeal improvements — Enhances curb appeal and can attract more tenants.
Renovation cost estimate screening
Value-add ROI direction
- Both Landscaping and curb appeal improvements — Enhances curb appeal and can attract more tenants. ↑
- Both Painting exterior — Fresh paint can improve the home's appearance and value. ↑
- Both Landscaping and curb appeal improvements — Enhances curb appeal and can attract more tenants. ↑
ⓘ Cost ranges are severity-bucket heuristics (US national rule-of-thumb). Get contractor quotes + a written scope before underwriting a rehab budget.
Schools (NCES district)
- District
- St. Joseph
- NCES district ID
- 2927060
- Math proficiency
- 28% ▼ -6.00%
- Reading proficiency
- 38% ▼ -1.00%
- Median HH income
- $43,007
- Composite
- 27.99/100
- National rank
- #6853
- State rank
- #241 of 324 in MO
Livability — St. Joseph
No livability data for this city. (Only ~50 U.S. cities are tracked.)
Census & demographics
- Census place
- St. Joseph, MO
- City population
- 44,382
- Population (ZIP)
- 11,921
Population outlook (Buchanan County) Hauer SSP2
- Today (2025)
- 89,041 people
- By 2030
- 88,401 · -0.7%
- By 2040
- 86,220 · -3.2%
- By 2050
- 83,603 · -6.1%
- By 2075
- 76,750 · -13.8%
- By 2100
- 67,623 · -24.1%
Race, ethnicity, and origin ACS 2023
- Neighborhood character
- Predominantly White (85%)
- Race & ethnicity
- White 85% Two or more races 8% Hispanic / Latino 6% Black 3% Asian 1%
- Hispanic origin (detail)
- Mexican 4% Cuban 1%
- Common ancestry
- Romanian 2% Lithuanian 2% Slovak 1%
- Foreign-born
- 3% · Canada
- Languages at home
- 96% English-only · Spanish 2% Other Indo-European 1%
Political lean MEDSL · Buchanan
- 2024 margin
- Strong R (+28.0) · D 35.2% · R 63.3% · Other 1.5%
- 2008→2024 swing
- -28.2pp toward R · 2008: 0.1pp · 2024: -28.0pp
- All cycles
- 2024: R+28.0 2020: R+24.6 2016: R+26.2 2012: R+8.7 2008: D+0.1
Not yet ingested
- Civics
- —
Market trends
- HPI YoY
- ▼ -128.03%
- Current HPI
- 185.3921
- Rent YoY
- —
- Metro
- —
- State GDP YoY
- ▲ 1.84%
- F500 in state
- 20
Industry mix (Fortune 500 HQ in MO)
| Industry | F500 HQs | Revenue |
|---|---|---|
| Healthcare | 1 | $163B |
|
||
| Insurance | 1 | $21B |
|
||
| Industrial Technology | 1 | $17B |
|
||
| Retail | 1 | $16B |
|
||
| Industrial Distribution | 1 | $10B |
|
||
| Utilities | 1 | $9B |
|
||
Price history
2 events — show timeline
- 2026-01-23 Listed $95,000 Heartland MLS as Distributed by MLS Grid
- 2023-05-29 Rental Removed — RENT.
Property tax history
+4.7%/yrLatest (2025): $513 · +6.0% YoY. Source: county tax records.
Cash-flow waterfall
monthlySold comps — $/sqft
last 12 mo · ≤1 miLoading sold comps…