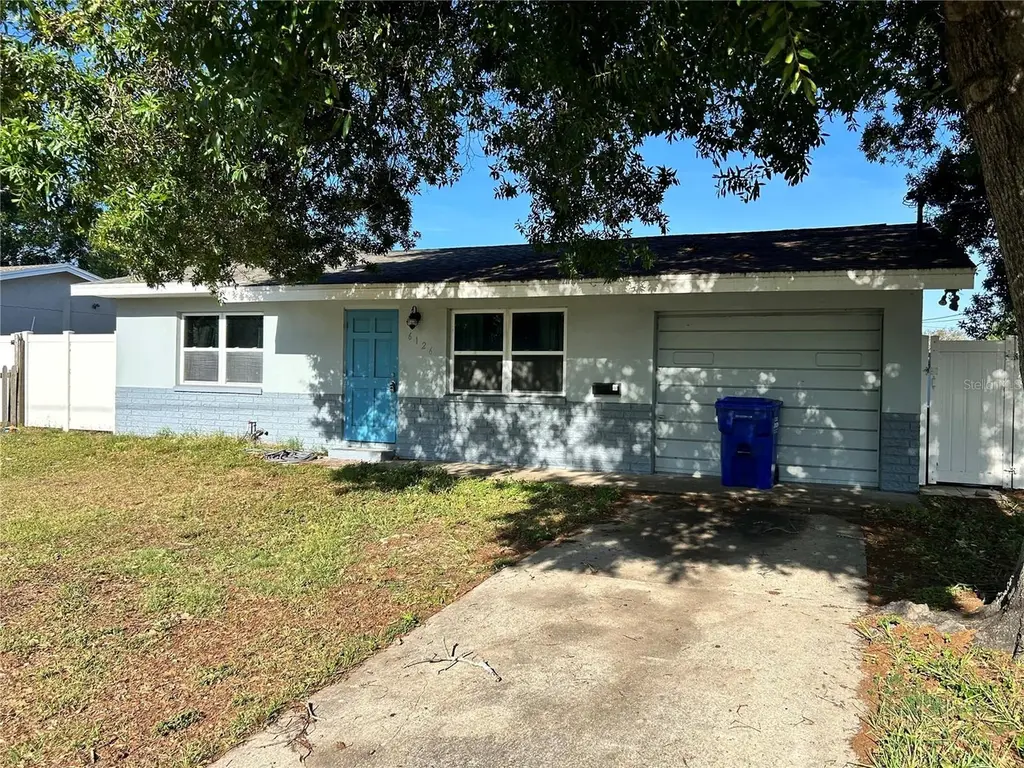
6126 58th St N · West Lealman, FL
Flood risk 1/10 · Minimal
- FEMA flood zone
- X (shaded)
- Chance of flooding over 30 yrs
- 0.0%
- Est. flood insurance / yr
- $507 – $1,088
Fire risk 1/10 · Minimal
- Est. fire insurance / yr
- $947 – $1,759
Heat risk 10/10 · Severe
- Hot days now (above 107°F)
- 7 days/yr
- Hot days in 30 yrs
- 23 days/yr
Wind risk 10/10 · Severe
- Chance of severe wind over 30 yrs
- 99.0%
Air-quality risk 4/10 · Minor
- Unhealthy air days now
- 4 days/yr
- Unhealthy air days in 30 yrs
- 4 days/yr
Risk factors via First Street. Map © Google.
Why this score? — see what drove the B grade
The composite is a weighted blend of 9 inputs, each scored 0–100. Each bar is that input's sub-score; the figure is the points it added to the 100-point composite (weight × sub-score).
- Cash flow +30.0/30.0
- 1% rule +10.0/10.0
- DSCR +10.0/10.0
- ARV discount +7.5/15.0
- Schools +4.3/10.0
- Livability +4.0/5.0
- Rent growth +2.7/5.0
- Condition / age +2.5/5.0
- Appreciation +0.0/10.0
$129,900
🖨 Deal sheet 📄 Offer letter ✓ Due diligence
Listing remarks MLS
REMODELED 3 Rooms and 2 bathrooms with a big backyard for extra rooms or a new pool, (137.4' x 65'). newly remodeled in 2021. This property is in the Saint Petersburg area. This home has been lovingly updated throughout. The home is perfect for entertaining with all families in the backyard and is ready for making a pool. Schedule your showing today!
Key facts
- 8,925 sq ft lot
- Garage
- Built 1959
Property features AI
Finance
- Other: Property zoned R-3; Living area approximately 1,075 (public records); Building area listed as 1,251
- HOA & community: No association
Exterior
- Parking: Attached garage (1-car)
- Utilities: Public water; Public sewer; Broadband/high-speed internet available; Electricity connected
- Home design: Single-family residence; One-story; Faces east; Fixer condition; Homestead exempt
- Construction: Block construction; Shingle roof; Slab foundation; Built on a 0.2-acre lot (approx. 65 x 102)
- Exterior features: Wood fencing; Lakefront with 60 feet of frontage; Lake view and lake access; Paved public-maintained road
Interior
- Kitchen: Range; Microwave; Refrigerator; Electric water heater
- Bedrooms: 3 bedrooms
- Flooring: Laminate flooring
- Bathrooms: 2 full bathrooms
- Heating & cooling: Electric heating; Central air conditioning
- Interior features: Ceiling fans
- Laundry & utility: Laundry area located in the garage
Neighborhood map
What this means for you Summary
Snapshot
- This is a 3-bed/2.0-bath single-family listed at $130k.
Deal economics
- At list price, monthly cash flow is $584 ($7k/yr) — positive.
- The deal already cash-flows at list — no discount required.
- Meets the 1% rule at list price ($2k rent vs $130k).
- Cap rate 11.7% vs local median 1.8% in West Lealman — top-decile yield for the area; either an underpriced asset or a hidden risk that comps aren't pricing in. Stress-test before assuming the spread holds.
Location & tenants
- Location reads 81/100 on livability (#84 in FL, #1,396 nationally) — a professional / high-income tenant draw. Strengths: commute A+, cost of living A+, housing A+; Watch: schools C-, employment D+, amenities F.
- Pinellas (suburban): math 51% / reading 51% proficiency, ranked #31 of 73 in FL (top 42%) — acceptable for families but not a draw, mixed tenant base, ~2y average lease.
- Market conditions: Rents flat; 309 active listings in the ZIP; 40 comparable units currently listed for rent nearby; rentals at typical pace (median 15d on market — plan ~3-4 weeks tenant-placement turnaround); 2,676 units permitted in Pinellas County in 2024 (1,422 in 5+ unit buildings).
- At $2,158/mo this rent would consume 48% of the median local household income ($54k/yr) (locally 712% of renters already pay >50% of income on rent) — very limited rent-growth headroom before tenants either downsize or default.
Forward outlook
- Local home prices are declining (-3.0%/yr); year-one equity from $898 of loan paydown is wiped out by about $4k of value loss. Plan a longer hold.
- Pinellas County population projected at +14% by 2050 — modest demand growth; plan on rents tracking national, not racing it.
- At projected returns (-3.0% appreciation + 1.0% rent growth), your $36k cash investment doubles in ~8 years — after that, you're playing with house money.
Negotiation context
- Only 1 days on market — expect competitive offers; lowballing is unlikely to land.
- 9 sale attempts since 13y ago with the ask held roughly flat each time — persistent listings suggest the price (not the market) is what's stuck; bring a comps-based counter.
Risks & watch-outs
- Watch-outs: property tax is 3.6% of price; built in 1959 — expect roof / HVAC / electrical / plumbing capex.
- Climate carrying-cost: severe wind risk, 99% chance of damaging wind over 30y; extreme-heat days projected 7→23/yr by 2055 (HVAC capex compounding) — expect insurance premiums to compound above CPI over the hold.
Questions for the listing agent
- Built in 1959 — when were the roof, HVAC, electrical panel, plumbing, and water heater last replaced?
- Property tax is high relative to price — has the assessment been appealed recently, and will the sale trigger a re-assessment?
- Is there a deadline driving the sale (1031 exchange, divorce, estate, relocation)? That informs how much negotiation room exists.
- What's the average days-on-market for RENTAL listings here right now (not sales)? A rising rental-DOM trend means longer vacancies and softer asking-rent achievability than the comps imply.
- What's the recent tenant-quality profile in this submarket — average credit score on applications, eviction rate, late-payment / NSF rate, and stable-employment percentage? A property-management company in the area should have these aggregated.
- How much new for-sale + rental construction is in the pipeline within 1–3 miles? Heavy new supply typically softens prices + rents 12–24 months out; constrained supply supports both.
Investment metrics
- 1% rule
- 1.66% ✓
- Cap rate
- 11.69%
- Cash-on-cash
- 19.27%
- DSCR
- 1.86
- GRM
- 5.0
CMA / ARV
- ARV (on-the-fly)
- $321,425
- Comps found
- 12
Show comp detail 12 sales within ~0.75 mi
| Address | Dist | Beds/Ba | Sqft | Sold | Price | $/sf | Match |
|---|---|---|---|---|---|---|---|
| 5833 Mckee Lake Dr N | 0.04mi | 2/1.0 (-1) | 1,056 (-2%) | 1mo | $280,000 | $265 | 85 |
| 5865 63rd Ave N | 0.17mi | 3/1.0 | 985 (-8%) | 0mo | $325,000 | $330 | 74 |
| 5529 57th Ave N | 0.32mi | 2/1.0 (-1) | 1,040 (-3%) | 0mo | $315,000 | $303 | 70 |
| 5991 63rd Ter N | 0.30mi | 3/2.0 | 1,168 (+9%) | 2mo | $315,000 | $270 | 70 |
| 5481 65th Ave N | 0.39mi | 4/2.0 (+1) | 1,112 (+3%) | 2mo | $375,000 | $337 | 70 |
| 5281 57th St N | 0.50mi | 2/1.0 (-1) | 1,080 (+0%) | 1mo | $318,000 | $294 | 66 |
| 5235 54th Ave N | 0.63mi | 2/2.0 (-1) | 1,079 (+0%) | 3mo | $319,000 | $296 | 63 |
| 5948 51st Ave N | 0.66mi | 3/1.0 | 1,053 (-2%) | 3mo | $375,000 | $356 | 59 |
| 5421 64th Ave N | 0.38mi | 4/2.0 (+1) | 1,200 (+12%) | 2mo | $295,000 | $246 | 56 |
| 5763 55th Ter N | 0.34mi | 2/2.0 (-1) | 1,216 (+13%) | 1mo | $363,000 | $299 | 56 |
| 5965 62nd Ave N | 0.22mi | 2/1.0 (-1) | 914 (-15%) | 3mo | $220,000 | $241 | 54 |
| 5599 49th Ave N | 0.70mi | 2/1.0 (-1) | 1,053 (-2%) | 4mo | $315,500 | $300 | 51 |
Match score weights: distance 35% · size 25% · config 20% · recency 20%. Top-matched comps best support the ARV.
Projected returns pro-forma
-3.0% appreciation · 0.99% rent growth · sell at horizon
- IRR
- 8.7%
- Equity multiple
- 1.33×
- Total profit
- $12,045
- Equity at exit
- $19,369
- IRR
- 15.9%
- Equity multiple
- 2.16×
- Total profit
- $42,221
- Equity at exit
- $11,231
Cash invested: $36,372 (down + closing). Projections, not guarantees.
Landlord ↔ Tenant lean methodology
- Overall (STATE)
- 87 Strongly Landlord-Friendly
- State Florida
- 87 Strongly Landlord-Friendly · R+3
- County
- — inherits STATE
- City
- — inherits STATE
ZIP-level market 33709
- Rents YoY
- 1.0%
- Active inventory
- 309
- Price-to-rent
- 5.0×
Monthly cashflow live
- Estimated rent
- $2,158 high interval (Pro) →
- Mortgage (P&I)
- −$681
- Tax from tax record
- −$385 /mo · $4,622/yr
- Insurance
- −$54
- HOA
- −$0
- Vacancy / Maint / Mgmt
- −$453
- Net cashflow
- $584
Break-even live
UW: 25.0% down · 7.5% · 30yr · 1.5% tax · 5.0% vac · 8.0% maint · 8.0% mgmt
Financing live
Cash to close
- Down payment
- $32,475
- Closing costs
- $3,897
- Reserves months
- —
- Total cash needed
- —
Loan-product check · same deal, 3 products live
Conventional
25% down · 7.5% · 30yr
- Down + closing
- —
- Monthly P&I
- —
- Monthly cashflow
- —
- DSCR
- —
- Eligible?
- —
Personal DTI + credit; lowest rate.
DSCR
20% down · 8.5% · 30yr
- Down + closing
- —
- Monthly P&I
- —
- Monthly cashflow
- —
- DSCR
- —
- Eligible?
- —
No personal income docs; deal must DSCR.
Hard money
10% down · 12.0% · 12mo
- Down + closing
- —
- Monthly P&I
- —
- Monthly cashflow
- —
- DSCR
- —
- Eligible?
- —
Short-term bridge; refi at stabilization.
Rent comps 40 comps
| Address | Beds | Baths | Sqft | Rent | $/sqft | DOM | Units | Dist |
|---|---|---|---|---|---|---|---|---|
| 5957 McKee Lake Dr N Saint Petersburg, FL | 3.0 | 2.0 | 1152 | $2,400 | $2.08 | 4d | 1 | 0.13mi |
| 5870 56th Ave N Kenneth City, FL | 2.0 | 1.0–2.0 | 850 | $1,595 | $1.88 | 3d | 7 | 0.22mi |
| 5540 59th St N Saint Petersburg, FL | 2.0 | 1.0 | 824 | $2,100 | $2.55 | 4d | 1 | 0.32mi |
| 5526 59th Way N Unit 1 St. Petersburg, FL | 2.0 | 1.0 | 1384 | $1,750 | $1.26 | 24d | 1 | 0.38mi |
| 5457 59th St N Unit NA St. Petersburg, FL | 2.0 | 1.0 | 800 | $2,400 | $3.00 | 24d | 1 | 0.38mi |
| 5511 65th Ter N Pinellas Park, FL | 3.0 | 2.0 | 1212 | $2,466 | $2.03 | 14d | 1 | 0.42mi |
| 5401 65th Ter Apt B Pinellas Park, FL | 2.0 | 2.0 | 832 | $1,450 | $1.74 | 24d | 1 | 0.48mi |
| 5597 67th Ave N Unit 423 Pinellas Park, FL | 2.0 | 2.0 | 845 | $2,000 | $2.37 | 2d | 1 | 0.48mi |
| 5323 59th Cir W Kenneth City, FL | 1.0–2.0 | 1.0 | 800 | $1,375 | $1.72 | 3d | 4 | 0.51mi |
| 6215 58th Ave N Saint Petersburg, FL | 2.0 | 1.0 | 850 | $1,900 | $2.24 | 4d | 1 | 0.52mi |
| 7005 59th St N Pinellas Park, FL | 3.0 | 2.0 | 1274 | $2,889 | $2.27 | 24d | 1 | 0.62mi |
| 5255 62nd St N Kenneth City, FL | 1.0–3.0 | 1.0–2.0 | 1000 | $1,775 | $1.77 | 2d | 2 | 0.65mi |
| 5038 54th Way N Saint Petersburg, FL | 3.0 | 2.0 | 1366 | $2,500 | $1.83 | 24d | 1 | 0.70mi |
| 6045 71st Ave N Pinellas Park, FL | 3.0 | 2.0 | 1200 | $3,150 | $2.62 | 4d | 1 | 0.72mi |
| 7102 62nd St N Pinellas Park, FL | 2.0 | 1.0 | 816 | $1,850 | $2.27 | 14d | 1 | 0.81mi |
| 5261 48th Ter N Saint Petersburg, FL | 3.0 | 2.0 | 1283 | $2,400 | $1.87 | 11d | 1 | 0.88mi |
| 5290 48th Ave N Saint Petersburg, FL | 3.0 | 1.0 | 1320 | $2,415 | $1.83 | 4d | 1 | 0.93mi |
| 6524 54th Ave N Unit 2 St. Petersburg, FL | 2.0 | 1.0 | 840 | $1,360 | $1.62 | 24d | 1 | 0.95mi |
| 7200 63rd St Unit 7250-D Pinellas Park, FL | 2.0 | 1.0 | 845 | $1,595 | $1.89 | 24d | 1 | 0.97mi |
| 7380 63rd St Unit 90 Pinellas Park, FL | 2.0 | 1.0 | 850 | $1,300 | $1.53 | 14d | 1 | 1.00mi |
| 6522 54th Ave N Saint Petersburg, FL | 1.0–3.0 | 1.0–2.0 | 892 | $1,900 | $2.13 | 1d | 10 | 1.01mi |
| 4732 68th Ave N Pinellas Park, FL | 2.0 | 3.0 | 1210 | $2,000 | $1.65 | 24d | 1 | 1.01mi |
| 6898 47th Ln N Pinellas Park, FL | 3.0 | 2.5 | 1500 | $2,525 | $1.68 | 24d | 1 | 1.04mi |
| 7050 48th St N Pinellas Park, FL | 3.0 | 1.5 | 1008 | $2,350 | $2.33 | 24d | 1 | 1.07mi |
| 5541 Lown St N Apt S St. Petersburg, FL | 2.0 | 1.0 | 850 | $1,600 | $1.88 | 7d | 1 | 1.15mi |
| 4631 69th Pl N Pinellas Park, FL | 3.0 | 2.5 | 1420 | $2,595 | $1.83 | 24d | 1 | 1.15mi |
| 4675 72nd Ave N Pinellas Park, FL | 2.0 | 1.0 | 750 | $1,649 | $2.20 | 21d | 1 | 1.20mi |
| 4000 58th St N Kenneth City, FL | 2.0 | 1.0 | 900 | $1,649 | $1.83 | 14d | 4 | 1.23mi |
| 7800 52nd St N Pinellas Park, FL | 3.0 | 1.0 | 1163 | $1,850 | $1.59 | 24d | 1 | 1.24mi |
| 5660 81st Ave N Pinellas Park, FL | 4.0 | 1.0 | 1300 | $2,295 | $1.77 | 4d | 1 | 1.26mi |
| 7911 52nd Way N Pinellas Park, FL | 4.0 | 1.0 | 1036 | $2,500 | $2.41 | 24d | 1 | 1.28mi |
| 5136 68th St N Unit B St. Petersburg, FL | 3.0 | 1.0 | 1302 | $1,900 | $1.46 | 4d | 1 | 1.35mi |
| 5136 68th St N Unit C St. Petersburg, FL | 2.0 | 1.0 | 957 | $1,700 | $1.78 | 4d | 1 | 1.35mi |
| 6484 44th Ave N Kenneth City, FL | 4.0 | 2.0 | 1211 | $2,383 | $1.97 | 24d | 1 | 1.35mi |
| 5410 70th Way N Saint Petersburg, FL | 3.0 | 1.0 | 1354 | $2,100 | $1.55 | 3d | 1 | 1.42mi |
| 5410 70th Way N Saint Petersburg, FL | 3.0 | 1.0 | 1160 | $2,100 | $1.81 | 4d | 1 | 1.42mi |
| 6398 Woodland Blvd Unit 1366035P Pinellas Park, FL | 3.0 | 2.0 | 1367 | $5,922 | $4.33 | 16d | 1 | 1.42mi |
| 4091 58th Ave N Unit F St. Petersburg, FL | 2.0 | 1.0 | 900 | $1,595 | $1.77 | 3d | 1 | 1.43mi |
| 5870 38th Ave N #40 Saint Petersburg, FL | 2.0 | 1.0 | 985 | $1,800 | $1.83 | 16d | 1 | 1.44mi |
| 4520 76th Ave N Pinellas Park, FL | 2.0 | 1.0 | 700 | $1,545 | $2.21 | 24d | 1 | 1.45mi |
Listing history 3 events
-
2026-06-13status $129,900 Pending 1 DOM
-
2026-06-10remarks 55-char remark
-
2026-06-10$129,900 Active 1 DOM
ⓘ Source: listings_history table (triggers on properties + properties_extension) + one-shot
backfill from property_details.listing_events for pre-trigger history.
Tax reassessment forecast FL · Resets to sale price
- Current annual tax
- $4,622 · $385/mo
- Projected year-2 tax
- $4,622 · $385/mo
- Expected delta
- $0/yr ($0/mo · 0.0%)
ⓘ Screening estimate from a state-policy table — verify with the county assessor before closing.
Climate risk First Street
- Flood 1/10 Low FEMA zone X (shaded) · 0% chance over 30 yrs
- Wildfire 1/10 Low
- Heat 10/10 Extreme 7 d/yr ≥107°F today · 23 d/yr by 30 yrs out
- Wind 10/10 Extreme 99% chance of damaging wind over 30 yrs
- Air quality 4/10 Moderate 4 unhealthy d/yr today · 4 by 30 yrs out
Nearby sold comps map
Loading sold comps map…
Walkable amenities ~0.75 mi
Loading nearby amenities…
Taxation est. · year 1
- Rental income
- $25,893
- − Mortgage interest
- −$7,276
- − Property taxes
- −$4,622
- − Insurance
- −$650
- − Repairs & maintenance
- −$2,071
- − Management
- −$2,071
- − Depreciation
- −$3,779
- Taxable income
- $5,423
- Est. tax owed @ 24.0%
- −$1,302
- After-tax cash flow
- $5,708/yr
For passive investors: Depreciation is non-cash, so a rental often shows a tax loss while cash-flowing — sheltering income. Rental losses are passive: they offset passive income freely, and up to $25,000/yr can offset ordinary (W-2) income if you actively participate and your MAGI is under $100k (phasing out to $0 by $150k); unused losses carry forward. On sale, claimed depreciation is recaptured at up to 25%, and gains may owe capital-gains tax (a 1031 exchange can defer both). Figures are a year-1 estimate at your 24.0% rate — not tax advice; consult a CPA.
Schools (NCES district)
- District
- Pinellas
- NCES district ID
- 1201560
- Math proficiency
- 51% ▼ -5.00%
- Reading proficiency
- 51% ▼ -3.00%
- Median HH income
- $46,270
- Composite
- 43.27/100
- National rank
- #3046
- State rank
- #31 of 73 in FL
Livability — West Lealman
- Score
- 81/100
- State rank
- #84
- US rank
- #1396
Category grades
Schools grade is shown separately in the Schools card above.
Census & demographics
- Census place
- West Lealman, FL
- County
- Pinellas County · 939,478 people
- City population
- 25,371
- Metro
- Tampa-St. Petersburg-Clearwater, FL
- Population (ZIP)
- 25,050
- Household income
- $53,501
- Rent vs Own
- Severe rent burden
- 712.0
Population outlook (Pinellas County) Hauer SSP2
- Today (2025)
- 1,027,532 people
- By 2030
- 1,063,586 · +3.5%
- By 2040
- 1,125,020 · +9.5%
- By 2050
- 1,168,637 · +13.7%
- By 2075
- 1,265,188 · +23.1%
- By 2100
- 1,260,357 · +22.7%
Race, ethnicity, and origin ACS 2023
- Neighborhood character
- Predominantly White (73%)
- Race & ethnicity
- White 73% Hispanic / Latino 11% Two or more races 10% Black 5% Asian 5%
- Hispanic origin (detail)
- Mexican 2% Puerto Rican 3% Cuban 2% Dominican 1%
- Common ancestry
- Lithuanian 3% Romanian 3% Slovak 2%
- Foreign-born
- 14% · Canada, Vietnam, Jamaica
- Languages at home
- 84% English-only · Spanish 9% Other Indo-European 2% Vietnamese 2%
Political lean MEDSL · Pinellas
- 2024 margin
- Lean R (+5.2) · D 46.9% · R 52.1%
- 2008→2024 swing
- -13.5pp toward R · 2008: 8.3pp · 2024: -5.2pp
- All cycles
- 2024: R+5.2 2020: D+0.2 2016: R+1.1 2012: D+5.6 2008: D+8.3
Not yet ingested
- Civics
- —
Market trends
- HPI YoY
- ▼ -416.74%
- Current HPI
- 391.368
- Rent YoY
- ▲ 0.99%
- Metro
- Tampa-St. Petersburg-Clearwater, FL
- State GDP YoY
- ▲ 3.28%
- F500 in state
- 36
Industry mix (Fortune 500 HQ in FL)
| Industry | F500 HQs | Revenue |
|---|---|---|
| Industrial Technology | 2 | $29B |
|
||
| Insurance | 2 | $17B |
|
||
| Retail | 1 | $60B |
|
||
| Technology Distribution | 1 | $58B |
|
||
| Homebuilding | 1 | $35B |
|
||
| Technology Manufacturing | 1 | $35B |
|
||
Price history
+182.4% since first listed30 events — show timeline
- 2026-06-09 Listed $129,900 Stellar MLS as Distributed by MLS Grid
- 2025-02-10 Listing Removed — Stellar MLS as Distributed by MLS Grid
- 2024-11-13 Price Changed $370,000 Stellar MLS as Distributed by MLS Grid
- 2024-10-06 Price Changed $372,000 Stellar MLS as Distributed by MLS Grid
- 2024-09-06 Price Changed $375,000 Stellar MLS as Distributed by MLS Grid
- 2024-08-22 Listed $378,000 Stellar MLS as Distributed by MLS Grid
- 2022-04-13 Sold (MLS) $292,570 Stellar MLS as Distributed by MLS Grid
- 2022-04-12 Sold (Public Records) $292,600 Public Records
- 2022-03-16 Price Changed $2,050 RENT.
- 2022-02-13 Pending — Stellar MLS as Distributed by MLS Grid
- 2022-01-28 Listed $289,000 Stellar MLS as Distributed by MLS Grid
- 2021-11-11 Listing Removed — Stellar MLS as Distributed by MLS Grid
- 2021-08-03 Price Changed $289,000 Stellar MLS as Distributed by MLS Grid
- 2021-07-27 Listed $299,000 Stellar MLS as Distributed by MLS Grid
- 2019-03-11 Listing Removed — Stellar MLS as Distributed by MLS Grid
- 2019-02-23 Price Changed $150,000 Stellar MLS as Distributed by MLS Grid
- 2019-01-20 Listed $160,000 Stellar MLS as Distributed by MLS Grid
- 2017-06-13 Sold (Public Records) $131,000 Public Records
- 2017-06-08 Sold (MLS) $131,000 Stellar MLS as Distributed by MLS Grid
- 2017-05-02 Pending — Stellar MLS as Distributed by MLS Grid
- 2017-04-20 Relisted — Stellar MLS as Distributed by MLS Grid
- 2017-04-09 Pending — Stellar MLS as Distributed by MLS Grid
- 2017-04-06 Listed $125,000 Stellar MLS as Distributed by MLS Grid
- 2013-09-27 Sold (Public Records) $90,000 Public Records
- 2013-09-24 Sold (MLS) $90,000 Stellar MLS as Distributed by MLS Grid
- 2013-07-10 Listed $99,900 Stellar MLS as Distributed by MLS Grid
- 2013-06-13 Listing Removed — Stellar MLS as Distributed by MLS Grid
- 2013-03-29 Listed $107,000 Stellar MLS as Distributed by MLS Grid
- 1998-08-11 Sold (Public Records) $80,000 Public Records
- 1993-07-01 Sold (Public Records) $46,000 Public Records
Property tax history
+12.7%/yrLatest (2025): $4,622 · +4.4% YoY. Source: county tax records.
Cash-flow waterfall
monthlySold comps — $/sqft
last 12 mo · ≤1 miLoading sold comps…