1940 19th Ct · Jupiter, FL
Flood risk 1/10 · Minimal
- FEMA flood zone
- X (unshaded)
- Chance of flooding over 30 yrs
- 0.0%
- Est. flood insurance / yr
- $507 – $1,088
Fire risk 2/10 · Minimal
- Est. fire insurance / yr
- $947 – $1,759
Heat risk 9/10 · Severe
- Hot days now (above 106°F)
- 6 days/yr
- Hot days in 30 yrs
- 19 days/yr
Wind risk 10/10 · Severe
- Chance of severe wind over 30 yrs
- 99.0%
Air-quality risk 2/10 · Minimal
- Unhealthy air days now
- 1 days/yr
- Unhealthy air days in 30 yrs
- 2 days/yr
Risk factors via First Street. Map © Google.
Why this score? — see what drove the C grade
The composite is a weighted blend of 9 inputs, each scored 0–100. Each bar is that input's sub-score; the figure is the points it added to the 100-point composite (weight × sub-score).
- ARV discount +14.4/15.0
- Cash flow +14.1/30.0
- Appreciation +6.5/10.0
- Rent growth +5.0/5.0
- 1% rule +4.4/10.0
- DSCR +4.3/10.0
- Schools +4.3/10.0
- Livability +3.5/5.0
- Condition / age +2.5/5.0
$410,000
🖨 Deal sheet 📄 Offer letter ✓ Due diligence
Listing remarks
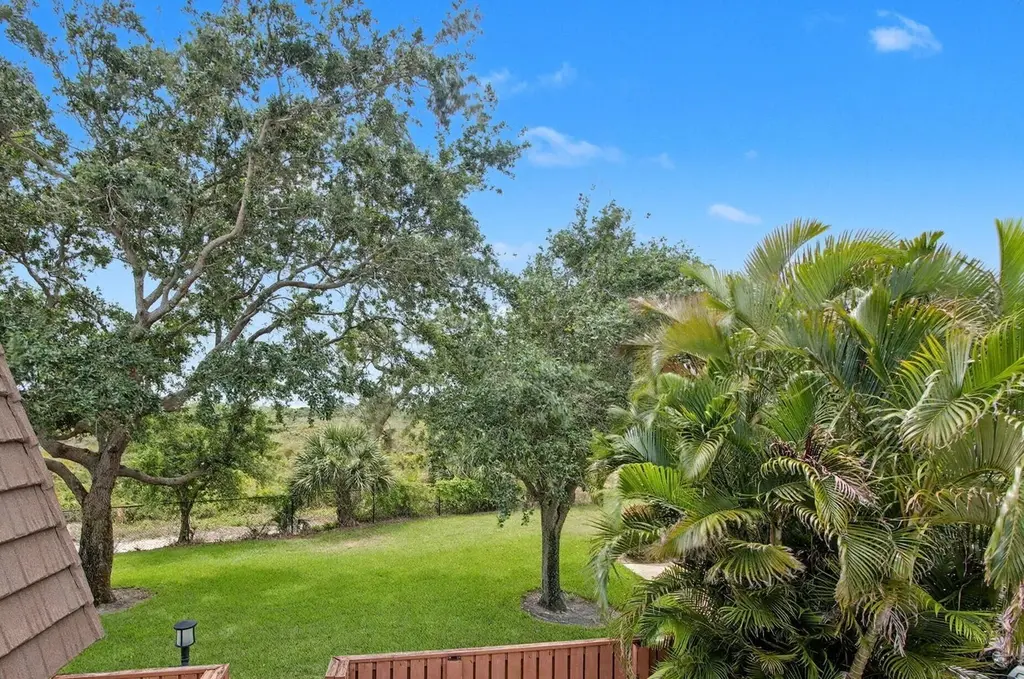
DESIRABLE BLUFFS LAKES TOWNHOME LOCATED ON THE PRESERVE. SUNNY & BRIGHT, NEW AC, HUGE PATIO, AN EASY WALK OR BIKE RIDE TO THE BEAUTIFUL JUPITER BEACHES. DESIRABLE COMMUNITY WITH RESORT-STYLE POOL, TENNIS, PICKLEBALL & MORE. MINUTES TO RESTAURANTS, SHOPPING, JUNO PIER AND HARBORSIDE.
Key facts
- Tennis
- Huge patio
- Pickleball
Tags
Property features AI
Finance
- Financial info: Pets allowed with possible restrictions and limits
- HOA & community: Monthly HOA fee; HOA includes cable TV, insurance, internet, ground maintenance, common area upkeep, common real estate tax, reserve funds, roof repairs and recreation facilities
Exterior
- Parking: Two parking spaces; No carport
- Utilities: Public water; Public sewer; Cable connected; Electricity connected; Water connected; Sewer connected
- Home design: Townhouse; Resale property; Faces northeast; One story
- Construction: CBS construction; Composition, rolled/hot mop and shingle roofing
- Exterior features: Not waterfront; Community amenities include car wash area, playground, parking, tennis courts, community room, heated pool, pickleball courts, and sidewalks
Interior
- Kitchen: Dishwasher; Electric range; Microwave; Refrigerator
- Bedrooms: No main-level bedrooms
- Flooring: Carpet; Tile
- Bathrooms: 2 full bathrooms and 1 half bathroom; One bathroom on the main level
- Heating & cooling: Central heating; Central air conditioning
- Interior features: Tankless water heater; Carpet and tile flooring
- Laundry & utility: Laundry room on the main level
Neighborhood map
What this means for you Summary
Snapshot
- This is a 2-bed/2.5-bath townhouse listed at $410k.
Deal economics
- At list price, monthly cash flow is $59 ($705/yr) — positive.
- The deal already cash-flows at list — no discount required.
- To meet the 1% rule (rent ≥ 1% of price), the offer needs to be $384k (6.3% below list).
- Recommended offer: $384k (6.3% below list) — sets the bar for 1% rule.
Location & tenants
- Location reads 70/100 on livability (#415 in FL) — a middle-class / working-renter tenant base. Strengths: crime A+, employment A+, housing A+; Watch: amenities F, commute F, cost of living F.
- Palm Beach (suburban): math 46% / reading 53% proficiency, ranked #34 of 73 in FL (top 47%) — families likely to look elsewhere, expect single-tenant / working-renter base with shorter leases.
- Zoned schools: Beacon Cove Intermediate School (math 84% / reading 86%, grade A+, #35 of 2,144 statewide, top 2%, 641 students, 19% FRL); Independence Middle School (math 71% / reading 67%, grade A, #68 of 571 statewide, top 12%, 1,166 students, 25% FRL); William T. Dwyer High School (math 36% / reading 58%, grade D-, #207 of 667 statewide, top 32%, 2,206 students, 37% FRL) — zoned schools average 27% FRL vs 52% district-wide (25 pts lower); this property's tenant base skews higher-income than the district average.
- Zoned-school proficiency averages 67% at this address vs 50% district-wide (+18 pts) — the actual schools serving this property are materially stronger than the Palm Beach average implies; a family-tenant draw the district grade alone would hide.
- Market conditions: Rents rising fast (+10.3%/yr); 337 active listings in the ZIP; 40 comparable units currently listed for rent nearby; rentals at typical pace (median 25d on market — plan ~3-4 weeks tenant-placement turnaround); solid renter incomes; 3,974 units permitted in Palm Beach County in 2024 (1,012 in 5+ unit buildings).
Forward outlook
- In year one you build about $15k of equity ($3k loan paydown + $12k appreciation (2.9% local appreciation)).
- Palm Beach County population projected at +30% by 2050 — long-run rental-demand tailwind backs the buy-and-hold thesis.
- At projected returns (2.9% appreciation + 8.0% rent growth), your $115k cash investment doubles in ~6 years — after that, you're playing with house money.
- By year 3, paydown + projected appreciation supports a ~$37k cash-out refi (75% LTV) — recoverable capital for the next deal without selling this one.
Negotiation context
- It's been on market 42 days — a 3% lower offer ($398k) is reasonable based on typical stale-listing flexibility.
- 2 sale attempts with the ask held roughly flat each time — persistent listings suggest the price (not the market) is what's stuck; bring a comps-based counter.
- Current owner paid $170k; list at $410k implies a 141% gain — meaningful room to come down on a strong offer.
Risks & watch-outs
- Climate carrying-cost: severe wind risk, 99% chance of damaging wind over 30y; extreme-heat days projected 6→19/yr by 2055 (HVAC capex compounding) — expect insurance premiums to compound above CPI over the hold.
Questions for the listing agent
- It's been on market 42 days. Have you received any prior offers? Is the seller open to a 6% concession, seller financing, or rate buy-down credit?
- What does the HOA fee cover, when was the last increase, and are there any pending special assessments or reserve-fund shortfalls?
- Is there a deadline driving the sale (1031 exchange, divorce, estate, relocation)? That informs how much negotiation room exists.
- Schools are A-rated — typically a magnet for longer-tenancy family renters. What's the average tenant stay here, and is there a school-zone premium baked into asking?
- What's the average days-on-market for RENTAL listings here right now (not sales)? A rising rental-DOM trend means longer vacancies and softer asking-rent achievability than the comps imply.
- What's the recent tenant-quality profile in this submarket — average credit score on applications, eviction rate, late-payment / NSF rate, and stable-employment percentage? A property-management company in the area should have these aggregated.
- How much new for-sale + rental construction is in the pipeline within 1–3 miles? Heavy new supply typically softens prices + rents 12–24 months out; constrained supply supports both.
Investment metrics
- 1% rule
- 0.94% ✗
- Cap rate
- 6.46%
- Cash-on-cash
- 0.61%
- DSCR
- 1.03
- GRM
- 8.9
CMA / ARV
- ARV (on-the-fly)
- $484,704
- Comps found
- 2
Show comp detail 2 sales within ~0.75 mi
| Address | Dist | Beds/Ba | Sqft | Sold | Price | $/sf | Match |
|---|---|---|---|---|---|---|---|
| 1802 18th Ct | 0.11mi | 2/2.5 | 1,188 (0%) | 4mo | $365,000 | $307 | 91 |
| 1142 11th Ct | 0.33mi | 2/2.5 | 1,188 (0%) | 16mo | $485,000 | $408 | 71 |
Match score weights: distance 35% · size 25% · config 20% · recency 20%. Top-matched comps best support the ARV.
Projected returns pro-forma
2.93% appreciation · 8.0% rent growth · sell at horizon
- IRR
- 10.7%
- Equity multiple
- 1.63×
- Total profit
- $72,015
- Equity at exit
- $182,702
- IRR
- 15.6%
- Equity multiple
- 3.54×
- Total profit
- $291,111
- Equity at exit
- $280,287
Cash invested: $114,800 (down + closing). Projections, not guarantees.
Landlord ↔ Tenant lean methodology
- Overall (STATE)
- 87 Strongly Landlord-Friendly
- State Florida
- 87 Strongly Landlord-Friendly · R+3
- County
- — inherits STATE
- City
- — inherits STATE
ZIP-level market 33477
- Home prices YoY
- 0.8%
- Rents YoY
- 10.3%
- Active inventory
- 337
- Price-to-rent
- 8.9×
Monthly cashflow live
- Estimated rent
- $3,840 high interval (Pro) →
- Mortgage (P&I)
- −$2,150
- Tax from tax record
- −$182 /mo · $2,182/yr
- Insurance
- −$171
- HOA
- −$472
- Vacancy / Maint / Mgmt
- −$806
- Net cashflow
- $59
Break-even live
UW: 25.0% down · 7.5% · 30yr · 1.5% tax · 5.0% vac · 8.0% maint · 8.0% mgmt
Financing live
Cash to close
- Down payment
- $102,500
- Closing costs
- $12,300
- Reserves months
- —
- Total cash needed
- —
Loan-product check · same deal, 3 products live
Conventional
25% down · 7.5% · 30yr
- Down + closing
- —
- Monthly P&I
- —
- Monthly cashflow
- —
- DSCR
- —
- Eligible?
- —
Personal DTI + credit; lowest rate.
DSCR
20% down · 8.5% · 30yr
- Down + closing
- —
- Monthly P&I
- —
- Monthly cashflow
- —
- DSCR
- —
- Eligible?
- —
No personal income docs; deal must DSCR.
Hard money
10% down · 12.0% · 12mo
- Down + closing
- —
- Monthly P&I
- —
- Monthly cashflow
- —
- DSCR
- —
- Eligible?
- —
Short-term bridge; refi at stabilization.
Rent comps 40 comps
| Address | Beds | Baths | Sqft | Rent | $/sqft | DOM | Units | Dist |
|---|---|---|---|---|---|---|---|---|
| 2117 21st Ct Jupiter, FL | 2.0 | 2.5 | 1188 | $4,200 | $3.54 | 24d | 1 | 0.08mi |
| 1909 19th Ct Unit 33a Jupiter, FL | 2.0 | 2.5 | 1188 | $3,000 | $2.53 | 24d | 1 | 0.11mi |
| 2316 23rd Ct Jupiter, FL | 2.0 | 2.5 | 1188 | $3,500 | $2.95 | 18d | 1 | 0.13mi |
| 901 Seafarer Cir #302 Jupiter, FL | 2.0 | 2.0 | 1385 | $4,500 | $3.25 | 18d | 1 | 0.18mi |
| 901 Seafarer Cir Jupiter, FL | 2.0 | 2.0 | 1385 | $4,250 | $3.07 | 24d | 2 | 0.18mi |
| 1201 Seafarer Cir #201 Jupiter, FL | 2.0 | 2.0 | 1385 | $2,800 | $2.02 | 19d | 1 | 0.20mi |
| 1106 Ocean Dunes Cir Jupiter, FL | 2.0 | 2.5 | 1431 | $3,900 | $2.73 | 24d | 1 | 0.22mi |
| 1510 15th Ct Jupiter, FL | 2.0 | 2.5 | 1188 | $6,500 | $5.47 | 24d | 1 | 0.22mi |
| 1424 14th Ct Jupiter, FL | 2.0 | 2.5 | 1188 | $2,500 | $2.10 | 24d | 1 | 0.23mi |
| 701 Seafarer Cir #504 Jupiter, FL | 2.0 | 2.0 | 1385 | $3,500 | $2.53 | 24d | 1 | 0.24mi |
| 1120 Ocean Dunes Cir Jupiter, FL | 2.0 | 2.5 | 1431 | $5,500 | $3.84 | 8d | 1 | 0.26mi |
| 1120 Ocean Dunes Cir Jupiter, FL | 2.0 | 2.5 | 1431 | $5,500 | $3.84 | 19d | 1 | 0.26mi |
| 1121 Ocean Dunes Cir Jupiter, FL | 2.0 | 2.5 | 1431 | $8,000 | $5.59 | 24d | 1 | 0.26mi |
| 601 Seafarer Cir #304 Jupiter, FL | 2.0 | 2.0 | 1385 | $2,750 | $1.99 | 24d | 1 | 0.28mi |
| 601 Seafarer Cir #104 Jupiter, FL | 2.0 | 2.0 | 1385 | $2,700 | $1.95 | 4d | 1 | 0.28mi |
| 1231 12th Ct Jupiter, FL | 2.0 | 2.5 | 1188 | $2,700 | $2.27 | 5d | 1 | 0.28mi |
| 2301 Marina Isle Way #503 Jupiter, FL | 2.0 | 2.0 | 1385 | $2,500 | $1.81 | 22d | 1 | 0.29mi |
| 1001 Seafarer Cir #204 Jupiter, FL | 2.0 | 2.0 | 1385 | $2,200 | $1.59 | 19d | 1 | 0.29mi |
| 809 Ocean Dunes Cir Jupiter, FL | 2.0 | 2.5 | 1431 | $3,300 | $2.31 | 24d | 1 | 0.29mi |
| 2201 Marina Isle Way #403 Jupiter, FL | 2.0 | 2.0 | 1385 | $2,600 | $1.88 | 24d | 1 | 0.33mi |
| 2201 Marina Isle Way #403 Jupiter, FL | 2.0 | 2.0 | 1385 | $2,300 | $1.66 | 19d | 1 | 0.33mi |
| 1221 Ocean Dunes Cir Jupiter, FL | 3.0 | 2.5 | 1431 | $4,000 | $2.80 | 22d | 1 | 0.33mi |
| 621 Ocean Dunes Cir Jupiter, FL | 3.0 | 2.0 | 1254 | $7,500 | $5.98 | 20d | 1 | 0.33mi |
| 1401 Tidal Pointe Blvd Jupiter, FL | 2.0 | 2.0 | 1385 | $4,400 | $3.18 | 18d | 3 | 0.35mi |
| 1007 10th Ct Jupiter, FL | 2.0 | 2.5 | 1188 | $2,800 | $2.36 | 19d | 1 | 0.36mi |
| 1209 12th Ct Jupiter, FL | 2.0 | 2.5 | 1188 | $7,000 | $5.89 | 24d | 1 | 0.36mi |
| 716 Ocean Dunes Cir Jupiter, FL | 2.0 | 2.0 | 1279 | $3,350 | $2.62 | 24d | 1 | 0.37mi |
| 2601 Marina Isle Way #402 Jupiter, FL | 2.0 | 2.0 | 1385 | $6,000 | $4.33 | 18d | 1 | 0.37mi |
| 1138 11th Ct Jupiter, FL | 2.0 | 2.5 | 1188 | $3,500 | $2.95 | 24d | 1 | 0.38mi |
| 1501 Marina Isle Way #305 Jupiter, FL | 2.0 | 2.0 | 1385 | $2,700 | $1.95 | 19d | 1 | 0.39mi |
| 2565 Old Donald Ross Rd Palm Beach Gardens, FL | 2.0 | 1.0 | 1100 | $2,800 | $2.55 | 24d | 1 | 0.63mi |
| 2619 Old Donald Ross Rd Palm Beach Gardens, FL | 2.0 | 1.0 | 1000 | $3,600 | $3.60 | 24d | 1 | 0.66mi |
| 401 S Seas Dr #203 Jupiter, FL | 2.0 | 2.0 | 1332 | $6,400 | $4.80 | 24d | 1 | 0.66mi |
| 104 Sea Oats Dr Unit G Juno Beach, FL | 2.0 | 2.0 | 1451 | $6,000 | $4.14 | 22d | 1 | 0.67mi |
| 204 Sea Oats Dr Unit F Juno Beach, FL | 2.0 | 2.0 | 1451 | $6,500 | $4.48 | 24d | 1 | 0.67mi |
| 101 Sea Oats Dr Unit F Juno Beach, FL | 2.0 | 2.0 | 1454 | $2,650 | $1.82 | 24d | 1 | 0.70mi |
| 201 S Seas Dr Jupiter, FL | 2.0 | 2.0 | 1385 | $4,750 | $3.43 | 21d | 2 | 0.70mi |
| 201 S Seas Dr #404 Jupiter, FL | 2.0 | 2.0 | 1385 | $6,000 | $4.33 | 24d | 1 | 0.71mi |
| 1701 Mizzenmast Way Jupiter, FL | 2.0 | 2.0 | 1263 | $8,500 | $6.73 | 24d | 1 | 0.74mi |
| 301 S Seas Dr Jupiter, FL | 2.0 | 2.0 | 1332 | $6,350 | $4.77 | 8d | 1 | 0.77mi |
HOA detail
- Monthly dues
- $472 · $5,664/yr
- Likely covers
- pool
Listing history 9 events
-
2026-05-09status Pending
-
2026-04-30historical Active Under Contract
-
2026-04-20price $410,000
-
2026-04-06status Active
-
2026-03-31historical Active Under Contract
-
2026-03-27$415,000 Active
-
2003-11-06soldstatus $170,000
-
1993-11-04soldstatus $85,000
-
1988-10-26soldstatus $85,000
ⓘ Source: listings_history table (triggers on properties + properties_extension) + one-shot
backfill from property_details.listing_events for pre-trigger history.
Tax reassessment forecast FL · Resets to sale price
- Current annual tax
- $2,182 · $182/mo
- Projected year-2 tax
- $3,403 · $284/mo
- Expected delta
- +$1,221/yr (+$102/mo · 56.0%)
ⓘ Screening estimate from a state-policy table — verify with the county assessor before closing.
Climate risk First Street
- Flood 1/10 Low FEMA zone X (unshaded) · 0% chance over 30 yrs
- Wildfire 2/10 Low
- Heat 9/10 Extreme 6 d/yr ≥106°F today · 19 d/yr by 30 yrs out
- Wind 10/10 Extreme 99% chance of damaging wind over 30 yrs
- Air quality 2/10 Low 1 unhealthy d/yr today · 2 by 30 yrs out
Nearby sold comps map
Loading sold comps map…
Walkable amenities ~0.75 mi
Loading nearby amenities…
Taxation est. · year 1
- Rental income
- $46,078
- − Mortgage interest
- −$22,966
- − Property taxes
- −$2,182
- − Insurance
- −$2,050
- − Repairs & maintenance
- −$3,686
- − Management
- −$3,686
- − HOA
- −$5,664
- − Depreciation
- −$11,927
- Taxable loss
- −$6,084
- Est. tax savings @ 24.0%
- +$1,460
- After-tax cash flow
- $2,165/yr
For passive investors: Depreciation is non-cash, so a rental often shows a tax loss while cash-flowing — sheltering income. Rental losses are passive: they offset passive income freely, and up to $25,000/yr can offset ordinary (W-2) income if you actively participate and your MAGI is under $100k (phasing out to $0 by $150k); unused losses carry forward. On sale, claimed depreciation is recaptured at up to 25%, and gains may owe capital-gains tax (a 1031 exchange can defer both). Figures are a year-1 estimate at your 24.0% rate — not tax advice; consult a CPA.
Schools (NCES district)
- District
- Palm Beach
- NCES district ID
- 1201500
- Math proficiency
- 46% ▼ -16.00%
- Reading proficiency
- 53% ▼ -4.00%
- Median HH income
- $53,943
- Composite
- 42.72/100
- National rank
- #3160
- State rank
- #34 of 73 in FL
Livability — Jupiter
- Score
- 70/100
- State rank
- #415
- US rank
- #7386
Category grades
Schools grade is shown separately in the Schools card above.
Census & demographics
- Census place
- Jupiter, FL
- County
- Palm Beach County · 1,438,312 people
- City population
- 68,420
- Metro
- Miami-Fort Lauderdale-Pompano Beach, FL
- Population (ZIP)
- 12,908
- Household income
- $104,992
- Rent vs Own
- Severe rent burden
- 445.0
Population outlook (Palm Beach County) Hauer SSP2
- Today (2025)
- 1,637,487 people
- By 2030
- 1,743,255 · +6.5%
- By 2040
- 1,948,712 · +19.0%
- By 2050
- 2,132,979 · +30.3%
- By 2075
- 2,530,027 · +54.5%
- By 2100
- 2,706,979 · +65.3%
Race, ethnicity, and origin ACS 2023
- Neighborhood character
- Predominantly White (93%)
- Race & ethnicity
- White 93% Hispanic / Latino 5% Two or more races 4%
- Hispanic origin (detail)
- Common ancestry
- Romanian 6% Scotch-Irish 4% Lithuanian 2%
- Foreign-born
- 10% · Canada, Guatemala, Jamaica
- Languages at home
- 90% English-only · Spanish 5% Other Indo-European 2% German/W. Germanic 1%
Political lean MEDSL · Palm Beach
- 2024 margin
- Toss-up / Even · D 50.0% · R 49.2%
- 2008→2024 swing
- -22.1pp toward R · 2008: 22.9pp · 2024: 0.8pp
- All cycles
- 2024: D+0.8 2020: D+12.8 2016: D+15.3 2012: D+17.0 2008: D+22.9
Not yet ingested
- Civics
- —
Market trends
- HPI YoY
- ▲ 2.93%
- Current HPI
- 356.212
- Rent YoY
- ▲ 10.27%
- Metro
- Miami-Fort Lauderdale-Pompano Beach, FL
- State GDP YoY
- ▲ 3.28%
- F500 in state
- 36
Industry mix (Fortune 500 HQ in FL)
| Industry | F500 HQs | Revenue |
|---|---|---|
| Industrial Technology | 2 | $29B |
|
||
| Insurance | 2 | $17B |
|
||
| Retail | 1 | $60B |
|
||
| Technology Distribution | 1 | $58B |
|
||
| Homebuilding | 1 | $35B |
|
||
| Technology Manufacturing | 1 | $35B |
|
||
Price history
+382.4% since first listed9 events — show timeline
- 2026-05-09 Pending — Beaches MLS
- 2026-04-30 Contingent — Beaches MLS
- 2026-04-20 Price Changed $410,000 Beaches MLS
- 2026-04-06 Relisted — Beaches MLS
- 2026-03-31 Contingent — Beaches MLS
- 2026-03-27 Listed $415,000 Beaches MLS
- 2003-11-06 Sold (Public Records) $170,000 Public Records
- 1993-11-04 Sold (Public Records) $85,000 Public Records
- 1988-10-26 Sold (Public Records) $85,000 Public Records
Property tax history
+1.0%/yrLatest (2025): $2,182 · +3.7% YoY. Source: county tax records.
Cash-flow waterfall
monthlySold comps — $/sqft
last 12 mo · ≤1 miLoading sold comps…