2445 Columbus-lancaster Rd NW Lot 433 · Lancaster, OH
Flood risk No data
- FEMA flood zone
- —
- Chance of flooding over 30 yrs
- —
- Est. flood insurance / yr
- —
Fire risk No data
- Est. fire insurance / yr
- —
Heat risk No data
- Hot days now (above threshold)
- —
- Hot days in 30 yrs
- —
Wind risk No data
- Chance of severe wind over 30 yrs
- —
Air-quality risk No data
- Unhealthy air days now
- —
- Unhealthy air days in 30 yrs
- —
Risk factors via First Street. Map © Google.
Why this score? — see what drove the B grade
The composite is a weighted blend of 9 inputs, each scored 0–100. Each bar is that input's sub-score; the figure is the points it added to the 100-point composite (weight × sub-score).
- Cash flow +30.0/30.0
- 1% rule +10.0/10.0
- DSCR +10.0/10.0
- ARV discount +6.7/15.0
- Livability +4.3/5.0
- Condition / age +4.0/5.0
- Rent growth +3.8/5.0
- Schools +3.7/10.0
- Appreciation +0.0/10.0
$69,900
🖨 Deal sheet 📄 Offer letter ✓ Due diligence
Listing remarks MLS
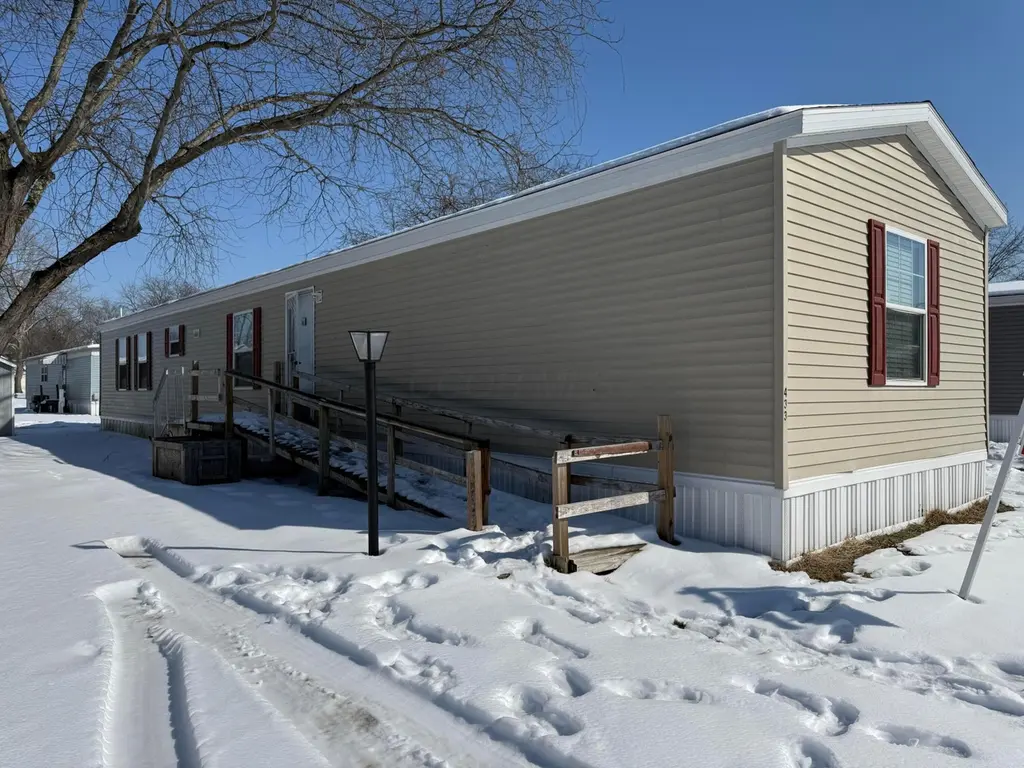
Welcome to Colonial Estates, a mobile home community conveniently located in Lancaster, Ohio. Just minutes from US-33 and all the shopping, dining, and amenities along Memorial Drive, this 2022 Adventure single-wide home offers comfortable and modern living with 3 bedrooms and 2 bathrooms. Residents of Colonial Estates enjoy great community features including a playground, swimming pool, basketball court, clubhouse, and more.
Key facts
- Built 2021
- Listed 71 days
Neighborhood map
What this means for you Summary
Snapshot
- This is a 3-bed/2.0-bath single-family listed at $70k. Condition is rated good.
Deal economics
- At list price, monthly cash flow is $766 ($9k/yr) — positive.
- The deal already cash-flows at list — no discount required.
- Meets the 1% rule at list price ($2k rent vs $70k).
- Recommended offer: $66k (6.0% below list) — sets the bar for market timing.
- Cap rate 19.4% vs local median 4.0% in Lancaster — top-decile yield for the area; either an underpriced asset or a hidden risk that comps aren't pricing in. Stress-test before assuming the spread holds.
Location & tenants
- Location reads 86/100 on livability (#41 in OH, #423 nationally) — a professional / high-income tenant draw. Strengths: amenities A+, cost of living A+, housing A+; Watch: crime D, employment D.
- Lancaster City (town): math 38% / reading 51% proficiency, ranked #504 of 656 in OH (top 77%) — families likely to look elsewhere, expect single-tenant / working-renter base with shorter leases.
- Market conditions: Rents rising fast (+5.2%/yr); 204 active listings in the ZIP; 475 units permitted in Fairfield County in 2024 (0 in 5+ unit buildings).
Forward outlook
- Local home prices are declining (-3.0%/yr); year-one equity from $483 of loan paydown is wiped out by about $2k of value loss. Plan a longer hold.
- Fairfield County population projected at +8% by 2050 — modest demand growth; plan on rents tracking national, not racing it.
- At projected returns (-3.0% appreciation + 5.2% rent growth), your $20k cash investment doubles in ~3 years — after that, you're playing with house money.
Negotiation context
- It's been on market 71 days — a 6% lower offer ($66k) is reasonable based on typical stale-listing flexibility.
Questions for the listing agent
- It's been on market 71 days. Have you received any prior offers? Is the seller open to a 6% concession, seller financing, or rate buy-down credit?
- Why hasn't it sold? Are there any deal-killer items the seller is aware of (foundation, flood, title, zoning, code violations)?
- Is there a deadline driving the sale (1031 exchange, divorce, estate, relocation)? That informs how much negotiation room exists.
- Crime grade is D in this area — have there been break-ins, vandalism, or insurance claims at this property in the last 3 years? What carrier currently insures it and at what premium?
- What's the average days-on-market for RENTAL listings here right now (not sales)? A rising rental-DOM trend means longer vacancies and softer asking-rent achievability than the comps imply.
- What's the recent tenant-quality profile in this submarket — average credit score on applications, eviction rate, late-payment / NSF rate, and stable-employment percentage? A property-management company in the area should have these aggregated.
- How much new for-sale + rental construction is in the pipeline within 1–3 miles? Heavy new supply typically softens prices + rents 12–24 months out; constrained supply supports both.
Investment metrics
- 1% rule
- 2.26% ✓
- Cap rate
- 19.44%
- Cash-on-cash
- 46.96%
- DSCR
- 3.09
- GRM
- 3.7
CMA / ARV
- ARV (median comp)
- $68,609
- List price
- $69,900
- Delta
- 1.88%
- Verdict
- FAIR
- Comps
- 20 within 1.0 mi
Show comp detail 12 sales within ~0.75 mi
| Address | Dist | Beds/Ba | Sqft | Sold | Price | $/sf | Match |
|---|---|---|---|---|---|---|---|
| 2445 Columbus Lancaster Rd NW Lot 463 | 0.12mi | 3/2.0 | 1,120 (-5%) | 7mo | $30,000 | $27 | 80 |
| 2445 Columbus Lancaster Rd NW Lot 375 | 0.12mi | 3/2.0 | 1,116 (-5%) | 9mo | $68,450 | $61 | 79 |
| 2445 Columbus Lancaster Rd NW #147 | 0.14mi | 2/2.0 (-1) | 1,120 (-5%) | 10mo | $49,900 | $45 | 72 |
| 2445 NW Columbus Lancaster Rd NW Lot 367 | 0.14mi | 3/2.0 | 1,280 (+9%) | 15mo | $49,999 | $39 | 67 |
| 2445 Columbus Lancaster Rd Lot 446 NW | 0.14mi | 3/2.0 | 1,280 (+9%) | 16mo | $64,750 | $51 | 66 |
| 2445 Columbus Lancaster Rd NW Lot 382 | 0.14mi | 3/2.0 | 1,300 (+10%) | 17mo | $68,000 | $52 | 62 |
| 1422 Autumn Dr | 0.53mi | 3/1.5 | 1,242 (+5%) | 10mo | $300,000 | $242 | 56 |
| 1533 Scenic Valley Pl | 0.56mi | 3/2.5 | 1,260 (+7%) | 6mo | $280,000 | $222 | 56 |
| 2445 Columbus Lancaster Rd Rd NW Lot 138 | 0.14mi | 2/2.0 (-1) | 1,067 (-9%) | 21mo | $89,000 | $83 | 55 |
| 1449 Autumn Dr | 0.59mi | 3/2.0 | 1,250 (+6%) | 21mo | $296,000 | $237 | 45 |
| 2634 Fernwood Ave | 0.67mi | 3/2.5 | 1,321 (+12%) | 2mo | $315,000 | $238 | 44 |
| 1556 Hocking Valley Pl | 0.55mi | 3/2.5 | 1,350 (+15%) | 21mo | $265,000 | $196 | 30 |
Match score weights: distance 35% · size 25% · config 20% · recency 20%. Top-matched comps best support the ARV.
Projected returns pro-forma
-3.0% appreciation · 5.22% rent growth · sell at horizon
- IRR
- 46.8%
- Equity multiple
- 3.10×
- Total profit
- $41,086
- Equity at exit
- $10,422
- IRR
- 53.5%
- Equity multiple
- 6.83×
- Total profit
- $114,185
- Equity at exit
- $6,044
Cash invested: $19,572 (down + closing). Projections, not guarantees.
Landlord ↔ Tenant lean methodology
- Overall (STATE)
- 73 Landlord-Friendly
- State Ohio
- 73 Landlord-Friendly · R+6
- County
- — inherits STATE
- City
- — inherits STATE
ZIP-level market 43130
- Rents YoY
- 5.2%
- Active inventory
- 204
- Price-to-rent
- 3.7×
Monthly cashflow live
- Estimated rent
- $1,581 medium interval (Pro) →
- Mortgage (P&I)
- −$367
- Tax est. 1.5%
- −$87 /mo · $1,048/yr
- Insurance
- −$29
- HOA
- −$0
- Vacancy / Maint / Mgmt
- −$332
- Net cashflow
- $766
Break-even live
UW: 25.0% down · 7.5% · 30yr · 1.5% tax · 5.0% vac · 8.0% maint · 8.0% mgmt
Financing live
Cash to close
- Down payment
- $17,475
- Closing costs
- $2,097
- Reserves months
- —
- Total cash needed
- —
Loan-product check · same deal, 3 products live
Conventional
25% down · 7.5% · 30yr
- Down + closing
- —
- Monthly P&I
- —
- Monthly cashflow
- —
- DSCR
- —
- Eligible?
- —
Personal DTI + credit; lowest rate.
DSCR
20% down · 8.5% · 30yr
- Down + closing
- —
- Monthly P&I
- —
- Monthly cashflow
- —
- DSCR
- —
- Eligible?
- —
No personal income docs; deal must DSCR.
Hard money
10% down · 12.0% · 12mo
- Down + closing
- —
- Monthly P&I
- —
- Monthly cashflow
- —
- DSCR
- —
- Eligible?
- —
Short-term bridge; refi at stabilization.
Listing history 13 events
-
2026-06-18days on market $69,900 Active 71 DOM
-
2026-06-17days on market $69,900 Active 70 DOM
-
2026-06-16days on market $69,900 Active 69 DOM
-
2026-06-15days on market $69,900 Active 68 DOM
-
2026-06-13days on market $69,900 Active 66 DOM
-
2026-06-09days on market $69,900 Active 62 DOM
-
2026-06-08days on market $69,900 Active 61 DOM
-
2026-06-07days on market $69,900 Active 60 DOM
-
2026-06-03days on market $69,900 Active 56 DOM
-
2026-06-02days on market $69,900 Active 55 DOM
-
2026-06-01days on market $69,900 Active 54 DOM
-
2026-05-31days on market $69,900 Active 53 DOM
-
2026-04-08$69,900 Active 429-char remark
Show marketing remark (429 chars)
Welcome to Colonial Estates, a mobile home community conveniently located in Lancaster, Ohio. Just minutes from US-33 and all the shopping, dining, and amenities along Memorial Drive, this 2022 Adventure single-wide home offers comfortable and modern living with 3 bedrooms and 2 bathrooms. Residents of Colonial Estates enjoy great community features including a playground, swimming pool, basketball court, clubhouse, and more.
ⓘ Source: listings_history table (triggers on properties + properties_extension) + one-shot
backfill from property_details.listing_events for pre-trigger history.
Nearby sold comps map
Loading sold comps map…
Walkable amenities ~0.75 mi
Loading nearby amenities…
Taxation est. · year 1
- Rental income
- $18,971
- − Mortgage interest
- −$3,915
- − Property taxes
- −$1,048
- − Insurance
- −$350
- − Repairs & maintenance
- −$1,518
- − Management
- −$1,518
- − Depreciation
- −$2,033
- Taxable income
- $8,589
- Est. tax owed @ 24.0%
- −$2,061
- After-tax cash flow
- $7,129/yr
For passive investors: Depreciation is non-cash, so a rental often shows a tax loss while cash-flowing — sheltering income. Rental losses are passive: they offset passive income freely, and up to $25,000/yr can offset ordinary (W-2) income if you actively participate and your MAGI is under $100k (phasing out to $0 by $150k); unused losses carry forward. On sale, claimed depreciation is recaptured at up to 25%, and gains may owe capital-gains tax (a 1031 exchange can defer both). Figures are a year-1 estimate at your 24.0% rate — not tax advice; consult a CPA.
Condition & rehab AI · 10 photos
This 2022 single-wide mobile home in Colonial Estates, Lancaster, Ohio, is in good condition with modern finishes and a well-maintained exterior. It offers a good investment opportunity with potential for minor updates to enhance its value.
Value-add opportunities
- Both Painting the interior walls — Fresh paint can enhance the home's curb appeal and interior aesthetics.
- Both Landscaping improvements — A well-maintained yard can increase both resale and rental value.
- Both Adding a small outdoor seating area — This can increase the home's appeal and functionality, especially for rental properties.
Renovation cost estimate screening
Value-add ROI direction
- Both Painting the interior walls — Fresh paint can enhance the home's curb appeal and interior aesthetics. ↑
- Both Landscaping improvements — A well-maintained yard can increase both resale and rental value. ↑
- Both Adding a small outdoor seating area — This can increase the home's appeal and functionality, especially for rental properties. ↑
ⓘ Cost ranges are severity-bucket heuristics (US national rule-of-thumb). Get contractor quotes + a written scope before underwriting a rehab budget.
Schools (NCES district)
- District
- Lancaster City
- NCES district ID
- 3904420
- Math proficiency
- 38% ▼ -21.00%
- Reading proficiency
- 51% ▼ -11.00%
- Median HH income
- $41,696
- Composite
- 37.39/100
- National rank
- #4427
- State rank
- #504 of 656 in OH
Livability — Lancaster
- Score
- 86/100
- State rank
- #41
- US rank
- #423
Category grades
Schools grade is shown separately in the Schools card above.
Census & demographics
- County
- Fairfield County · 109,896 people
- City population
- 62,933
- Metro
- Columbus, OH
- Population (ZIP)
- 62,933
- Household income
- $72,153
- Rent vs Own
- Severe rent burden
- 1400.0
Population outlook (Fairfield County) Hauer SSP2
- Today (2025)
- 162,442 people
- By 2030
- 166,796 · +2.7%
- By 2040
- 172,835 · +6.4%
- By 2050
- 174,822 · +7.6%
- By 2075
- 174,938 · +7.7%
- By 2100
- 160,988 · -0.9%
Race, ethnicity, and origin ACS 2023
- Neighborhood character
- Predominantly White (91%)
- Race & ethnicity
- White 91% Two or more races 4% Hispanic / Latino 2% Black 2%
- Common ancestry
- Slovak 2% Italian 1% Iranian 1%
- Foreign-born
- 1% · Canada
- Languages at home
- 98% English-only · Spanish 1%
Political lean MEDSL · Fairfield
- 2024 margin
- Strong R (+24.1) · D 37.5% · R 61.6%
- 2008→2024 swing
- -6.9pp toward R · 2008: -17.1pp · 2024: -24.1pp
- All cycles
- 2024: R+24.1 2020: R+23.5 2016: R+27.0 2012: R+16.1 2008: R+17.1
Not yet ingested
- Civics
- —
Market trends
- HPI YoY
- ▼ -298.81%
- Current HPI
- 239.6352
- Rent YoY
- ▲ 5.22%
- Metro
- Columbus, OH
- State GDP YoY
- ▲ 1.98%
- F500 in state
- 48
Industry mix (Fortune 500 HQ in OH)
| Industry | F500 HQs | Revenue |
|---|---|---|
| Insurance | 3 | $145B |
|
||
| Industrial Machinery | 3 | $49B |
|
||
| Financial Services | 3 | $24B |
|
||
| Consumer Goods | 2 | $93B |
|
||
| Aerospace / Defense | 2 | $47B |
|
||
| Utilities | 2 | $33B |
|
||
Price history
1 event — show timeline
- 2026-04-08 Listed $69,900 CBRMLS
Cash-flow waterfall
monthlySold comps — $/sqft
last 12 mo · ≤1 miLoading sold comps…