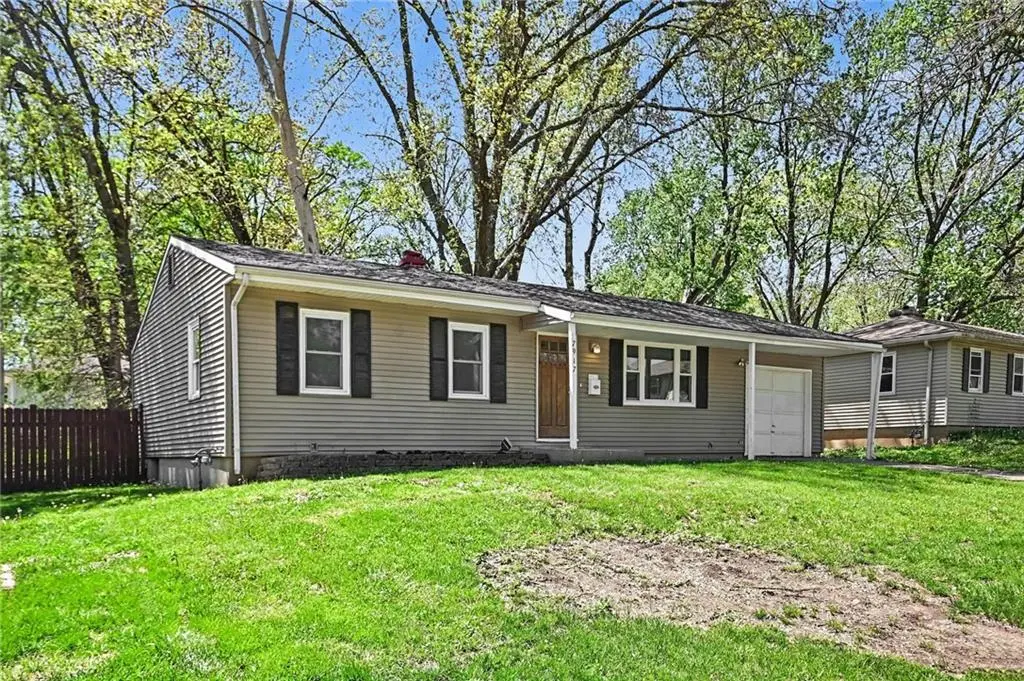
7917 56th St · Kansas City, MO
Flood risk 1/10 · Minimal
- FEMA flood zone
- X (unshaded)
- Chance of flooding over 30 yrs
- 0.0%
- Est. flood insurance / yr
- $473 – $860
Fire risk 1/10 · Minimal
- Est. fire insurance / yr
- $1,054 – $1,958
Heat risk 4/10 · Minor
- Hot days now (above 107°F)
- 7 days/yr
- Hot days in 30 yrs
- 17 days/yr
Wind risk 2/10 · Minimal
- Chance of severe wind over 30 yrs
- —
Air-quality risk 3/10 · Minor
- Unhealthy air days now
- 2 days/yr
- Unhealthy air days in 30 yrs
- 3 days/yr
Risk factors via First Street. Map © Google.
Why this score? — see what drove the D grade
The composite is a weighted blend of 9 inputs, each scored 0–100. Each bar is that input's sub-score; the figure is the points it added to the 100-point composite (weight × sub-score).
- Cash flow +13.8/30.0
- ARV discount +4.7/15.0
- DSCR +4.2/10.0
- Rent growth +4.0/5.0
- Livability +3.9/5.0
- Schools +3.8/10.0
- 1% rule +3.4/10.0
- Condition / age +2.5/5.0
- Appreciation +0.0/10.0
$214,500
🖨 Deal sheet (PDF) 📄 Offer letter ✓ Due diligence
Listing remarks MLS
Enjoy this beautiful home located in the desirable Gracemor neighborhood with easy access to I-35 and I-435! This home offers 3 bedrooms and 1.5 baths. Newly renovated kitchen and bathrooms. All stainless steal appliances stay! Enjoy the spacious, flat backyard with beautiful matured trees. Enjoy the convenient neighborhood park with your family! Welcome to your new home sweet home.
Key facts
- Unfinished basement
- Granite countertops
- 9,148 sq ft lot
Tags
Property features AI
Finance
- Financial info: Annual tax amount listed
Exterior
- Parking: Attached 1-car garage
- Utilities: Public water; Public sewer
- Home design: Single-family residence; Ranch floor plan; Residential property
- Construction: Vinyl siding; Composition roof
- Exterior features: Patio; Porch; Metal fencing; Level lot; Paved road access, publicly maintained
Interior
- Kitchen: Disposal; Microwave; Refrigerator
- Bedrooms: 3 bedrooms (all on the first floor)
- Bathrooms: 1 full bath; 1 half bath
- Heating & cooling: Natural gas heating; Electric cooling (central)
- Interior features: Family room; Eat-in kitchen; Unfinished basement
- Laundry & utility: Basement utility space
Neighborhood map
What this means for you Summary
Snapshot
- This is a 3-bed/1.0-bath single-family listed at $214k.
Deal economics
- At list price, monthly cash flow is $20 ($237/yr) — positive.
- The deal already cash-flows at list — no discount required.
- To meet the 1% rule (rent ≥ 1% of price), the offer needs to be $180k (16.0% below list).
- Recommended offer: $180k (16.0% below list) — sets the bar for 1% rule.
- Cap rate 6.4% vs local median 3.9% in Kansas City — top-decile yield for the area; either an underpriced asset or a hidden risk that comps aren't pricing in. Stress-test before assuming the spread holds.
Location & tenants
- Location reads 78/100 on livability (#28 in MO, #2,671 nationally) — a middle-class / working-renter tenant base. Strengths: amenities A+, commute A+, cost of living A+; Watch: crime F.
- North Kansas City 74 (urban): math 38% / reading 49% proficiency, ranked #98 of 324 in MO (top 30%) — families likely to look elsewhere, expect single-tenant / working-renter base with shorter leases.
- Zoned schools: Gracemor Elementary (math 23% / reading 35%, grade F, #842 of 1,115 statewide, top 76%, 630 students, 68% FRL); Maple Park Middle (math 19% / reading 33%, grade F, #316 of 391 statewide, top 81%, 638 students, 65% FRL); Winnetonka High (math 16% / reading 51%, grade F, #349 of 521 statewide, top 67%, 1,284 students, 60% FRL) — zoned schools average 64% FRL vs 37% district-wide (27 pts higher); higher-poverty schools than district average — tighter screening recommended.
- Zoned-school proficiency averages 30% at this address vs 44% district-wide (-14 pts) — the specific schools serving this property underperform the North Kansas City 74 average; the district grade overstates school quality for this exact location.
- Market conditions: Rents rising fast (+6.1%/yr); 184 active listings in the ZIP; 8 comparable units currently listed for rent nearby; rentals leasing fast (median 13d on market — plan ~1-2 weeks tenant-placement turnaround); solid renter incomes; 341 units permitted in Clay County in 2024 (40 in 5+ unit buildings).
Forward outlook
- Local home prices are declining (-3.0%/yr); year-one equity from $1k of loan paydown is wiped out by about $6k of value loss. Plan a longer hold.
- Clay County population projected at +24% by 2050 — long-run rental-demand tailwind backs the buy-and-hold thesis.
Negotiation context
- Only 12 days on market — expect competitive offers; lowballing is unlikely to land.
- 4 sale attempts since 9y ago with the ask held roughly flat each time — persistent listings suggest the price (not the market) is what's stuck; bring a comps-based counter.
Questions for the listing agent
- Built in 1962 — when were the roof, HVAC, electrical panel, plumbing, and water heater last replaced?
- Is there a deadline driving the sale (1031 exchange, divorce, estate, relocation)? That informs how much negotiation room exists.
- Crime grade is F in this area — have there been break-ins, vandalism, or insurance claims at this property in the last 3 years? What carrier currently insures it and at what premium?
- The area grade is low — what's the realistic commute time and amenity access for the typical tenant pool here? Any planned neighborhood developments (good or bad) we should know about?
- What's the average days-on-market for RENTAL listings here right now (not sales)? A rising rental-DOM trend means longer vacancies and softer asking-rent achievability than the comps imply.
- What's the recent tenant-quality profile in this submarket — average credit score on applications, eviction rate, late-payment / NSF rate, and stable-employment percentage? A property-management company in the area should have these aggregated.
- How much new for-sale + rental construction is in the pipeline within 1–3 miles? Heavy new supply typically softens prices + rents 12–24 months out; constrained supply supports both.
Investment metrics
- 1% rule
- 0.84% ✗
- Cap rate
- 6.40%
- Cash-on-cash
- 0.39%
- DSCR
- 1.02
- GRM
- 9.9
CMA / ARV
- ARV (on-the-fly)
- $201,728
- Comps found
- 12
Show comp detail 12 sales within ~0.75 mi
| Address | Dist | Beds/Ba | Sqft | Sold | Price | $/sf | Match |
|---|---|---|---|---|---|---|---|
| 7917 56th St | 0.00mi | 3/1.5 | 1,024 (0%) | 1mo | $214,500 | $209 | 97 |
| 479 NE Meadowbrook Rd | 0.50mi | 3/2.0 | 1,029 (+0%) | 12mo | $235,000 | $228 | 62 |
| 7334 NE 51st St | 0.69mi | 3/1.0 | 1,056 (+3%) | 4mo | $155,000 | $147 | 59 |
| 5239 N Bristol Ave | 0.66mi | 3/1.0 | 1,055 (+3%) | 8mo | $159,000 | $151 | 58 |
| 7719 56th St | 0.18mi | 3/1.0 | 871 (-15%) | 12mo | $215,000 | $247 | 57 |
| 7722 NE 55th St | 0.23mi | 2/2.0 (-1) | 912 (-11%) | 8mo | $180,000 | $197 | 56 |
| 6929 NE 53rd St | 0.72mi | 3/1.0 | 960 (-6%) | 4mo | $225,000 | $234 | 53 |
| 119 S Emerson St | 0.66mi | 2/1.0 (-1) | 1,058 (+3%) | 13mo | $205,000 | $194 | 48 |
| 5205 N Richmond Ave | 0.54mi | 4/2.0 (+1) | 1,155 (+13%) | 6mo | $209,000 | $181 | 39 |
| 8032 NE San Rafael Dr | 0.69mi | 3/1.0 | 874 (-15%) | 5mo | $210,000 | $240 | 39 |
| 8017 NE 50th St | 0.64mi | 3/1.0 | 874 (-15%) | 12mo | $165,000 | $189 | 36 |
| 6921 NE 53rd St | 0.75mi | 3/1.5 | 1,151 (+12%) | 13mo | $185,000 | $161 | 32 |
Match score weights: distance 35% · size 25% · config 20% · recency 20%. Top-matched comps best support the ARV.
Projected returns pro-forma
-3.0% appreciation · 6.09% rent growth · sell at horizon
- IRR
- -12.4%
- Equity multiple
- 0.54×
- Total profit
- $-27,745
- Equity at exit
- $31,983
- IRR
- 0.6%
- Equity multiple
- 1.04×
- Total profit
- $2,635
- Equity at exit
- $18,546
Cash invested: $60,060 (down + closing). Projections, not guarantees.
Landlord ↔ Tenant lean methodology
- Overall (STATE)
- 81 Strongly Landlord-Friendly
- State Missouri
- 81 Strongly Landlord-Friendly · R+10
- County
- — inherits STATE
- City
- — inherits STATE
ZIP-level market 64119
- Rents YoY
- 6.1%
- Active inventory
- 184
- Price-to-rent
- 9.9×
Monthly cashflow live
- Estimated rent
- $1,802 high interval (Pro) →
- Mortgage (P&I)
- −$1,125
- Tax from tax record
- −$190 /mo · $2,279/yr
- Insurance
- −$89
- HOA
- −$0
- Vacancy / Maint / Mgmt
- −$379
- Net cashflow
- $20
Break-even live
Sensitivity live
| Price | -10% $141 | -5% $80 | +0% $20 | +5% $-41 | +10% $-102 |
|---|---|---|---|---|---|
| Rent | -10% $-123 | -5% $-51 | +0% $20 | +5% $91 | +10% $162 |
| Rate | -1.0pp $128 | -0.5pp $74 | base $20 | +0.5pp $-36 | +1.0pp $-92 |
UW: 25.0% down · 7.5% · 30yr · 1.5% tax · 5.0% vac · 8.0% maint · 8.0% mgmt
Financing live
Cash to close
- Down payment
- $53,625
- Closing costs
- $6,435
- Reserves months
- —
- Total cash needed
- —
Loan-product check · same deal, 3 products live
Conventional
25% down · 7.5% · 30yr
- Down + closing
- —
- Monthly P&I
- —
- Monthly cashflow
- —
- DSCR
- —
- Eligible?
- —
Personal DTI + credit; lowest rate.
DSCR
20% down · 8.5% · 30yr
- Down + closing
- —
- Monthly P&I
- —
- Monthly cashflow
- —
- DSCR
- —
- Eligible?
- —
No personal income docs; deal must DSCR.
Hard money
10% down · 12.0% · 12mo
- Down + closing
- —
- Monthly P&I
- —
- Monthly cashflow
- —
- DSCR
- —
- Eligible?
- —
Short-term bridge; refi at stabilization.
Rent comps 8 comps
| Address | Beds | Baths | Sqft | Rent | $/sqft | DOM | Units | Dist |
|---|---|---|---|---|---|---|---|---|
| 8030 NE 50th St Kansas City, MO | 3.0 | 1.5 | 1047 | $1,595 | $1.52 | 5d | 1 | 0.60mi |
| 5128 N Palmer Ave Kansas City, MO | 3.0 | 2.0 | 905 | $1,646 | $1.82 | 45d | 1 | 0.60mi |
| 4912 N Sycamore Dr Kansas City, MO | 4.0 | 2.0 | 1468 | $1,810 | $1.23 | 45d | 1 | 0.63mi |
| 4900 N Sycamore Dr Kansas City, MO | 3.0 | 2.0 | 1400 | $1,941 | $1.39 | 9d | 1 | 0.66mi |
| 1260 U.S. 69 Liberty, MO | 3.0 | 2.0 | 1086 | $1,196 | $1.10 | 12d | 1 | 0.93mi |
| 4780 N Corrington Ave Kansas City, MO | 2.0–3.0 | 2.5 | 1450 | $1,850 | $1.28 | 0d | 1 | 1.14mi |
| 6130 NE Vivion Rd Kansas City, MO | 3.0 | 1.0 | 1056 | $1,675 | $1.59 | 12d | 1 | 1.25mi |
| 6713 S Brookside Rd Pleasant Valley, MO | 3.0 | 2.0 | 1170 | $1,966 | $1.68 | 25d | 1 | 1.43mi |
Listing history 12 events
-
2026-04-29status Pending
-
2026-04-17$214,500 Active
-
2021-12-01soldstatus
-
2021-11-30soldstatus Closed 385-char remark
Show marketing remark (385 chars)
Enjoy this beautiful home located in the desirable Gracemor neighborhood with easy access to I-35 and I-435! This home offers 3 bedrooms and 1.5 baths. Newly renovated kitchen and bathrooms. All stainless steal appliances stay! Enjoy the spacious, flat backyard with beautiful matured trees. Enjoy the convenient neighborhood park with your family! Welcome to your new home sweet home.
-
2021-11-04status Pending 385-char remark
Show marketing remark (385 chars)
Enjoy this beautiful home located in the desirable Gracemor neighborhood with easy access to I-35 and I-435! This home offers 3 bedrooms and 1.5 baths. Newly renovated kitchen and bathrooms. All stainless steal appliances stay! Enjoy the spacious, flat backyard with beautiful matured trees. Enjoy the convenient neighborhood park with your family! Welcome to your new home sweet home.
-
2021-10-30$175,000 Active 385-char remark
Show marketing remark (385 chars)
Enjoy this beautiful home located in the desirable Gracemor neighborhood with easy access to I-35 and I-435! This home offers 3 bedrooms and 1.5 baths. Newly renovated kitchen and bathrooms. All stainless steal appliances stay! Enjoy the spacious, flat backyard with beautiful matured trees. Enjoy the convenient neighborhood park with your family! Welcome to your new home sweet home.
-
2018-04-20soldstatus Sold 301-char remark
Show marketing remark (301 chars)
Fresh paint & remodeled baths. Newer roof, siding, windows, gutters, garage door makes the exterior almost maintenance free. Inside HVAC system, new stove in the kitchen make the inside ready for your final touches. Home pre-inspected for termites & radon; no action required per attached.
-
2018-04-20soldstatus
Show marketing remark (301 chars)
Fresh paint & remodeled baths. Newer roof, siding, windows, gutters, garage door makes the exterior almost maintenance free. Inside HVAC system, new stove in the kitchen make the inside ready for your final touches. Home pre-inspected for termites & radon; no action required per attached.
-
2018-03-18status Pending 301-char remark
Show marketing remark (301 chars)
Fresh paint & remodeled baths. Newer roof, siding, windows, gutters, garage door makes the exterior almost maintenance free. Inside HVAC system, new stove in the kitchen make the inside ready for your final touches. Home pre-inspected for termites & radon; no action required per attached.
-
2018-03-15$117,900 Active 301-char remark
Show marketing remark (301 chars)
Fresh paint & remodeled baths. Newer roof, siding, windows, gutters, garage door makes the exterior almost maintenance free. Inside HVAC system, new stove in the kitchen make the inside ready for your final touches. Home pre-inspected for termites & radon; no action required per attached.
-
2017-11-25historical
-
2017-09-28$118,000 Active
ⓘ Source: listings_history table (triggers on properties + properties_extension) + one-shot
backfill from property_details.listing_events for pre-trigger history.
Tax reassessment forecast MO · Resets to sale price
- Current annual tax
- $2,279 · $190/mo
- Projected year-2 tax
- $2,279 · $190/mo
- Expected delta
- $0/yr ($0/mo · 0.0%)
ⓘ Screening estimate from a state-policy table — verify with the county assessor before closing.
Climate risk First Street
- Flood 1/10 Low FEMA zone X (unshaded) · 0% chance over 30 yrs
- Wildfire 1/10 Low
- Heat 4/10 Moderate 7 d/yr ≥107°F today · 17 d/yr by 30 yrs out
- Wind 2/10 Low
- Air quality 3/10 Moderate 2 unhealthy d/yr today · 3 by 30 yrs out
Nearby sold comps map
Loading sold comps map…
Walkable amenities ~0.75 mi
Loading nearby amenities…
Taxation est. · year 1
- Rental income
- $21,629
- − Mortgage interest
- −$12,015
- − Property taxes
- −$2,279
- − Insurance
- −$1,072
- − Repairs & maintenance
- −$1,730
- − Management
- −$1,730
- − Depreciation
- −$6,240
- Taxable loss
- −$3,439
- Est. tax savings @ 24.0%
- +$825
- After-tax cash flow
- $1,062/yr
For passive investors: Depreciation is non-cash, so a rental often shows a tax loss while cash-flowing — sheltering income. Rental losses are passive: they offset passive income freely, and up to $25,000/yr can offset ordinary (W-2) income if you actively participate and your MAGI is under $100k (phasing out to $0 by $150k); unused losses carry forward. On sale, claimed depreciation is recaptured at up to 25%, and gains may owe capital-gains tax (a 1031 exchange can defer both). Figures are a year-1 estimate at your 24.0% rate — not tax advice; consult a CPA.
Schools (NCES district)
- District
- North Kansas City 74
- NCES district ID
- 2922800
- Math proficiency
- 38% ▼ -11.00%
- Reading proficiency
- 49% ▼ -3.00%
- Median HH income
- $55,444
- Composite
- 37.88/100
- National rank
- #4321
- State rank
- #98 of 324 in MO
Livability — Kansas City
- Score
- 78/100
- State rank
- #28
- US rank
- #2671
Category grades
Schools grade is shown separately in the Schools card above.
Census & demographics
- Census place
- Kansas City, MO
- County
- Clay County · 220,651 people
- City population
- 439,467
- Metro
- Kansas City, MO-KS
- Population (ZIP)
- 33,199
- Household income
- $83,929
- Rent vs Own
- Severe rent burden
- 603.0
Population outlook (Clay County) Hauer SSP2
- Today (2025)
- 266,022 people
- By 2030
- 280,057 · +5.3%
- By 2040
- 306,153 · +15.1%
- By 2050
- 328,630 · +23.5%
- By 2075
- 375,182 · +41.0%
- By 2100
- 392,861 · +47.7%
Race, ethnicity, and origin ACS 2023
- Neighborhood character
- Predominantly White (75%)
- Race & ethnicity
- White 75% Hispanic / Latino 8% Two or more races 8% Black 7% Asian 3% Pacific Islander 1%
- Hispanic origin (detail)
- Mexican 6%
- Common ancestry
- Romanian 2% Italian 2% Slovak 2%
- Foreign-born
- 7% · Canada, Vietnam, Jamaica
- Languages at home
- 90% English-only · Spanish 5% Other Asian/Pacific 1% Other Indo-European 1%
Political lean MEDSL · Clay
- 2024 margin
- Lean R (+5.6) · D 46.4% · R 52.0% · Other 1.6%
- 2008→2024 swing
- -4.9pp toward R · 2008: -0.7pp · 2024: -5.6pp
- All cycles
- 2024: R+5.6 2020: R+4.1 2016: R+11.1 2012: R+8.4 2008: R+0.7
Not yet ingested
- Civics
- —
Market trends
- HPI YoY
- ▼ -253.39%
- Current HPI
- 215.8366
- Rent YoY
- ▲ 6.09%
- Metro
- Kansas City, MO-KS
- State GDP YoY
- ▲ 1.84%
- F500 in state
- 20
Industry mix (Fortune 500 HQ in MO)
| Industry | F500 HQs | Revenue |
|---|---|---|
| Healthcare | 1 | $163B |
|
||
| Insurance | 1 | $21B |
|
||
| Industrial Technology | 1 | $17B |
|
||
| Retail | 1 | $16B |
|
||
| Industrial Distribution | 1 | $10B |
|
||
| Utilities | 1 | $9B |
|
||
Price history
+81.8% since first listed12 events — show timeline
- 2026-04-29 Pending — Heartland MLS as Distributed by MLS Grid
- 2026-04-17 Listed $214,500 Heartland MLS as Distributed by MLS Grid
- 2021-12-01 Sold (Public Records) — Public Records
- 2021-11-30 Sold (MLS) — Heartland MLS as Distributed by MLS Grid
- 2021-11-04 Pending — Heartland MLS as Distributed by MLS Grid
- 2021-10-30 Listed $175,000 Heartland MLS as Distributed by MLS Grid
- 2018-04-20 Sold (Public Records) — Public Records
- 2018-04-20 Sold (MLS) — Heartland MLS as Distributed by MLS Grid
- 2018-03-18 Pending — Heartland MLS as Distributed by MLS Grid
- 2018-03-15 Listed $117,900 Heartland MLS as Distributed by MLS Grid
- 2017-11-25 Listing Removed — Heartland MLS as Distributed by MLS Grid
- 2017-09-28 Listed $118,000 Heartland MLS as Distributed by MLS Grid
Property tax history
+4.2%/yrLatest (2025): $2,279 · +8.4% YoY. Source: county tax records.
Cash-flow waterfall
monthlySold comps — $/sqft
last 12 mo · ≤1 miLoading sold comps…